| Param | Original file | Final file |
|---|---|---|
| Filename | modeM0/AS1G05_214T01_9000000652_05179cztM0_level2.evt | modeM0/AS1G05_214T01_9000000652_05179cztM0_level2_quad_clean.evt |
| Size (bytes) | 451,730,880 | 74,125,440 |
| Size | 430.8 MB | 70.7 MB |
| Events in quadrant A | 3,343,568 | 449,425 |
| Events in quadrant B | 3,299,327 | 456,613 |
| Events in quadrant C | 3,087,806 | 454,235 |
| Events in quadrant D | 3,502,359 | 424,965 |
| Mode SS | |||
|---|---|---|---|
| Quadrant | BADHDUFLAG | Total packets | Discarded packets |
| A | 0 | 136 | 0 |
| B | 0 | 136 | 0 |
| C | 0 | 136 | 0 |
| D | 0 | 136 | 0 |
| Mode M9 | |||
|---|---|---|---|
| Quadrant | BADHDUFLAG | Total packets | Discarded packets |
| A | 0 | 22 | 0 |
| B | 0 | 22 | 0 |
| C | 0 | 22 | 0 |
| D | 0 | 22 | 0 |
| Mode M0 | |||
|---|---|---|---|
| Quadrant | BADHDUFLAG | Total packets | Discarded packets |
| A | 0 | 14335 | 3 |
| B | 0 | 14120 | 2 |
| C | 0 | 13695 | 2 |
| D | 0 | 15007 | 2 |
| Quadrant | Total seconds | Saturated seconds | Saturation percentage |
|---|---|---|---|
| A | 6584 | 52 | 0.789793% |
| B | 6584 | 62 | 0.941677% |
| C | 6584 | 25 | 0.379708% |
| D | 6584 | 116 | 1.761847% |
Noise dominated data is calculated using 1-second bins in cleaned event files. If a bin has >2000 counts, and if more than 50% of those come from <1% of pixels, then it is considered to be noise-dominated and hence unusable.
| Quadrant | # 1 sec bins | Bins with >0 counts | Bins with >2000 counts | High rate bins dominated by noise | Noise dominated (total time) | Noise dominated (detector-on time) | Marked lightcurve |
|---|---|---|---|---|---|---|---|
| A | 8789 | 6586 | 9 | 9 | 0.10% | 0.14% | 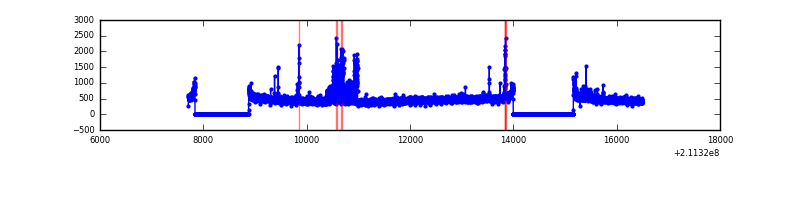 |
| B | 8789 | 6586 | 6 | 6 | 0.07% | 0.09% | 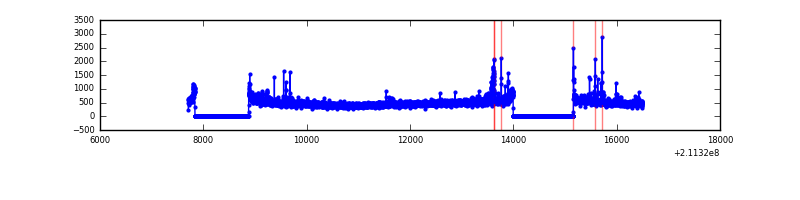 |
| C | 8789 | 6586 | 1 | 1 | 0.01% | 0.02% | 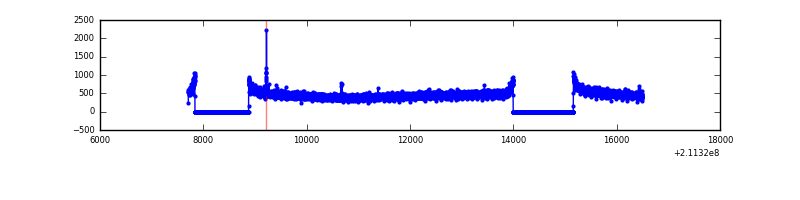 |
| D | 8789 | 6586 | 53 | 53 | 0.60% | 0.80% | 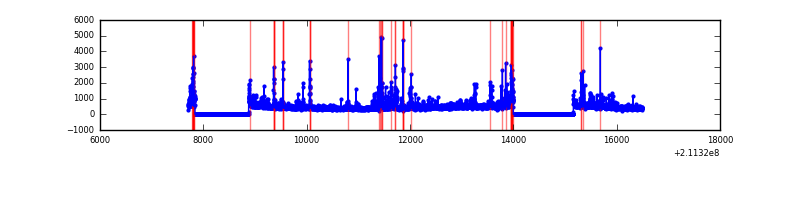 |
Top three noisy pixels from each quadrant. If the there are fewer than three noisy pixels in the level2.evt file, extra rows are filled as -1
| Pixel properties | Quadrant properties | ||||||
|---|---|---|---|---|---|---|---|
| Quadrant | DetID | PixID | Counts | Sigma | Mean | Median | Sigma |
| A | 0 | 247 | 244045 | 1507.75 | 784 | 767 | 161.4 |
| A | 0 | 50 | 54990 | 336.06 | 784 | 767 | 161.4 |
| A | 0 | 226 | 29504 | 178.1 | 784 | 767 | 161.4 |
| B | 15 | 204 | 71327 | 463.28 | 798 | 783 | 152.3 |
| B | 3 | 220 | 57647 | 373.44 | 798 | 783 | 152.3 |
| B | 4 | 80 | 33444 | 214.49 | 798 | 783 | 152.3 |
| C | 1 | 16 | 87413 | 484.3 | 767 | 770 | 178.9 |
| C | 12 | 4 | 7852 | 39.59 | 767 | 770 | 178.9 |
| C | 13 | 61 | 6153 | 30.09 | 767 | 770 | 178.9 |
| D | 2 | 33 | 177048 | 944.07 | 754 | 731 | 186.8 |
| D | 12 | 233 | 176721 | 942.32 | 754 | 731 | 186.8 |
| D | 7 | 237 | 99822 | 530.57 | 754 | 731 | 186.8 |
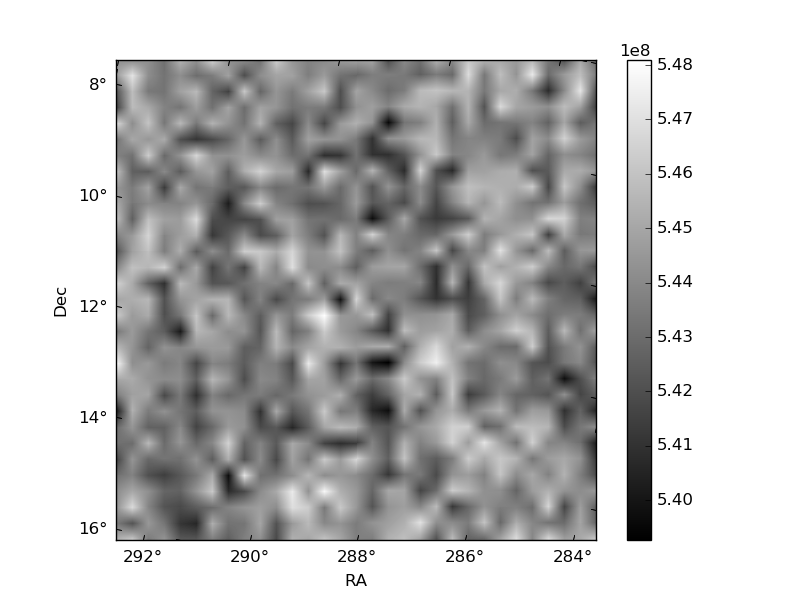
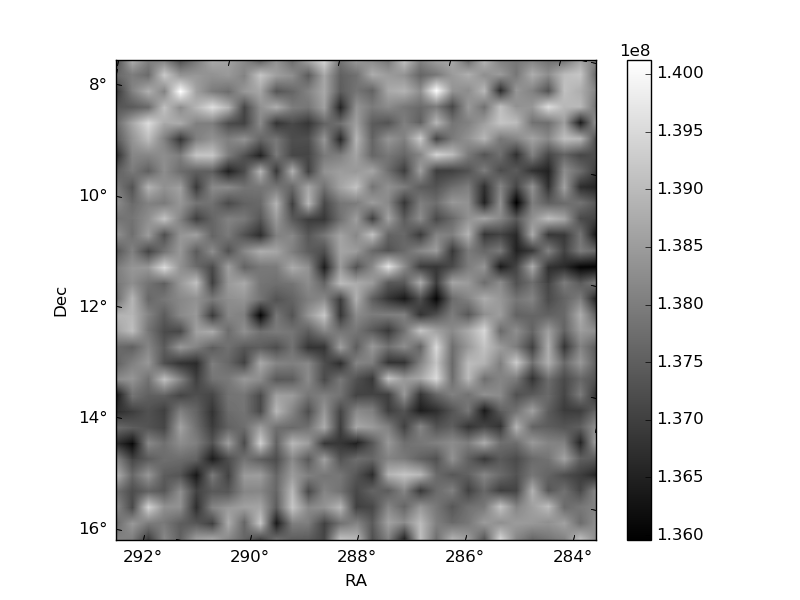
Histogram calculated using DETX and DETY for each event in the final _common_clean file
| Quadrant A | 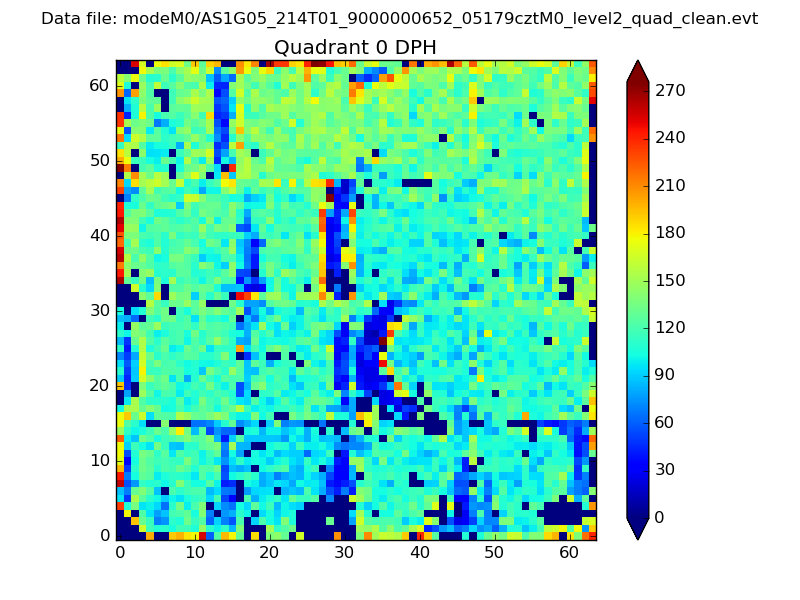 |
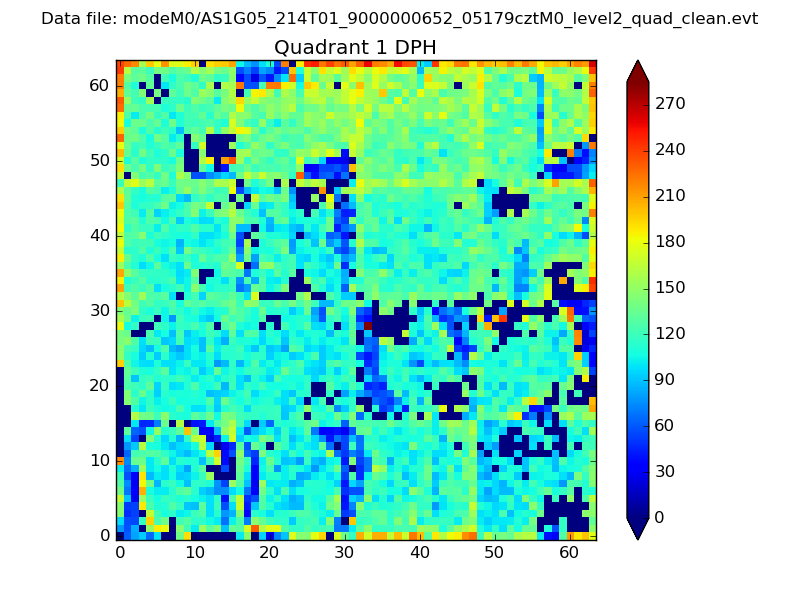 |
Quadrant B |
|---|---|---|---|
| Quadrant D | 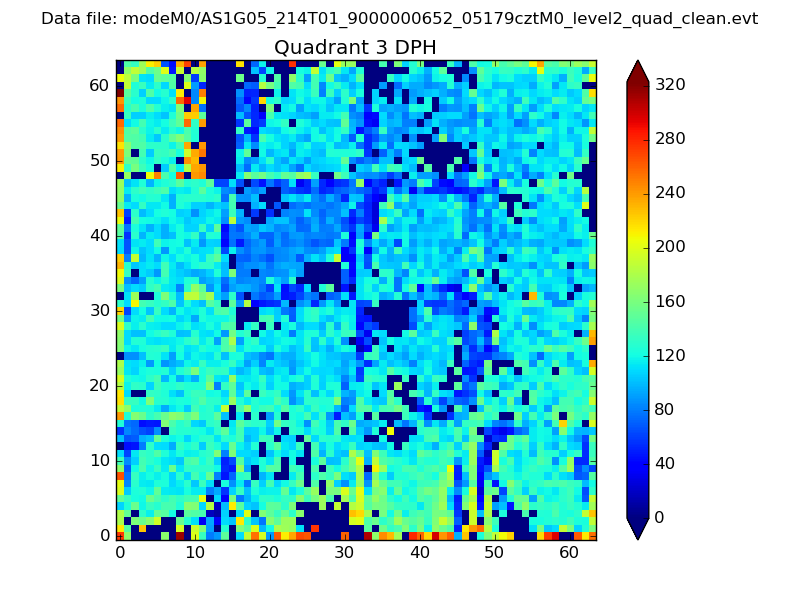 |
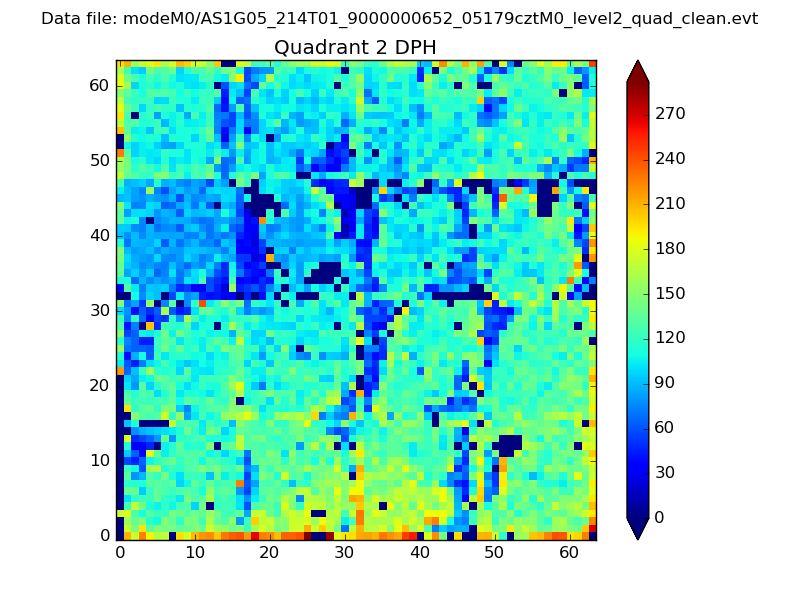 |
Quadrant C |
| Plot type | Count rate plots | Images |
|---|---|---|
| Comparison with Poisson distribution Blue bars denote a histogram of data divided into 1 sec bins. Red curve is a Poisson curve with rate = median count rate of data. |
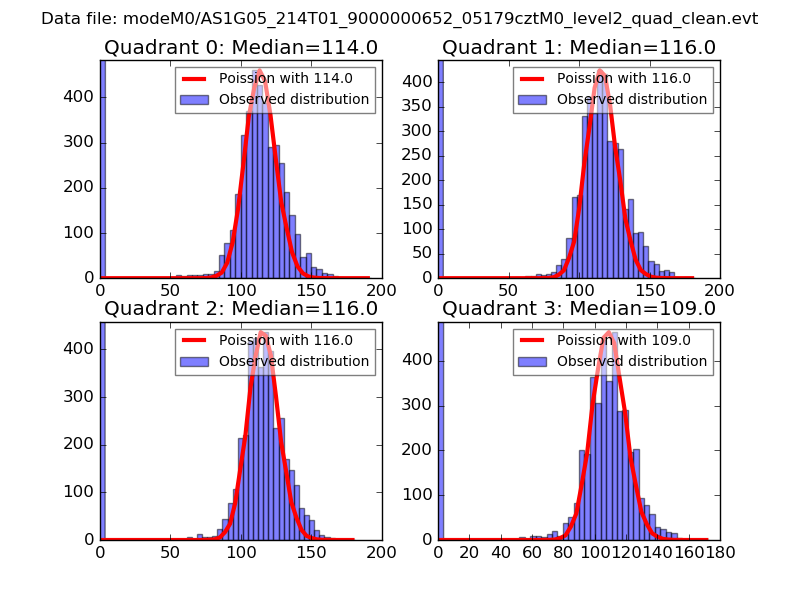 |
 |
| Quadrant-wise count rates Data is divided into 100 sec bins |
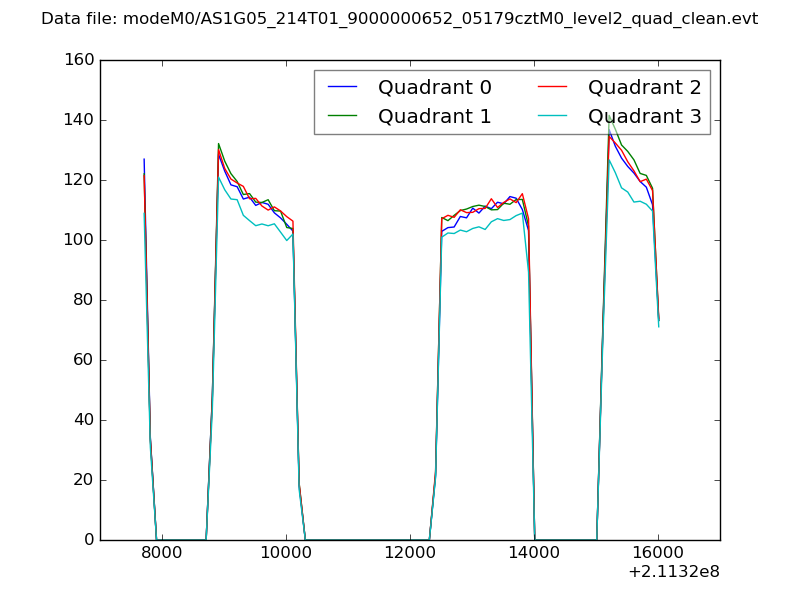 |
|
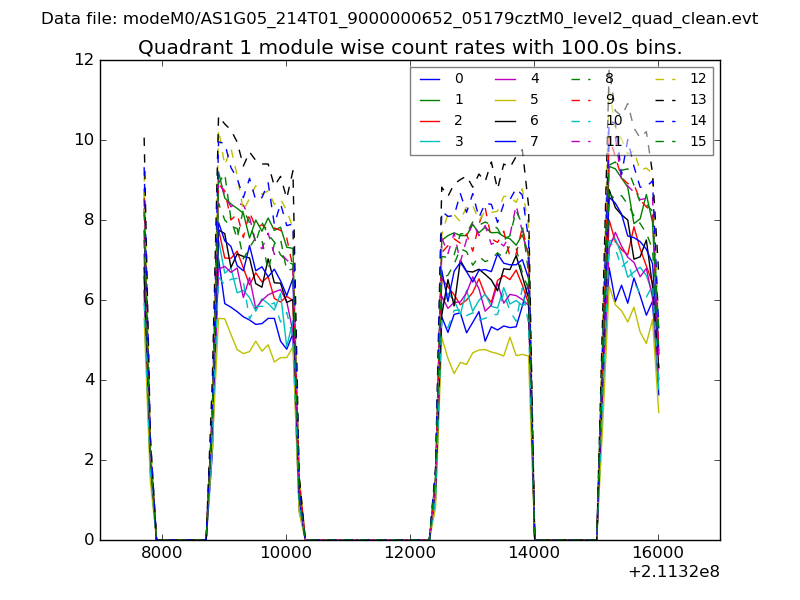
| Module-wise count rates for Quadrant A Data is divided into 100 sec bins |
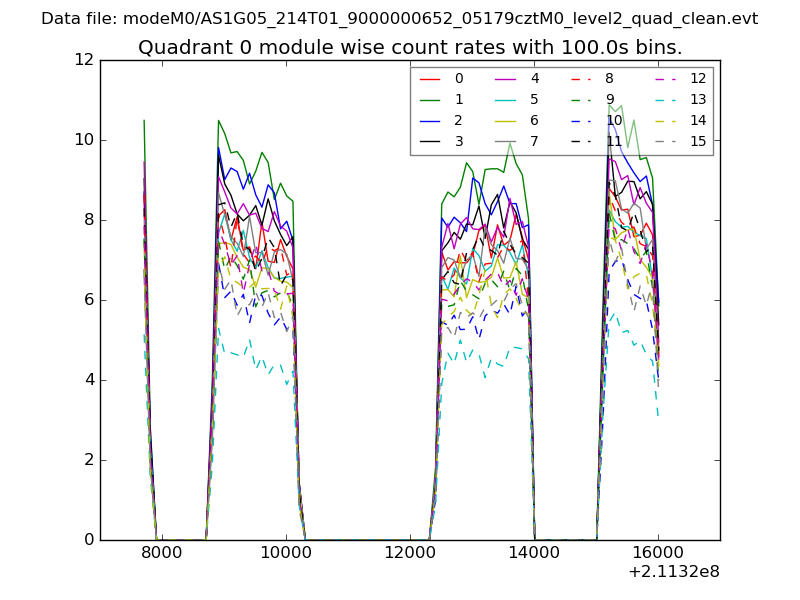 |
 |
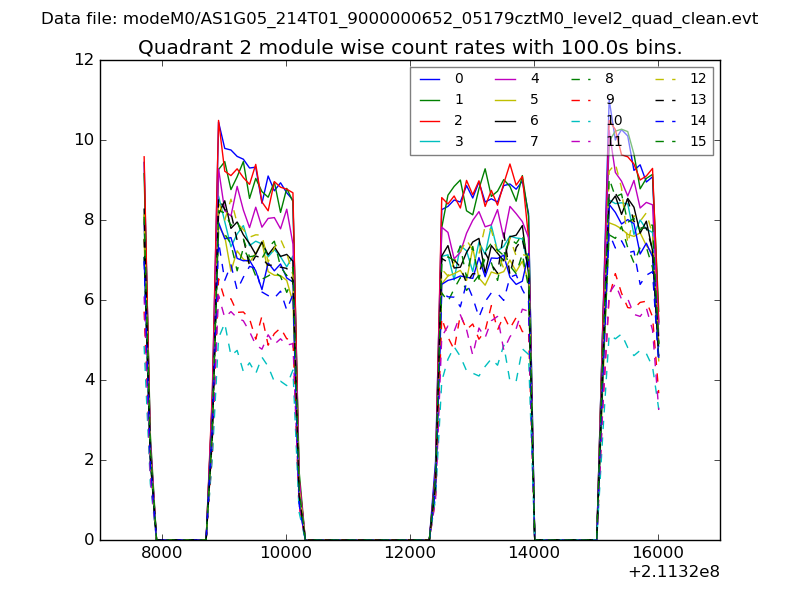
| Module-wise count rates for Quadrant B Data is divided into 100 sec bins |
 |
 |
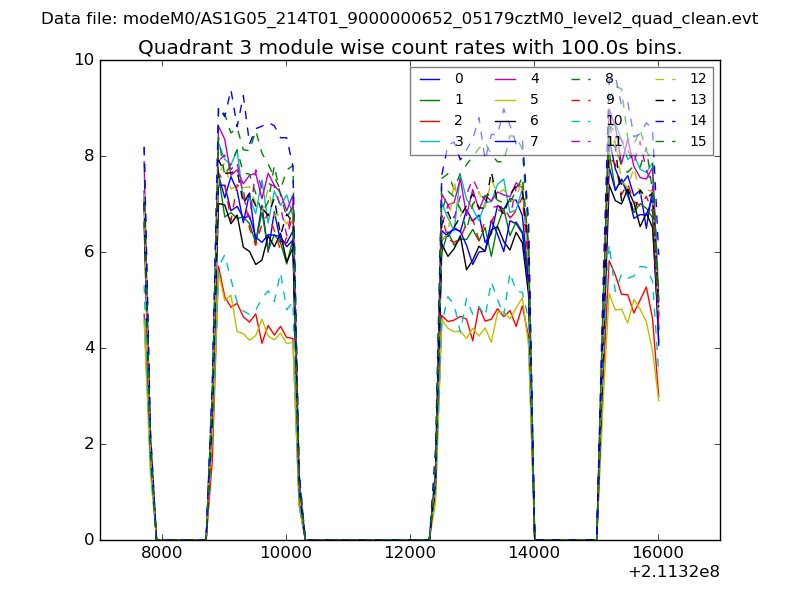
| Module-wise count rates for Quadrant C Data is divided into 100 sec bins |
 |
 |
| Module-wise count rates for Quadrant D Data is divided into 100 sec bins |
 |
 |
| Parameter | Plot |
|---|---|
| CZT HV Monitor | 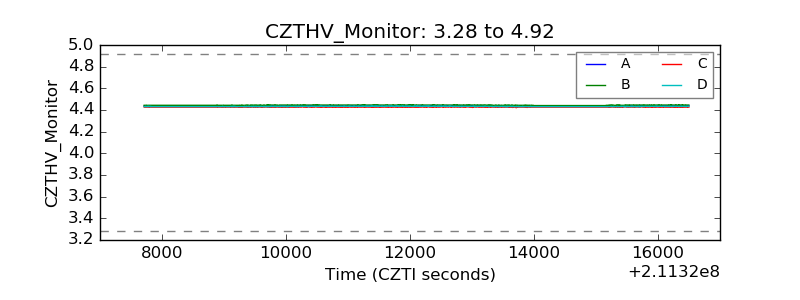 |
| D_VDD | 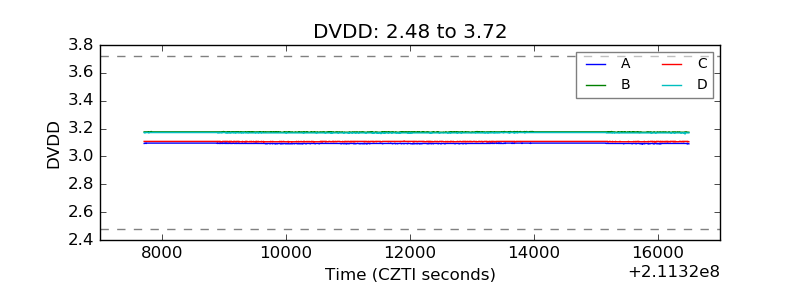 |
| Temperature 1 | 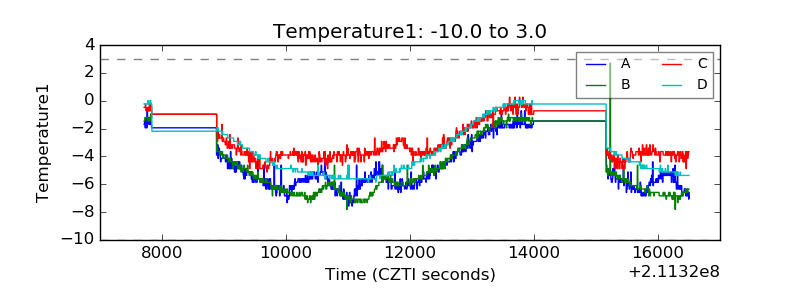 |
| Veto HV Monitor | 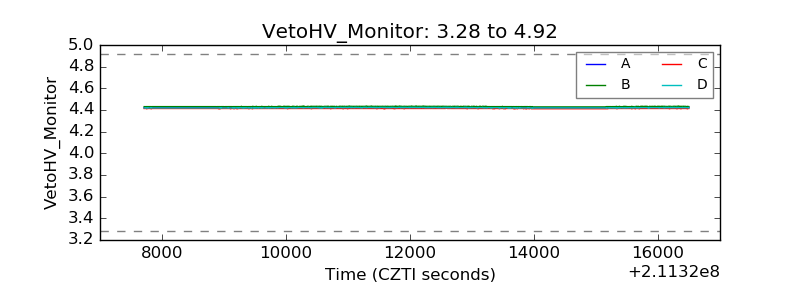 |
| Veto LLD | 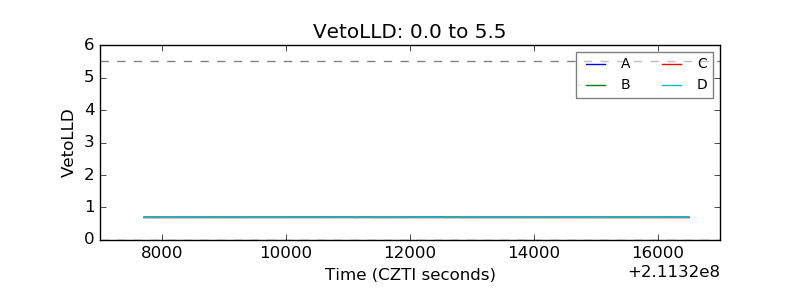 |
| Alpha Counter | 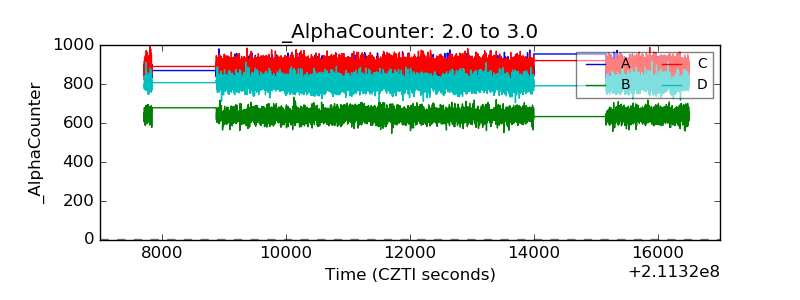 |
| _CPM_Rate | 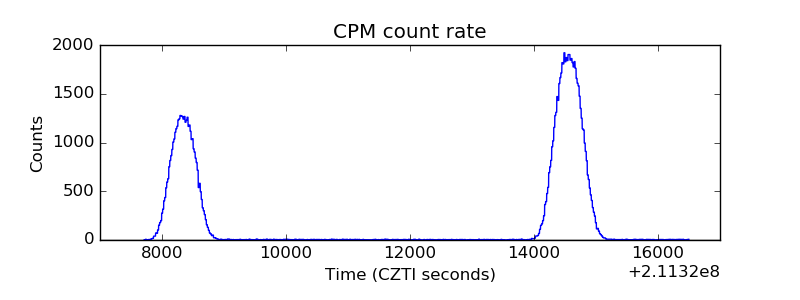 |
| CZT Counter | 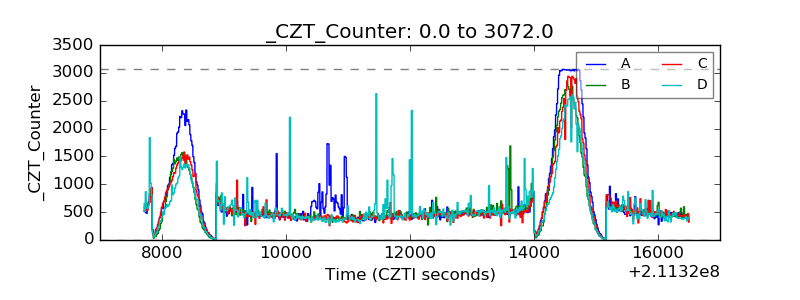 |
| +2.5 Volts monitor |  |
| +5 Volts monitor |  |
| _ROLL_ROT | 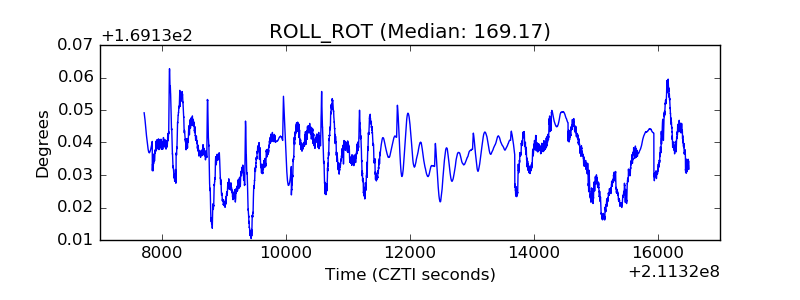 |
| _Roll_DEC | 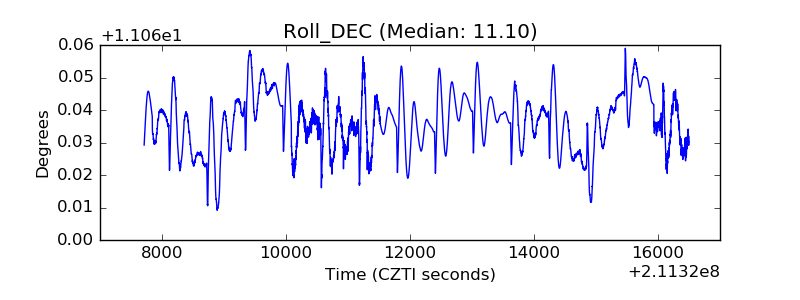 |
| _Roll_RA | 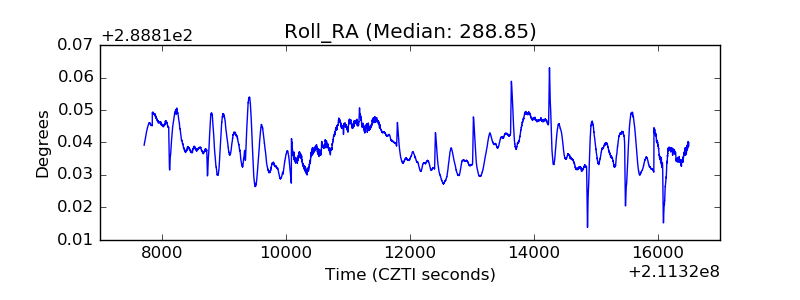 |
| Veto Counter | 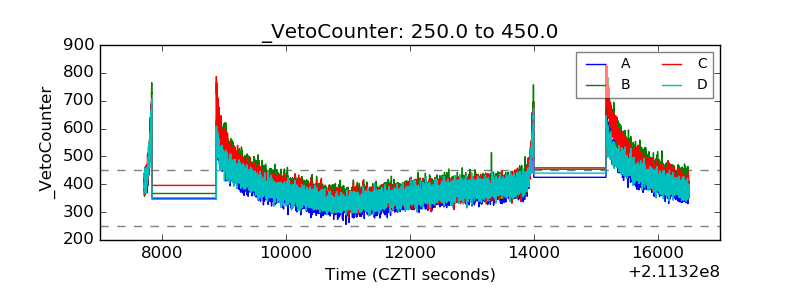 |