| Param | Original file | Final file |
|---|---|---|
| Filename | modeM0/AS1G05_214T01_9000000652_05180cztM0_level2.evt | modeM0/AS1G05_214T01_9000000652_05180cztM0_level2_quad_clean.evt |
| Size (bytes) | 426,841,920 | 65,793,600 |
| Size | 407.1 MB | 62.7 MB |
| Events in quadrant A | 3,015,357 | 389,224 |
| Events in quadrant B | 3,250,205 | 398,900 |
| Events in quadrant C | 3,041,862 | 394,048 |
| Events in quadrant D | 3,189,588 | 368,640 |
| Mode SS | |||
|---|---|---|---|
| Quadrant | BADHDUFLAG | Total packets | Discarded packets |
| A | 0 | 130 | 0 |
| B | 0 | 130 | 0 |
| C | 0 | 130 | 0 |
| D | 0 | 130 | 0 |
| Mode M9 | |||
|---|---|---|---|
| Quadrant | BADHDUFLAG | Total packets | Discarded packets |
| A | 0 | 17 | 0 |
| B | 0 | 17 | 0 |
| C | 0 | 17 | 0 |
| D | 0 | 18 | 0 |
| Mode M0 | |||
|---|---|---|---|
| Quadrant | BADHDUFLAG | Total packets | Discarded packets |
| A | 0 | 13064 | 3 |
| B | 0 | 13621 | 2 |
| C | 0 | 13138 | 2 |
| D | 0 | 13929 | 2 |
| Quadrant | Total seconds | Saturated seconds | Saturation percentage |
|---|---|---|---|
| A | 6318 | 39 | 0.617284% |
| B | 6318 | 67 | 1.060462% |
| C | 6318 | 21 | 0.332384% |
| D | 6318 | 82 | 1.297879% |
Noise dominated data is calculated using 1-second bins in cleaned event files. If a bin has >2000 counts, and if more than 50% of those come from <1% of pixels, then it is considered to be noise-dominated and hence unusable.
| Quadrant | # 1 sec bins | Bins with >0 counts | Bins with >2000 counts | High rate bins dominated by noise | Noise dominated (total time) | Noise dominated (detector-on time) | Marked lightcurve |
|---|---|---|---|---|---|---|---|
| A | 7548 | 6319 | 2 | 2 | 0.03% | 0.03% | 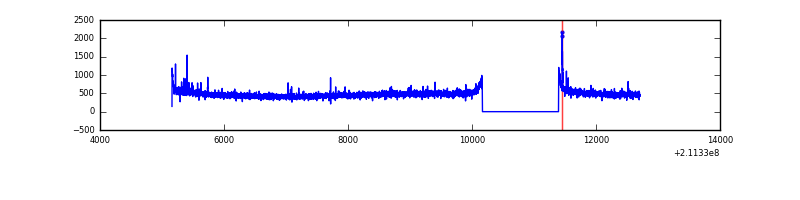 |
| B | 7548 | 6319 | 12 | 12 | 0.16% | 0.19% | 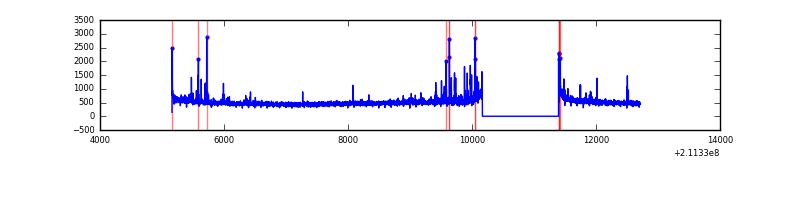 |
| C | 7548 | 6319 | 0 | 0 | 0.00% | 0.00% | 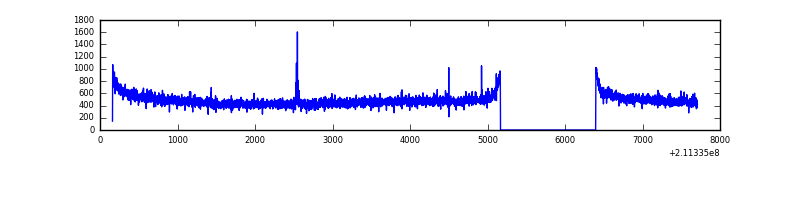 |
| D | 7548 | 6319 | 50 | 50 | 0.66% | 0.79% | 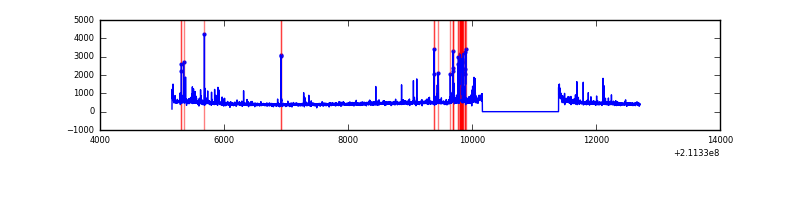 |
Top three noisy pixels from each quadrant. If the there are fewer than three noisy pixels in the level2.evt file, extra rows are filled as -1
| Pixel properties | Quadrant properties | ||||||
|---|---|---|---|---|---|---|---|
| Quadrant | DetID | PixID | Counts | Sigma | Mean | Median | Sigma |
| A | 0 | 50 | 24355 | 148.86 | 773 | 758 | 158.5 |
| A | 0 | 247 | 9264 | 53.66 | 773 | 758 | 158.5 |
| A | 0 | 226 | 8323 | 47.72 | 773 | 758 | 158.5 |
| B | 4 | 80 | 108323 | 722.39 | 786 | 771 | 148.9 |
| B | 4 | 48 | 32976 | 216.31 | 786 | 771 | 148.9 |
| B | 15 | 54 | 18663 | 120.17 | 786 | 771 | 148.9 |
| C | 1 | 16 | 81225 | 457.69 | 753 | 758 | 175.8 |
| C | 12 | 4 | 10369 | 54.67 | 753 | 758 | 175.8 |
| C | 8 | 128 | 6342 | 31.76 | 753 | 758 | 175.8 |
| D | 2 | 33 | 166683 | 916.27 | 739 | 717 | 181.1 |
| D | 14 | 34 | 62886 | 343.22 | 739 | 717 | 181.1 |
| D | 2 | 136 | 53900 | 293.61 | 739 | 717 | 181.1 |
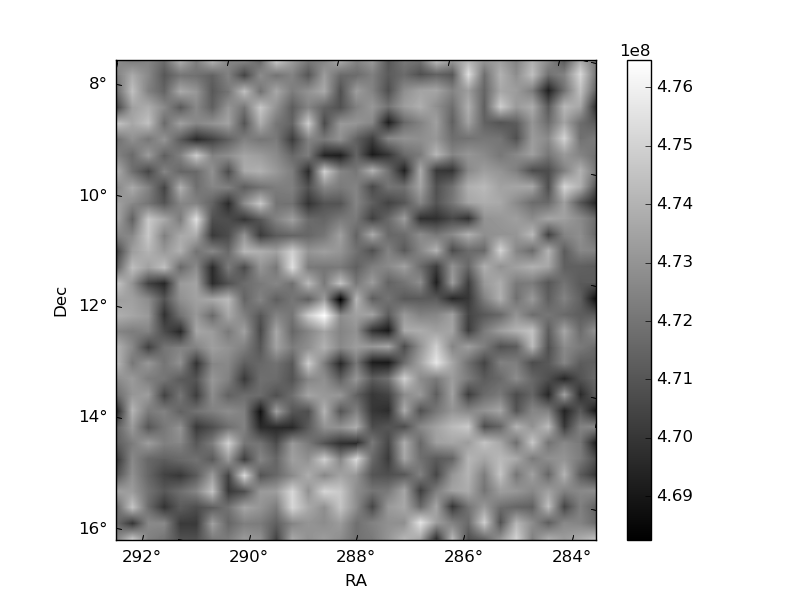
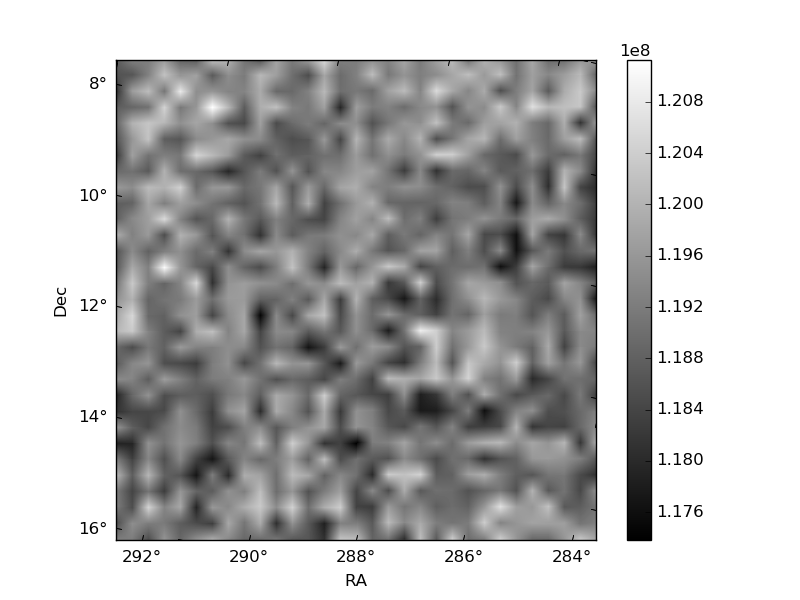
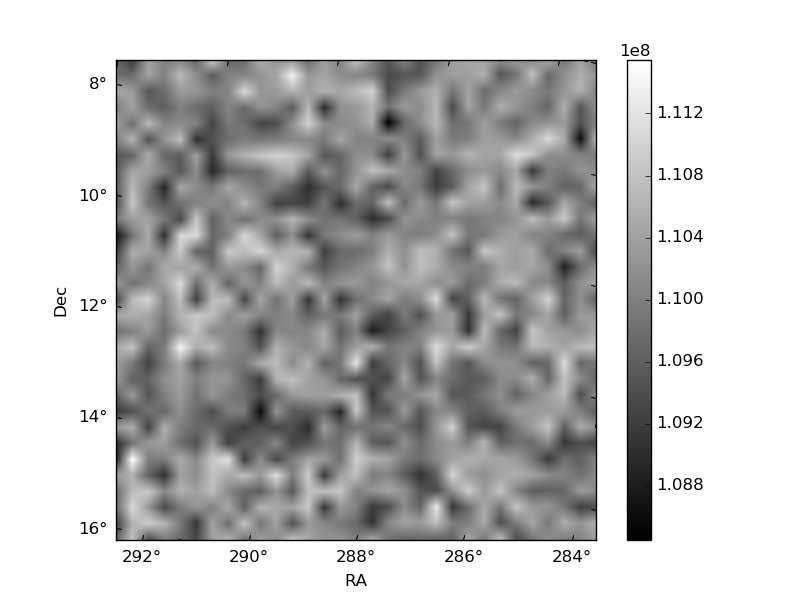
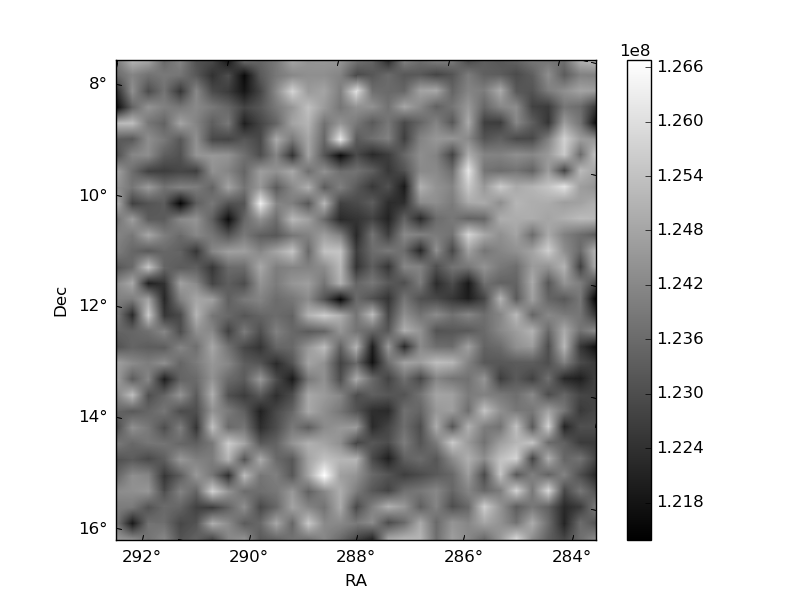
Histogram calculated using DETX and DETY for each event in the final _common_clean file
| Quadrant A | 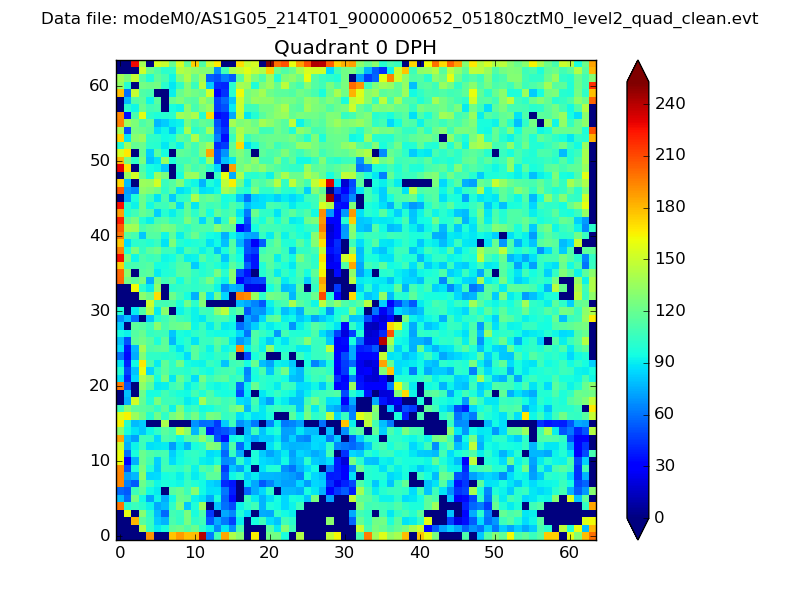 |
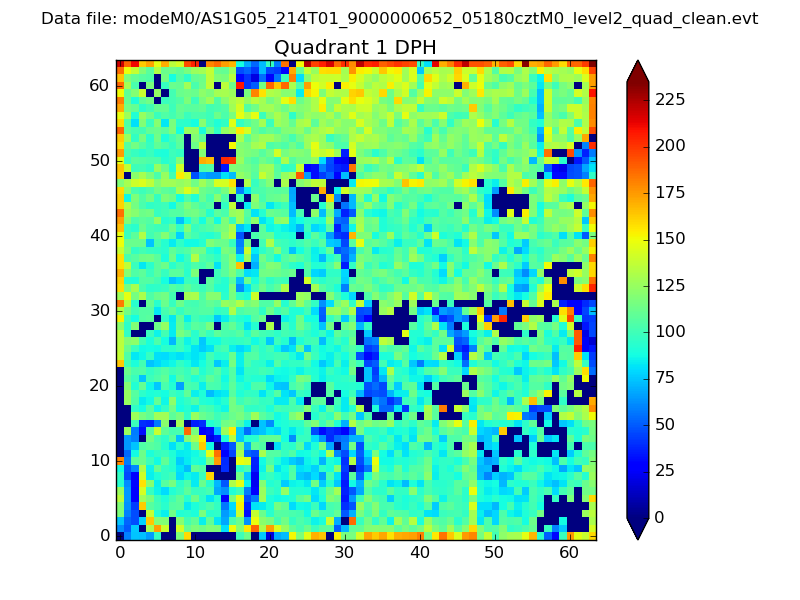 |
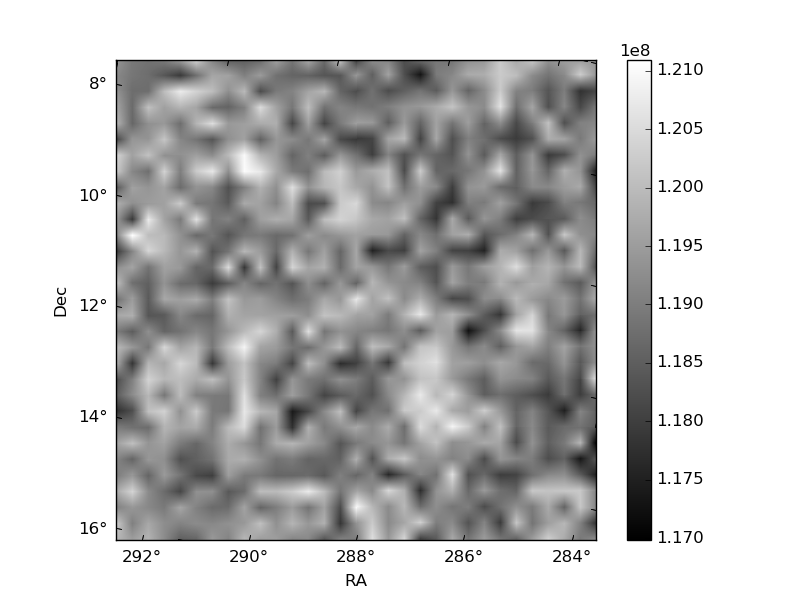
Quadrant B |
|---|---|---|---|
| Quadrant D | 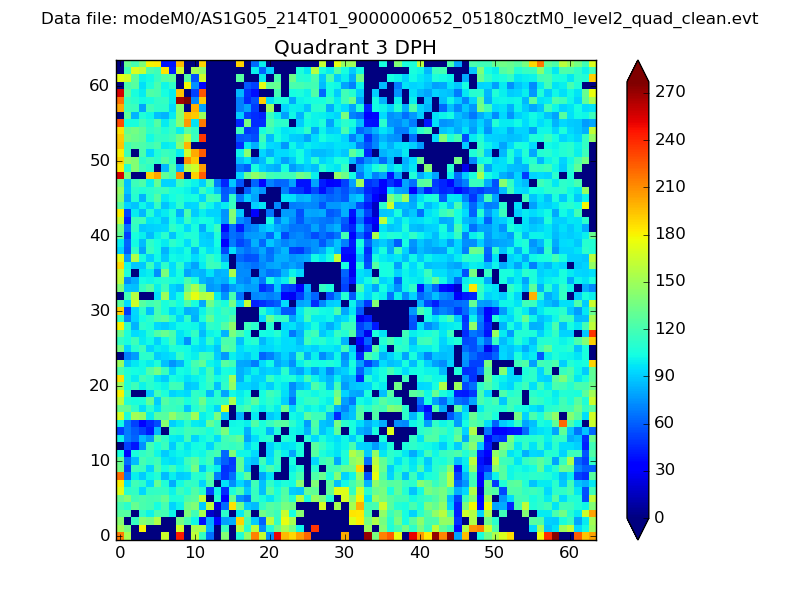 |
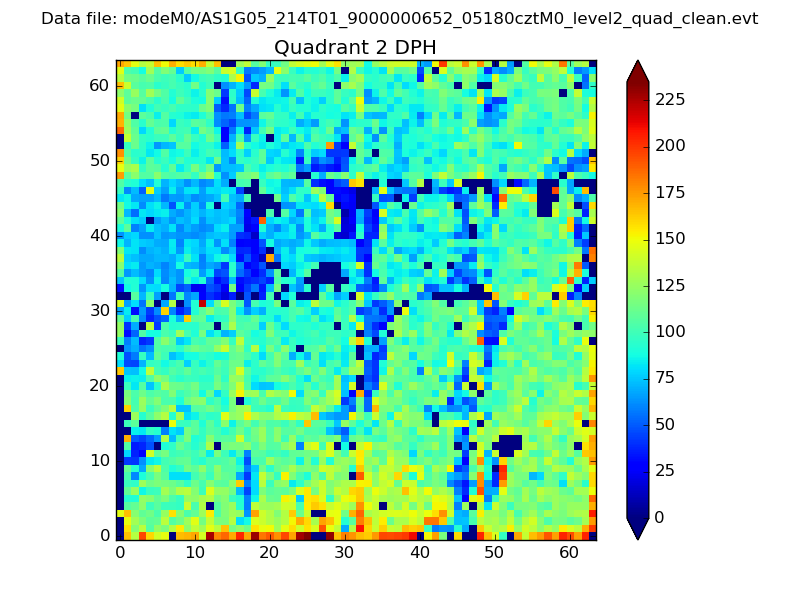 |
Quadrant C |
| Plot type | Count rate plots | Images |
|---|---|---|
| Comparison with Poisson distribution Blue bars denote a histogram of data divided into 1 sec bins. Red curve is a Poisson curve with rate = median count rate of data. |
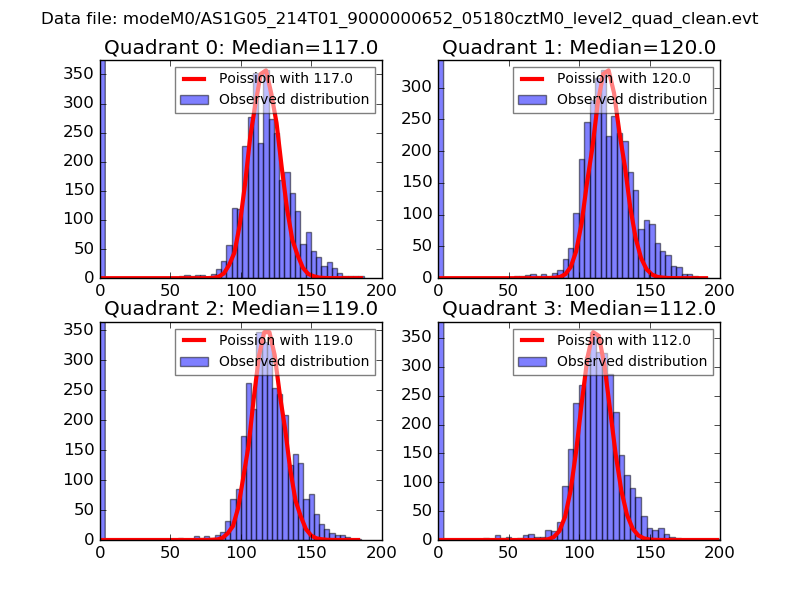 |
 |
| Quadrant-wise count rates Data is divided into 100 sec bins |
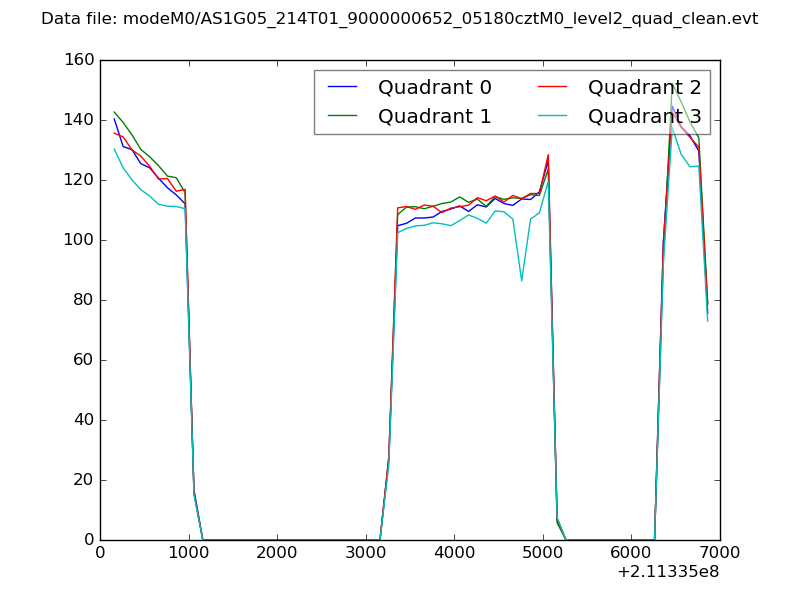 |
|
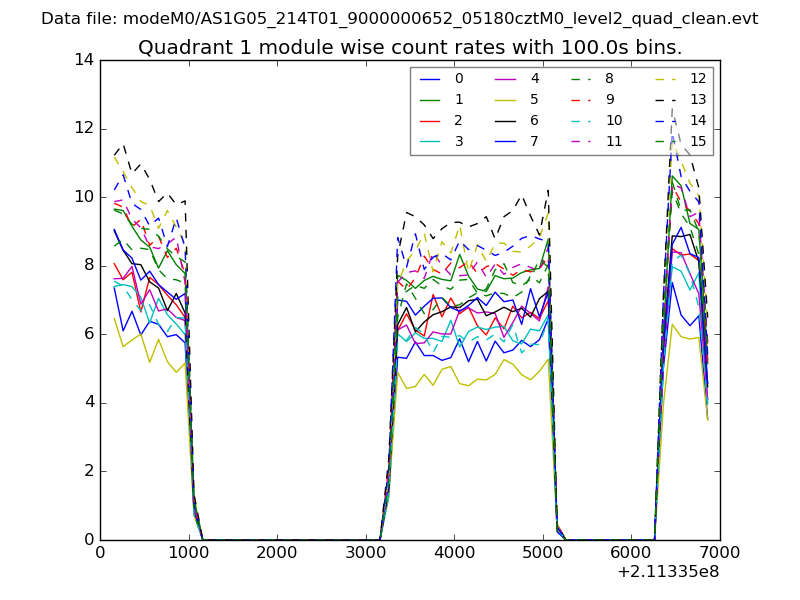
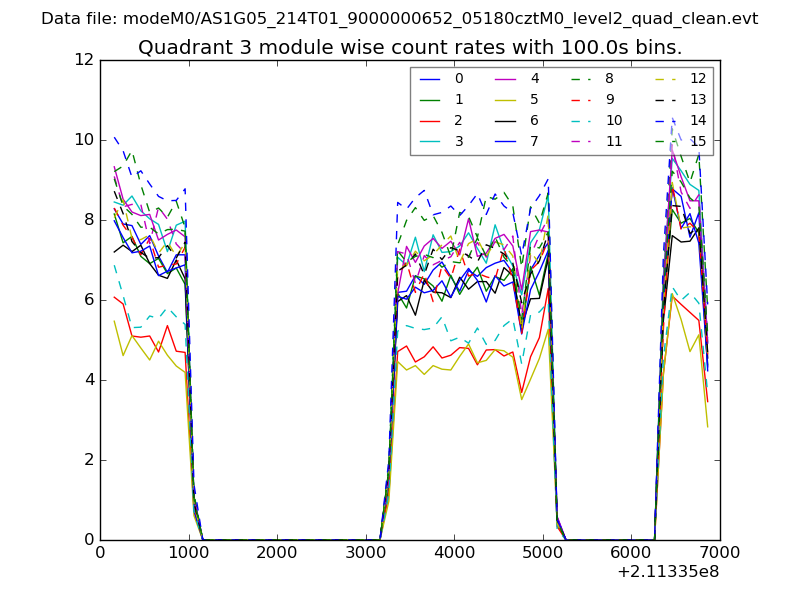
| Module-wise count rates for Quadrant A Data is divided into 100 sec bins |
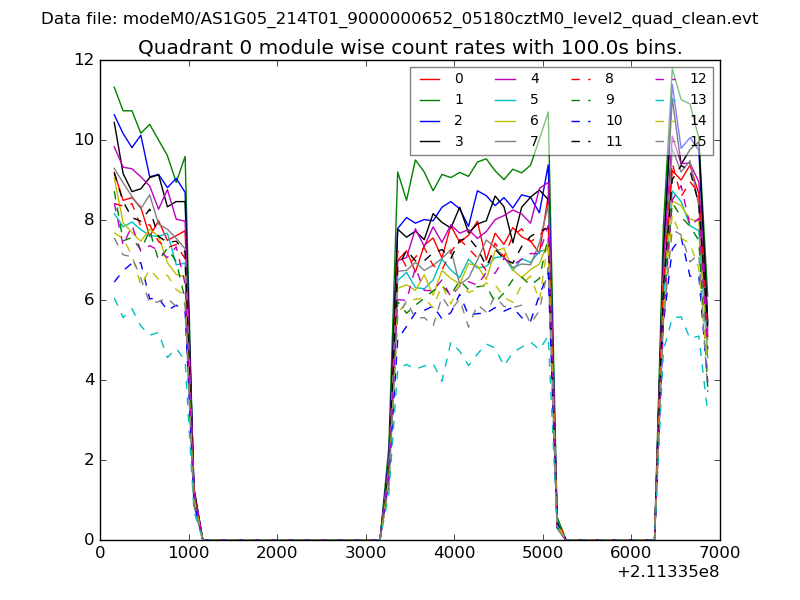 |
 |
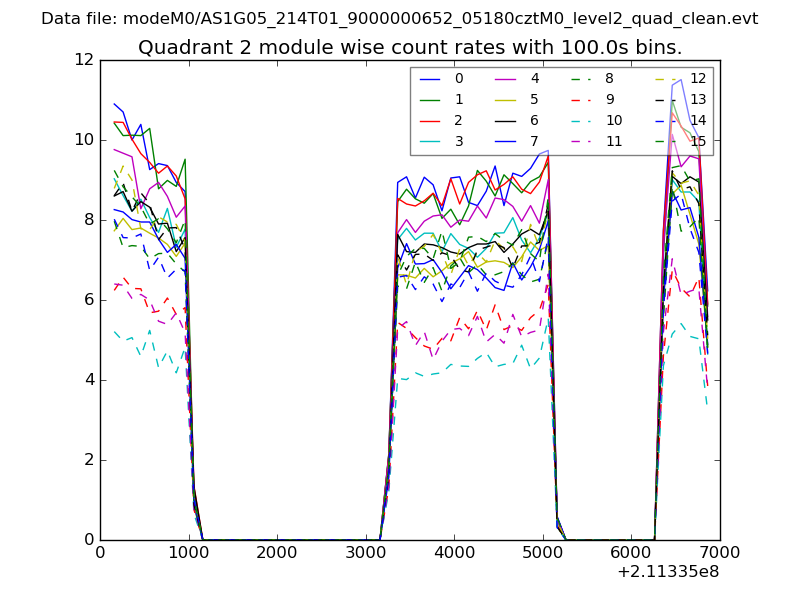
| Module-wise count rates for Quadrant B Data is divided into 100 sec bins |
 |
 |
| Module-wise count rates for Quadrant C Data is divided into 100 sec bins |
 |
 |
| Module-wise count rates for Quadrant D Data is divided into 100 sec bins |
 |
 |
| Parameter | Plot |
|---|---|
| CZT HV Monitor | 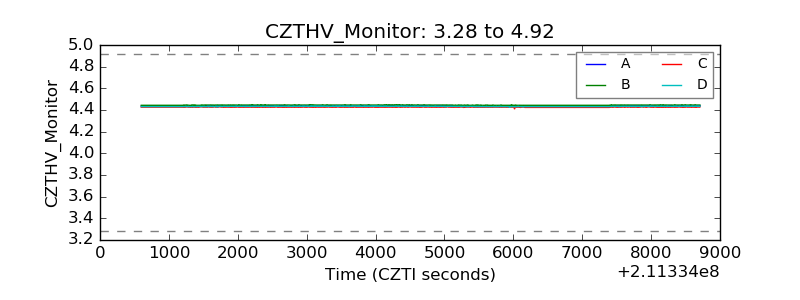 |
| D_VDD | 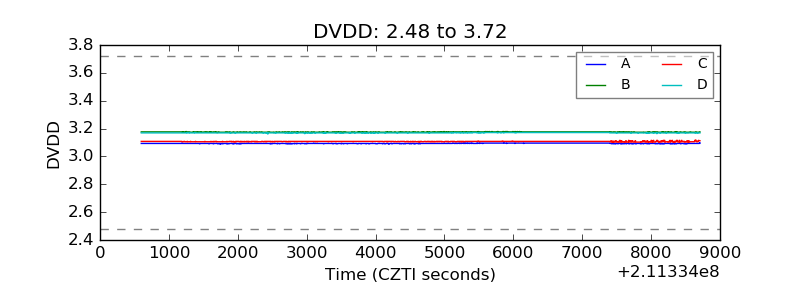 |
| Temperature 1 | 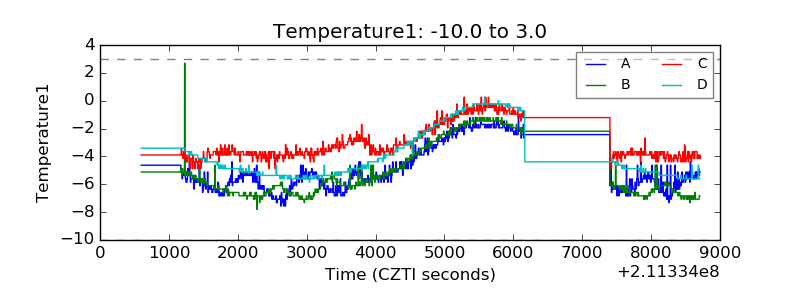 |
| Veto HV Monitor | 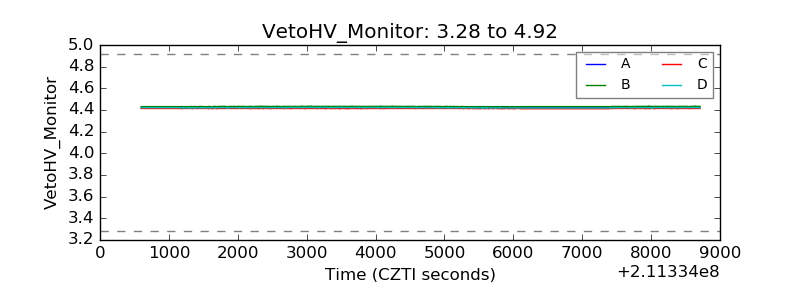 |
| Veto LLD | 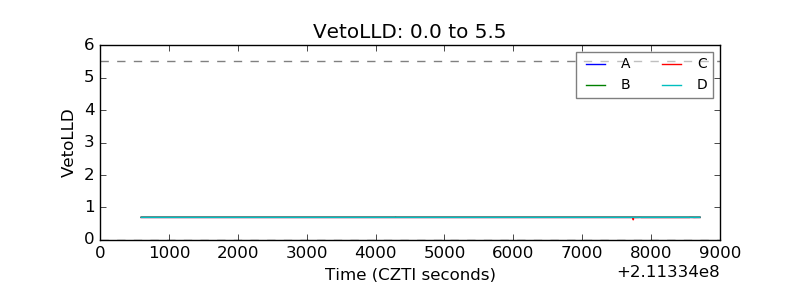 |
| Alpha Counter | 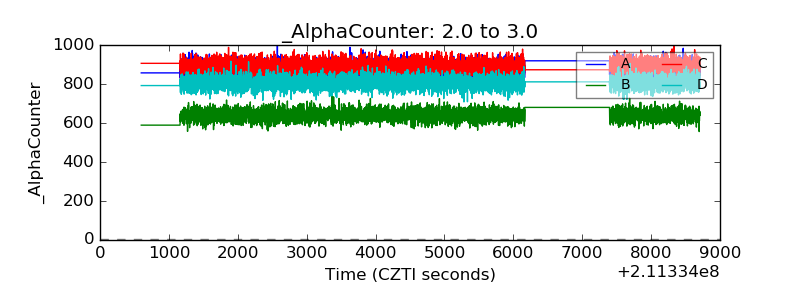 |
| _CPM_Rate | 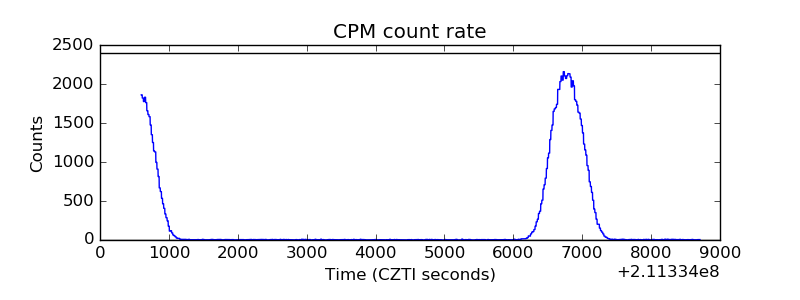 |
| CZT Counter | 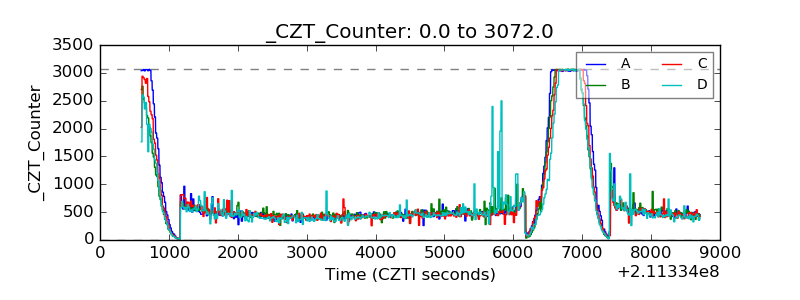 |
| +2.5 Volts monitor |  |
| +5 Volts monitor |  |
| _ROLL_ROT | 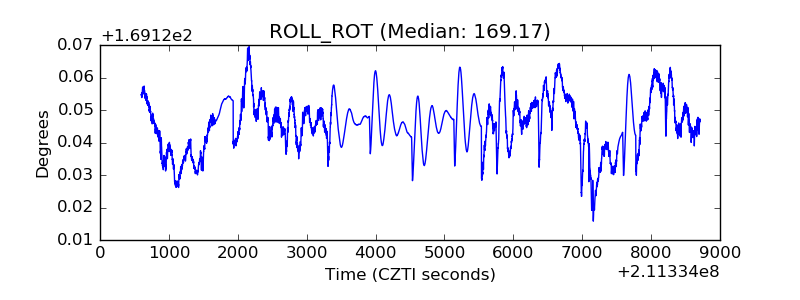 |
| _Roll_DEC | 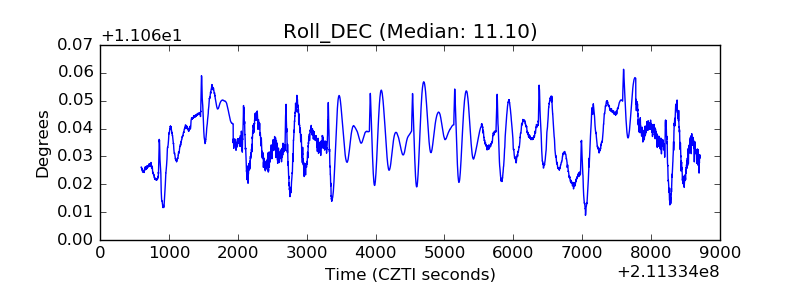 |
| _Roll_RA | 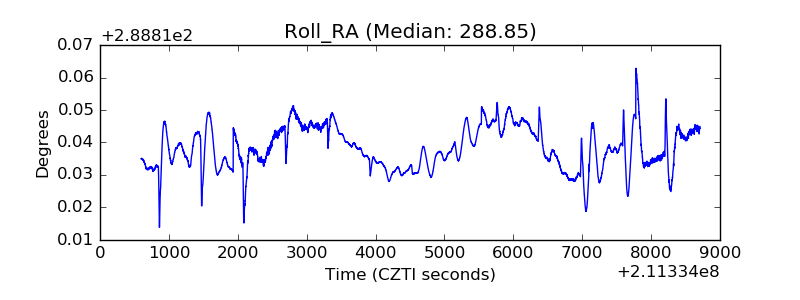 |
| Veto Counter | 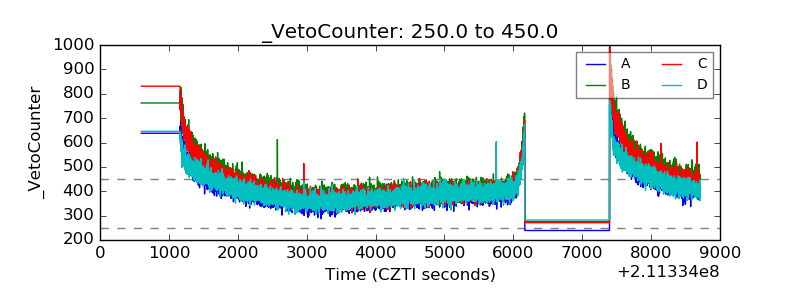 |