| Param | Original file | Final file |
|---|---|---|
| Filename | modeM0/AS1G05_214T01_9000000652_05181cztM0_level2.evt | modeM0/AS1G05_214T01_9000000652_05181cztM0_level2_quad_clean.evt |
| Size (bytes) | 442,949,760 | 56,301,120 |
| Size | 422.4 MB | 53.7 MB |
| Events in quadrant A | 3,270,902 | 315,858 |
| Events in quadrant B | 3,294,726 | 322,204 |
| Events in quadrant C | 3,117,793 | 318,831 |
| Events in quadrant D | 3,294,304 | 298,996 |
| Mode SS | |||
|---|---|---|---|
| Quadrant | BADHDUFLAG | Total packets | Discarded packets |
| A | 0 | 130 | 0 |
| B | 0 | 130 | 0 |
| C | 0 | 130 | 0 |
| D | 0 | 130 | 0 |
| Mode M9 | |||
|---|---|---|---|
| Quadrant | BADHDUFLAG | Total packets | Discarded packets |
| A | 0 | 13 | 0 |
| B | 0 | 13 | 0 |
| C | 0 | 13 | 0 |
| D | 0 | 13 | 0 |
| Mode M0 | |||
|---|---|---|---|
| Quadrant | BADHDUFLAG | Total packets | Discarded packets |
| A | 0 | 13684 | 2 |
| B | 0 | 13620 | 1 |
| C | 0 | 13280 | 1 |
| D | 0 | 14186 | 1 |
| Quadrant | Total seconds | Saturated seconds | Saturation percentage |
|---|---|---|---|
| A | 6431 | 31 | 0.482040% |
| B | 6431 | 49 | 0.761934% |
| C | 6431 | 24 | 0.373192% |
| D | 6431 | 85 | 1.321723% |
Noise dominated data is calculated using 1-second bins in cleaned event files. If a bin has >2000 counts, and if more than 50% of those come from <1% of pixels, then it is considered to be noise-dominated and hence unusable.
| Quadrant | # 1 sec bins | Bins with >0 counts | Bins with >2000 counts | High rate bins dominated by noise | Noise dominated (total time) | Noise dominated (detector-on time) | Marked lightcurve |
|---|---|---|---|---|---|---|---|
| A | 7726 | 6432 | 4 | 4 | 0.05% | 0.06% | 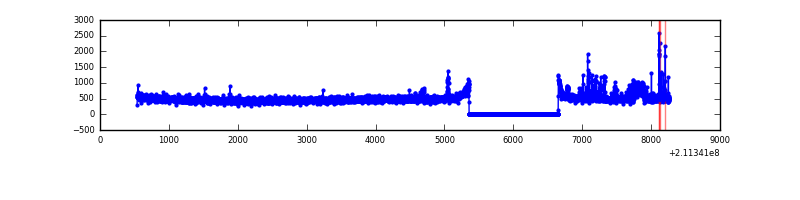 |
| B | 7726 | 6432 | 2 | 2 | 0.03% | 0.03% | 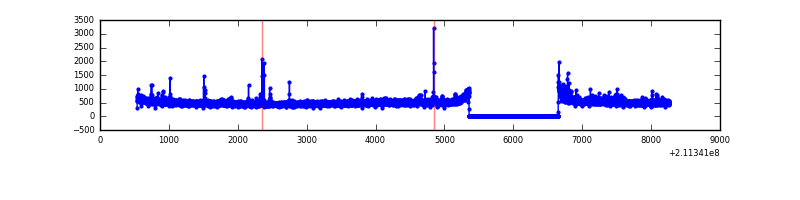 |
| C | 7726 | 6432 | 7 | 7 | 0.09% | 0.11% | 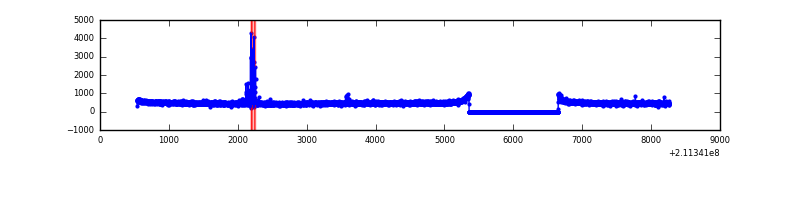 |
| D | 7726 | 6432 | 62 | 62 | 0.80% | 0.96% | 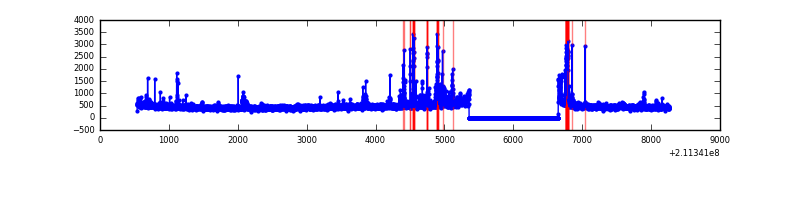 |
Top three noisy pixels from each quadrant. If the there are fewer than three noisy pixels in the level2.evt file, extra rows are filled as -1
| Pixel properties | Quadrant properties | ||||||
|---|---|---|---|---|---|---|---|
| Quadrant | DetID | PixID | Counts | Sigma | Mean | Median | Sigma |
| A | 0 | 247 | 168090 | 1035.71 | 798 | 784 | 161.5 |
| A | 0 | 226 | 22530 | 134.62 | 798 | 784 | 161.5 |
| A | 0 | 50 | 15795 | 92.93 | 798 | 784 | 161.5 |
| B | 4 | 80 | 61460 | 395.92 | 813 | 798 | 153.2 |
| B | 15 | 204 | 39870 | 255.01 | 813 | 798 | 153.2 |
| B | 0 | 219 | 19879 | 124.54 | 813 | 798 | 153.2 |
| C | 9 | 16 | 40334 | 220.23 | 775 | 781 | 179.6 |
| C | 1 | 16 | 18925 | 101.03 | 775 | 781 | 179.6 |
| C | 8 | 128 | 16478 | 87.4 | 775 | 781 | 179.6 |
| D | 2 | 33 | 221196 | 1184.58 | 758 | 737 | 186.1 |
| D | 7 | 237 | 64934 | 344.95 | 758 | 737 | 186.1 |
| D | 14 | 34 | 58380 | 309.73 | 758 | 737 | 186.1 |
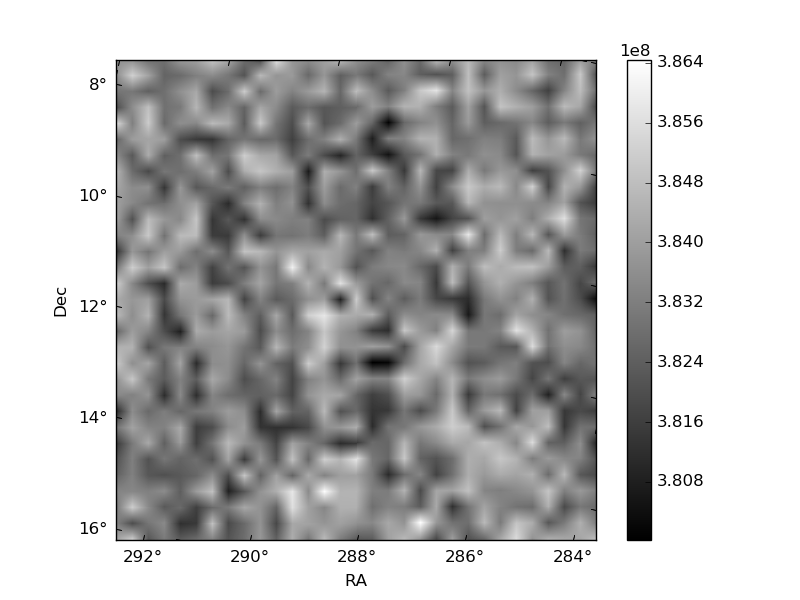
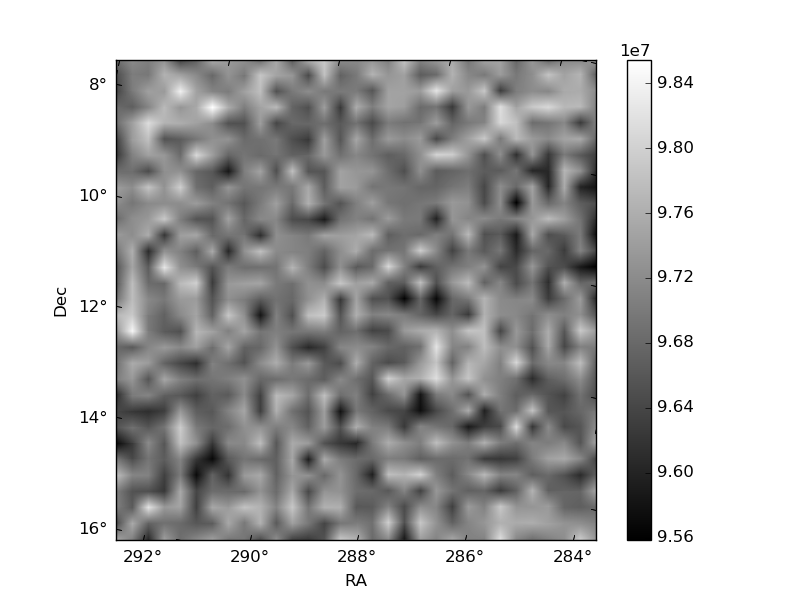
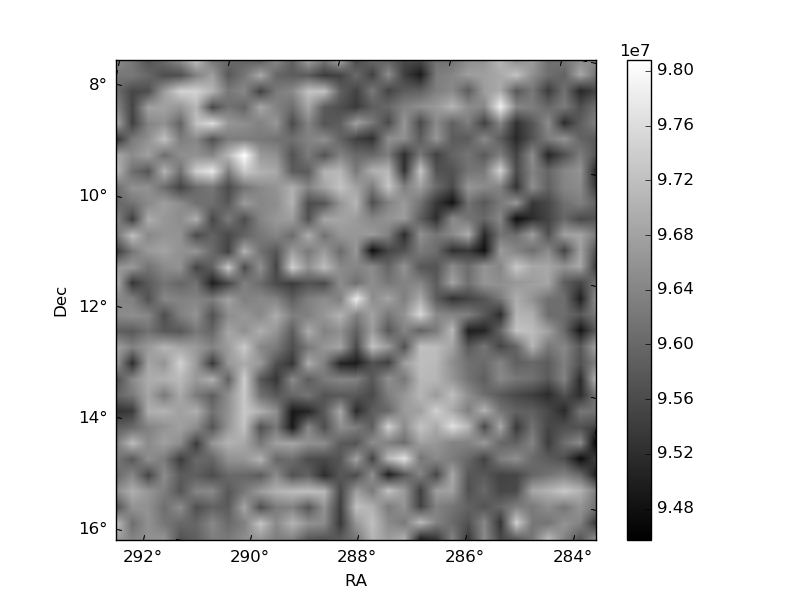
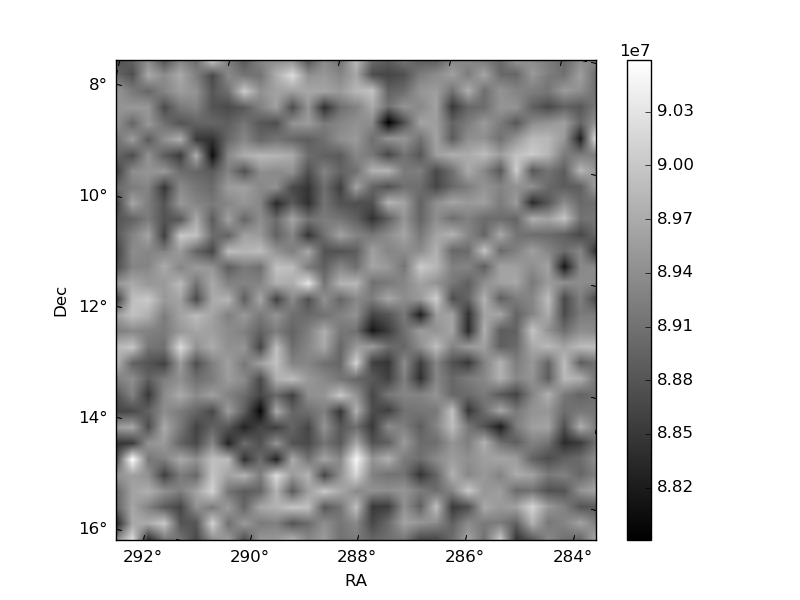
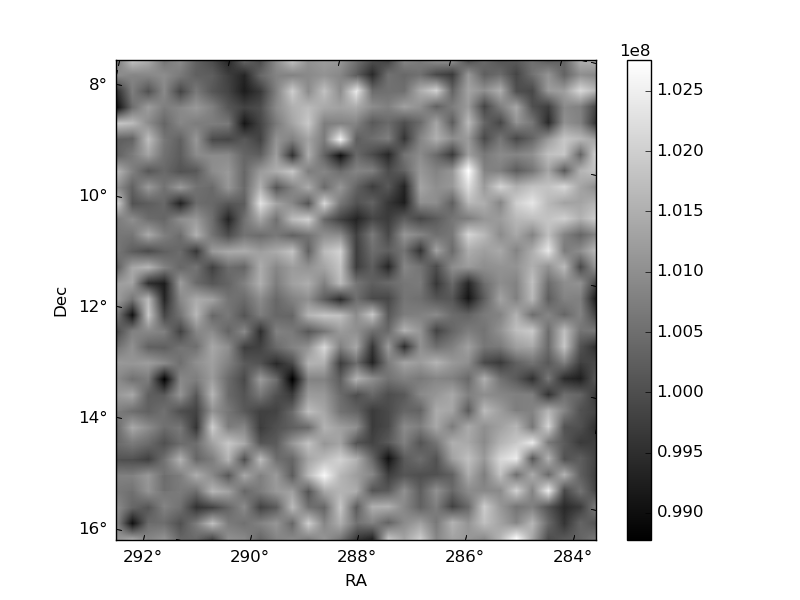
Histogram calculated using DETX and DETY for each event in the final _common_clean file
| Quadrant A | 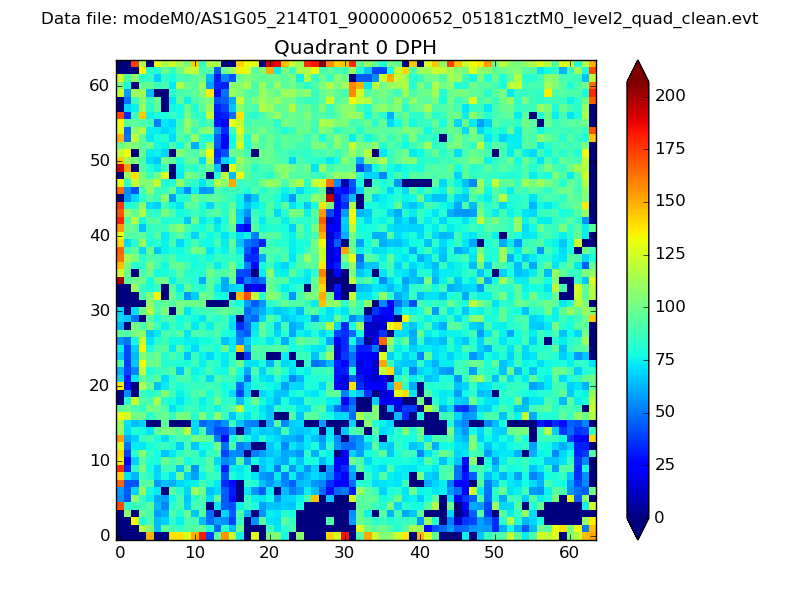 |
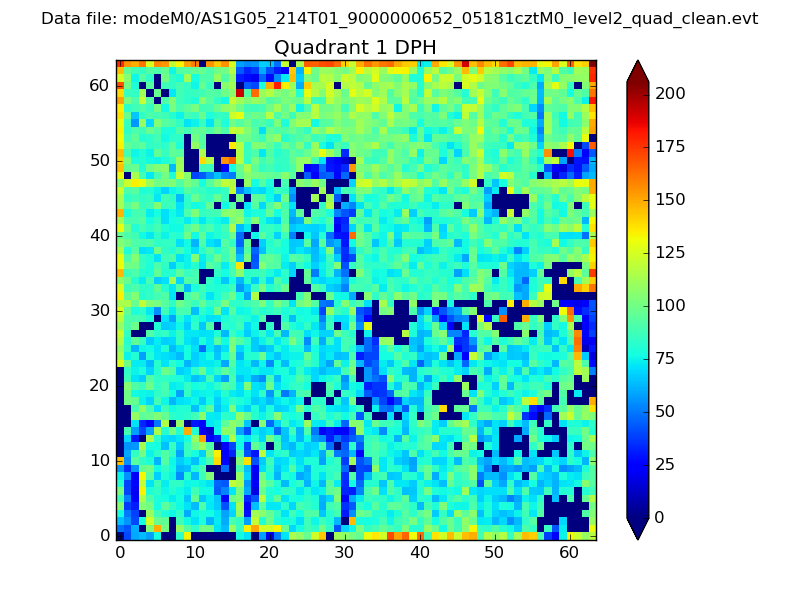 |
Quadrant B |
|---|---|---|---|
| Quadrant D | 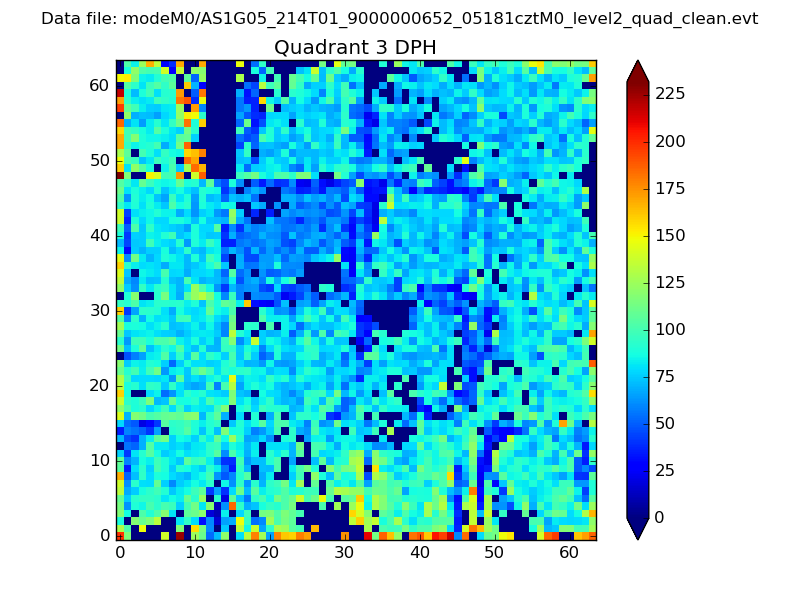 |
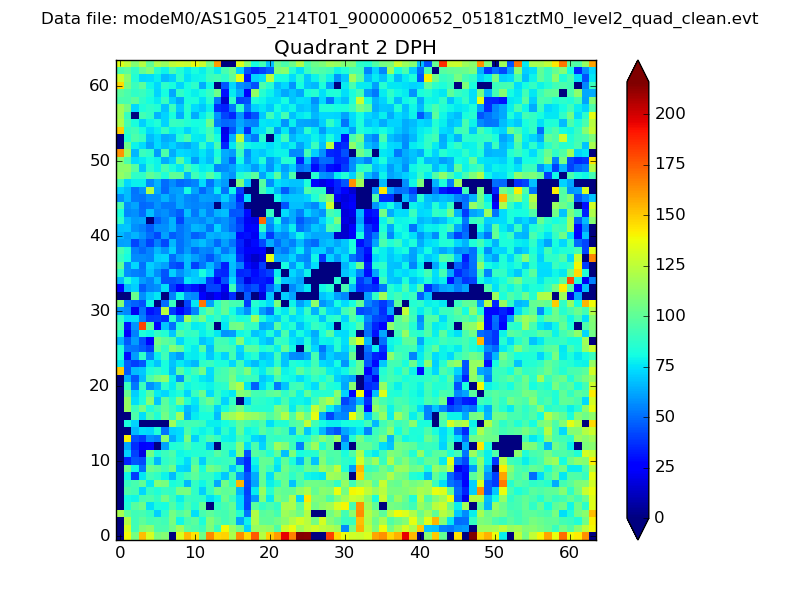 |
Quadrant C |
| Plot type | Count rate plots | Images |
|---|---|---|
| Comparison with Poisson distribution Blue bars denote a histogram of data divided into 1 sec bins. Red curve is a Poisson curve with rate = median count rate of data. |
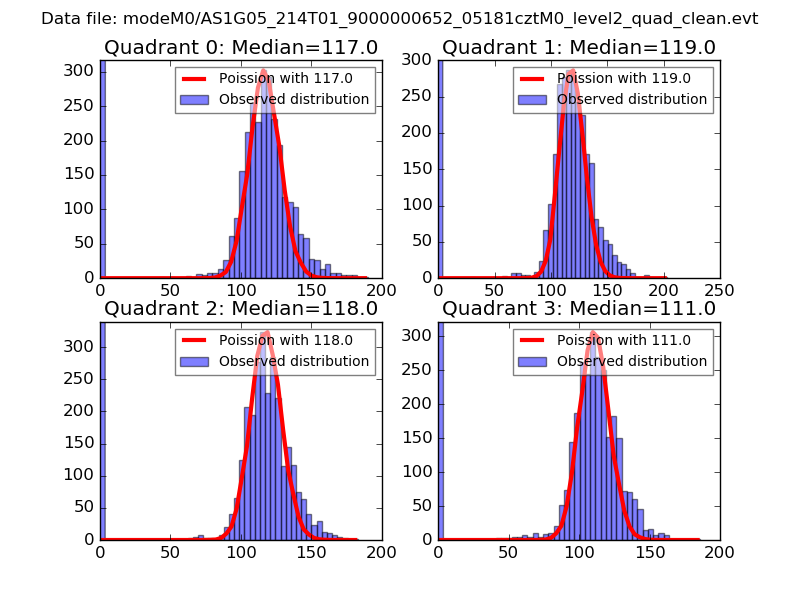 |
 |
| Quadrant-wise count rates Data is divided into 100 sec bins |
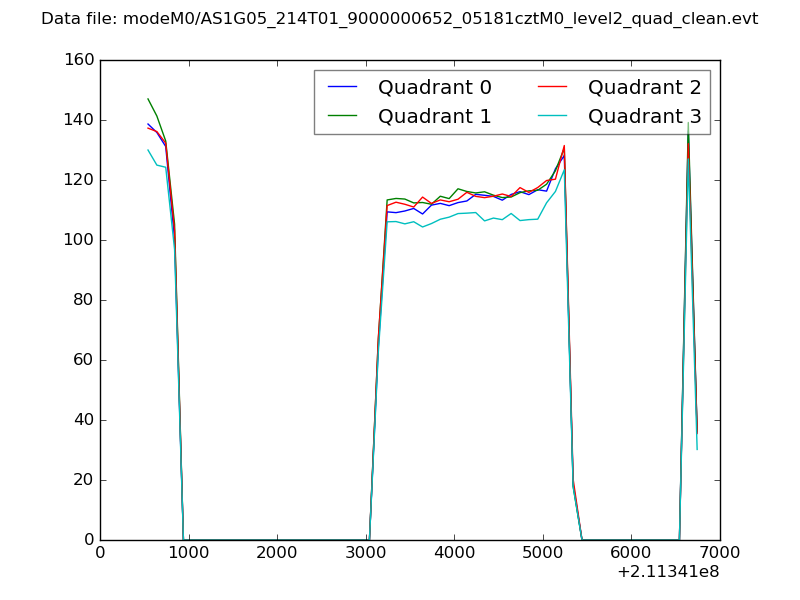 |
|
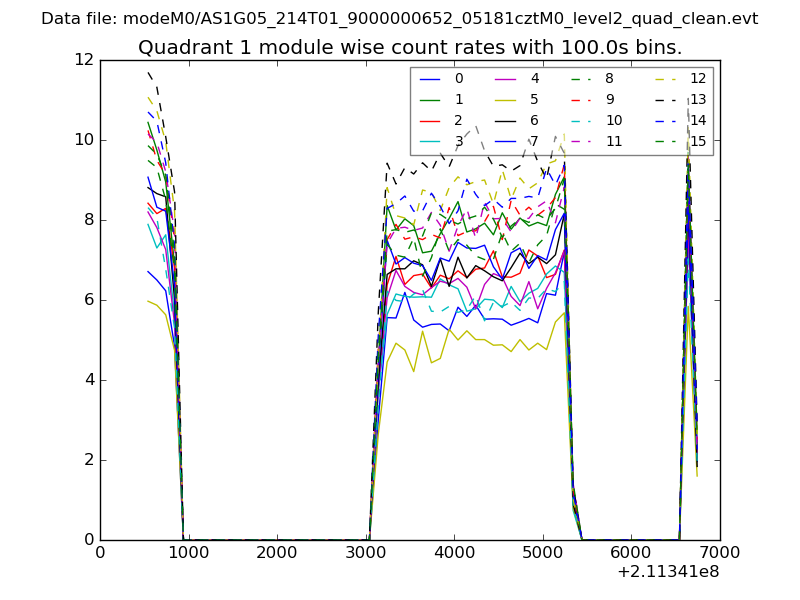
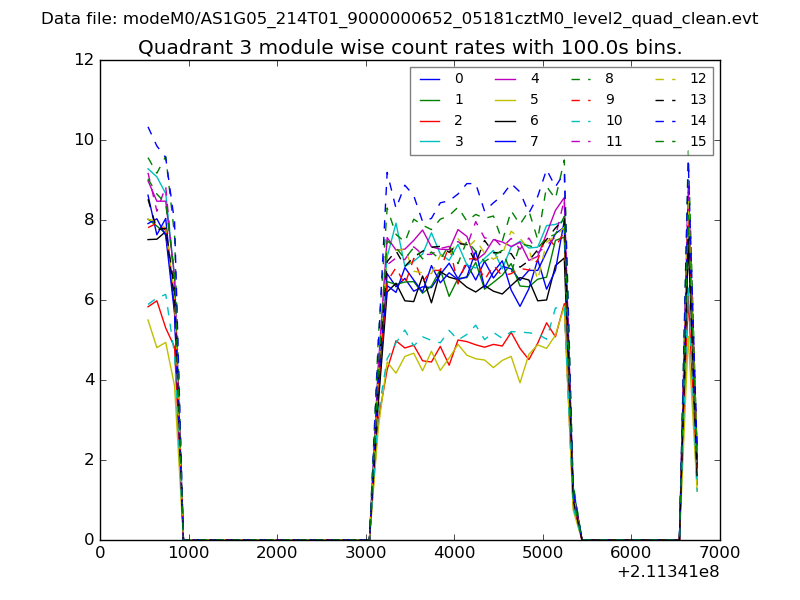
| Module-wise count rates for Quadrant A Data is divided into 100 sec bins |
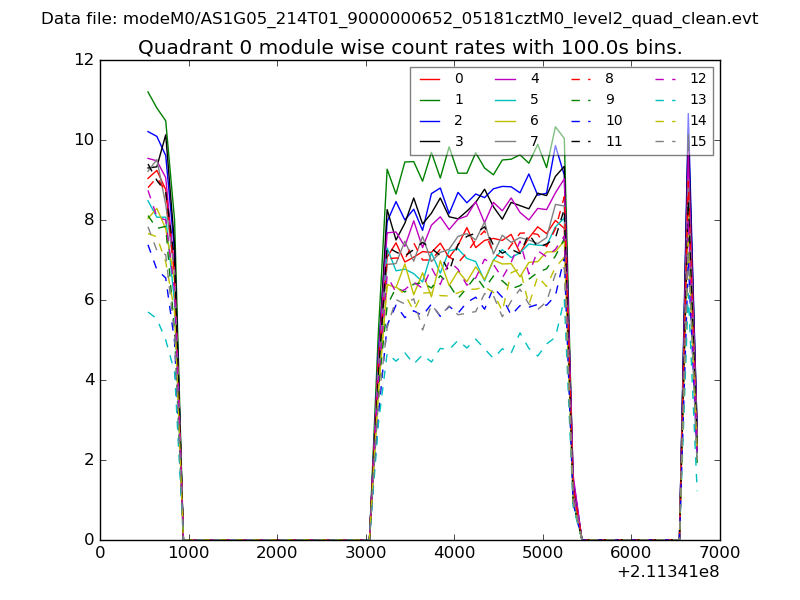 |
 |
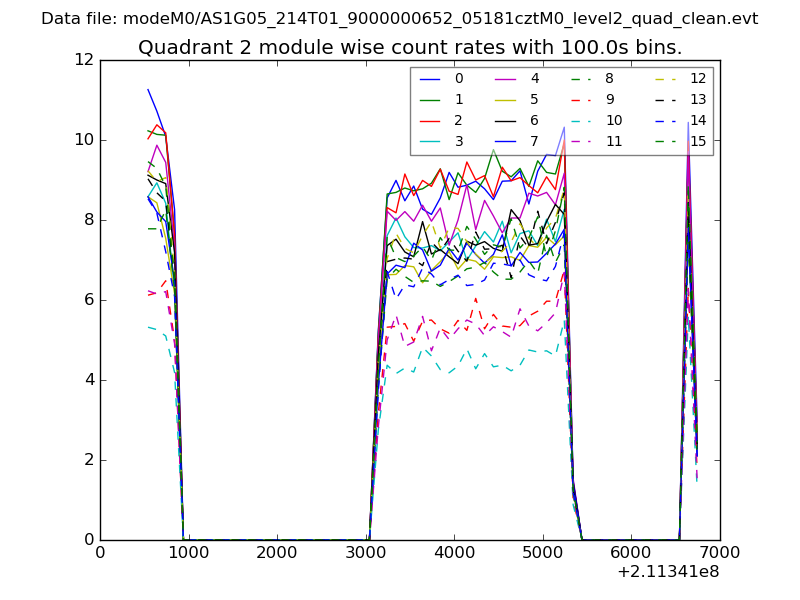
| Module-wise count rates for Quadrant B Data is divided into 100 sec bins |
 |
 |
| Module-wise count rates for Quadrant C Data is divided into 100 sec bins |
 |
 |
| Module-wise count rates for Quadrant D Data is divided into 100 sec bins |
 |
 |
| Parameter | Plot |
|---|---|
| CZT HV Monitor | 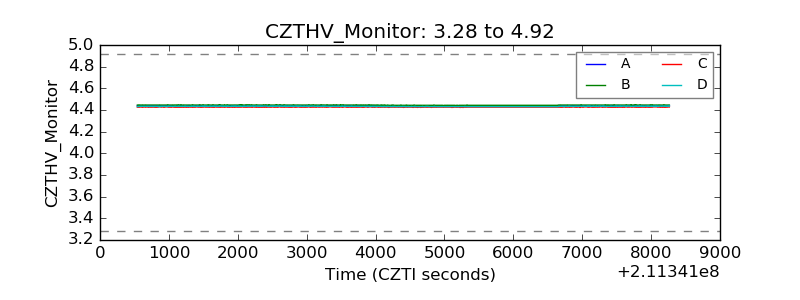 |
| D_VDD | 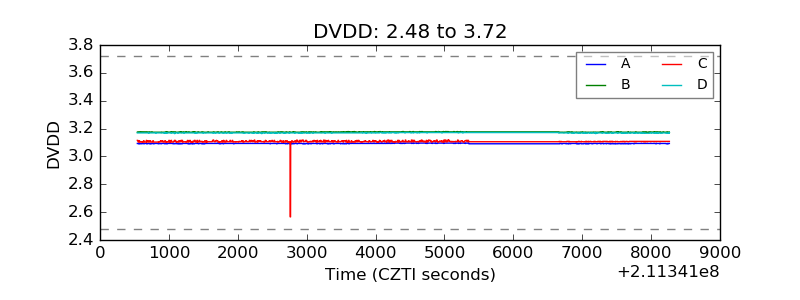 |
| Temperature 1 | 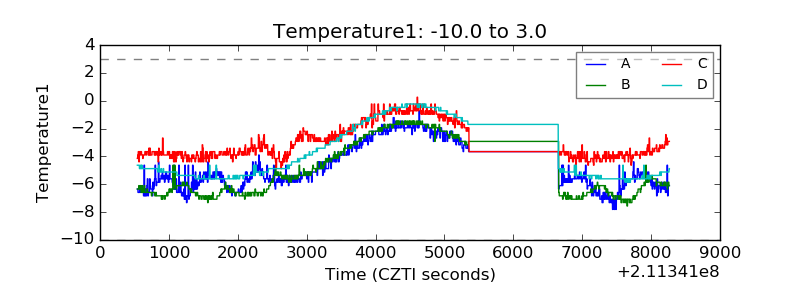 |
| Veto HV Monitor | 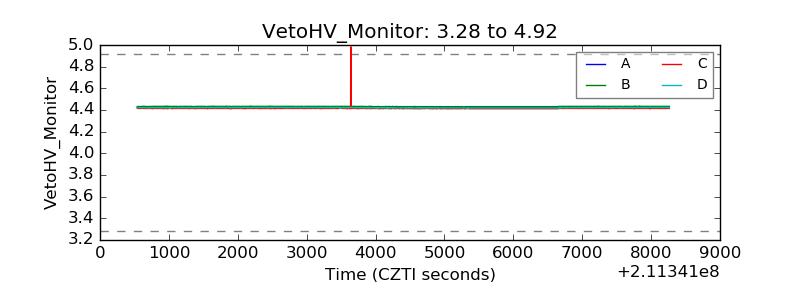 |
| Veto LLD | 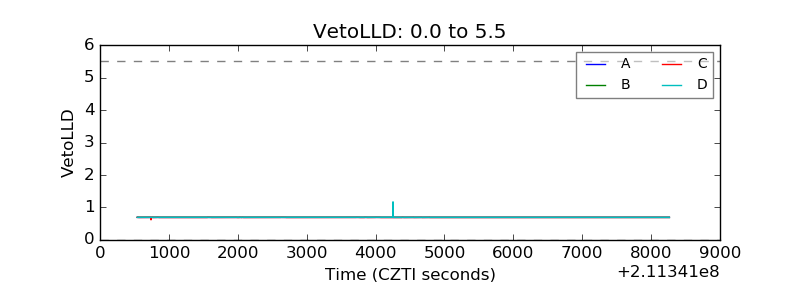 |
| Alpha Counter | 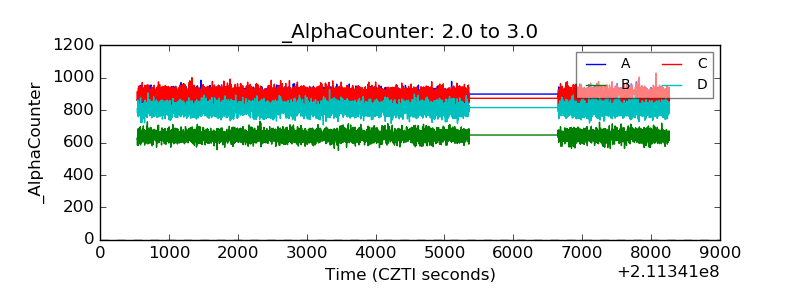 |
| _CPM_Rate | 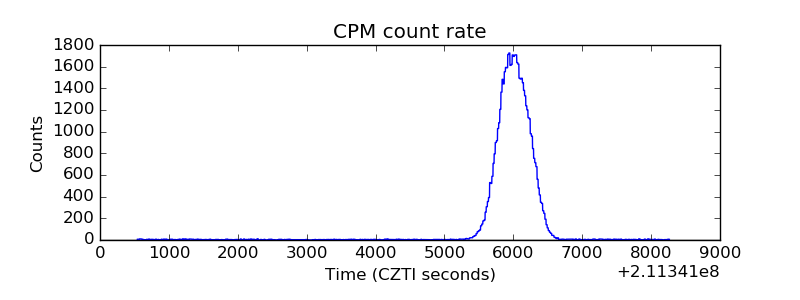 |
| CZT Counter | 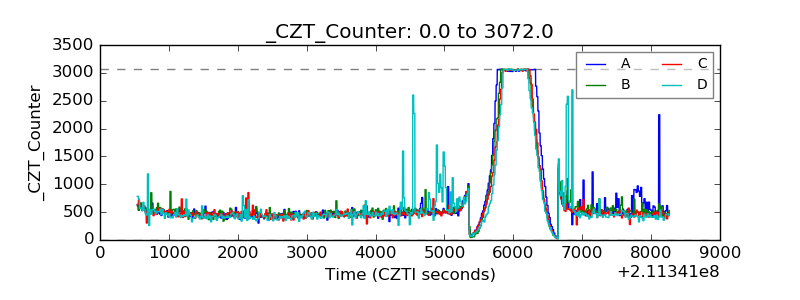 |
| +2.5 Volts monitor |  |
| +5 Volts monitor |  |
| _ROLL_ROT | 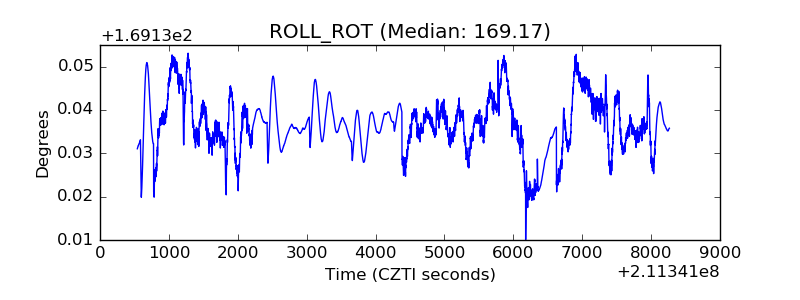 |
| _Roll_DEC | 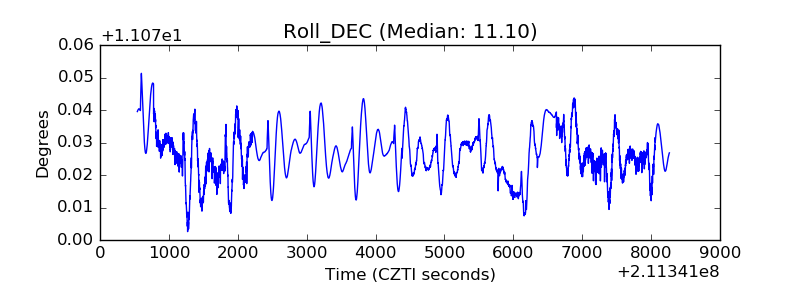 |
| _Roll_RA | 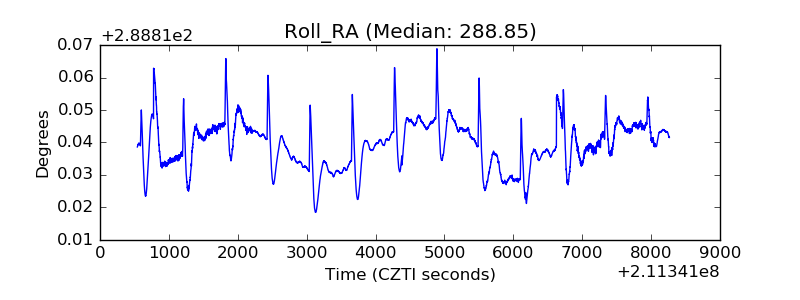 |
| Veto Counter | 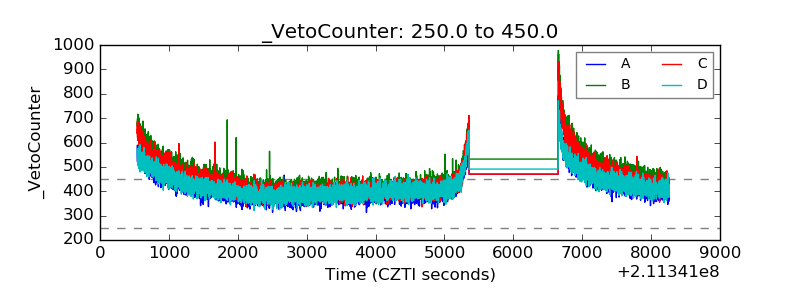 |