| Param | Original file | Final file |
|---|---|---|
| Filename | modeM0/AS1G05_214T01_9000000652_05183cztM0_level2.evt | modeM0/AS1G05_214T01_9000000652_05183cztM0_level2_quad_clean.evt |
| Size (bytes) | 462,398,400 | 60,261,120 |
| Size | 441.0 MB | 57.5 MB |
| Events in quadrant A | 3,207,874 | 347,850 |
| Events in quadrant B | 3,414,227 | 352,776 |
| Events in quadrant C | 3,035,102 | 351,738 |
| Events in quadrant D | 3,909,907 | 323,663 |
| Mode SS | |||
|---|---|---|---|
| Quadrant | BADHDUFLAG | Total packets | Discarded packets |
| A | 0 | 130 | 0 |
| B | 0 | 130 | 0 |
| C | 0 | 130 | 0 |
| D | 0 | 130 | 0 |
| Mode M9 | |||
|---|---|---|---|
| Quadrant | BADHDUFLAG | Total packets | Discarded packets |
| A | 0 | 15 | 0 |
| B | 0 | 15 | 0 |
| C | 0 | 15 | 0 |
| D | 0 | 16 | 0 |
| Mode M0 | |||
|---|---|---|---|
| Quadrant | BADHDUFLAG | Total packets | Discarded packets |
| A | 0 | 13664 | 3 |
| B | 0 | 14029 | 2 |
| C | 0 | 13302 | 2 |
| D | 0 | 16040 | 2 |
| Quadrant | Total seconds | Saturated seconds | Saturation percentage |
|---|---|---|---|
| A | 6426 | 103 | 1.602863% |
| B | 6426 | 128 | 1.991908% |
| C | 6426 | 67 | 1.042639% |
| D | 6426 | 232 | 3.610333% |
Noise dominated data is calculated using 1-second bins in cleaned event files. If a bin has >2000 counts, and if more than 50% of those come from <1% of pixels, then it is considered to be noise-dominated and hence unusable.
| Quadrant | # 1 sec bins | Bins with >0 counts | Bins with >2000 counts | High rate bins dominated by noise | Noise dominated (total time) | Noise dominated (detector-on time) | Marked lightcurve |
|---|---|---|---|---|---|---|---|
| A | 7541 | 6427 | 13 | 13 | 0.17% | 0.20% | 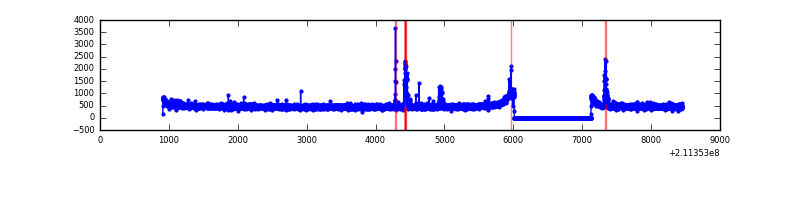 |
| B | 7541 | 6427 | 10 | 10 | 0.13% | 0.16% | 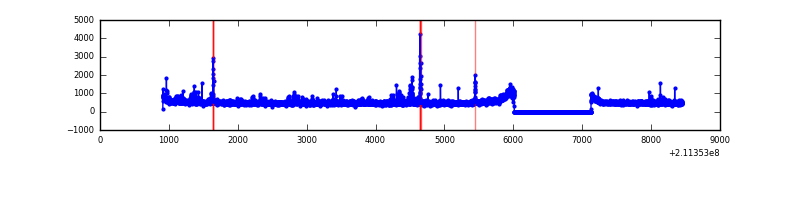 |
| C | 7541 | 6427 | 0 | 0 | 0.00% | 0.00% | 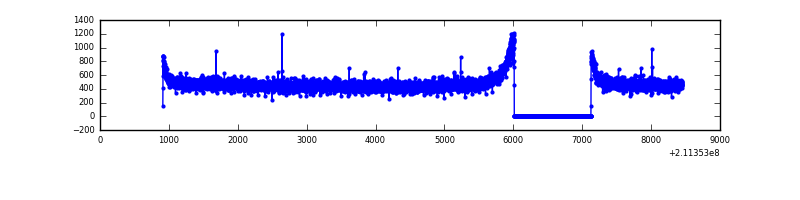 |
| D | 7541 | 6427 | 165 | 165 | 2.19% | 2.57% | 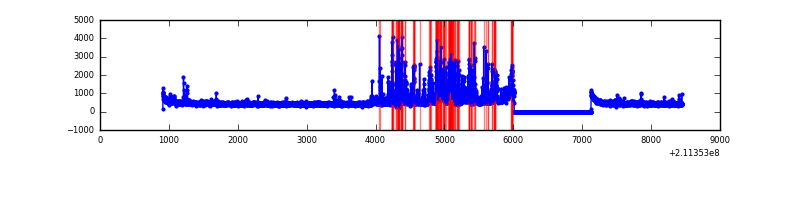 |
Top three noisy pixels from each quadrant. If the there are fewer than three noisy pixels in the level2.evt file, extra rows are filled as -1
| Pixel properties | Quadrant properties | ||||||
|---|---|---|---|---|---|---|---|
| Quadrant | DetID | PixID | Counts | Sigma | Mean | Median | Sigma |
| A | 0 | 50 | 81311 | 488.24 | 800 | 782 | 164.9 |
| A | 13 | 170 | 30842 | 182.25 | 800 | 782 | 164.9 |
| A | 0 | 247 | 19938 | 116.14 | 800 | 782 | 164.9 |
| B | 4 | 80 | 130599 | 838.05 | 809 | 791 | 154.9 |
| B | 15 | 204 | 89447 | 572.37 | 809 | 791 | 154.9 |
| B | 4 | 48 | 22820 | 142.22 | 809 | 791 | 154.9 |
| C | 1 | 16 | 11184 | 57.68 | 774 | 779 | 180.4 |
| C | 13 | 61 | 6394 | 31.12 | 774 | 779 | 180.4 |
| C | 12 | 4 | 4513 | 20.7 | 774 | 779 | 180.4 |
| D | 2 | 33 | 583584 | 3084.78 | 761 | 739 | 188.9 |
| D | 2 | 136 | 219230 | 1156.39 | 761 | 739 | 188.9 |
| D | 7 | 237 | 164878 | 868.72 | 761 | 739 | 188.9 |
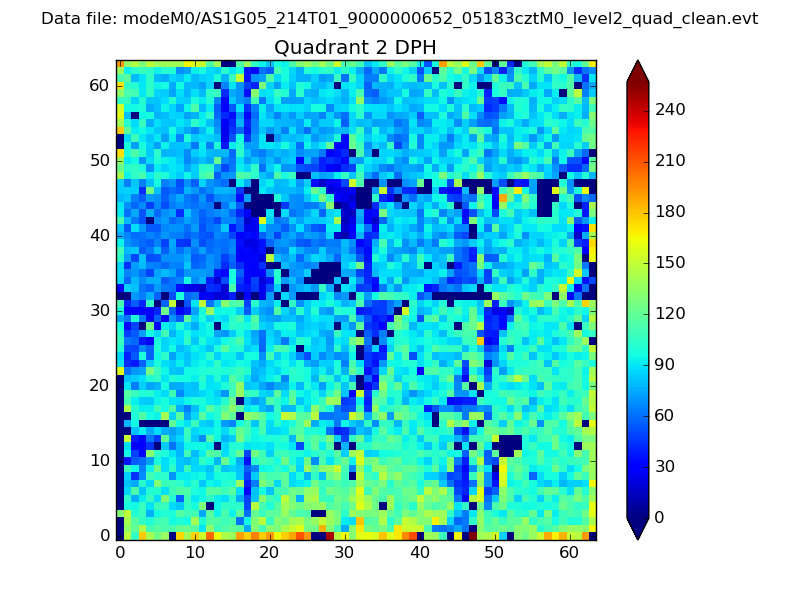
Histogram calculated using DETX and DETY for each event in the final _common_clean file
| Quadrant A | 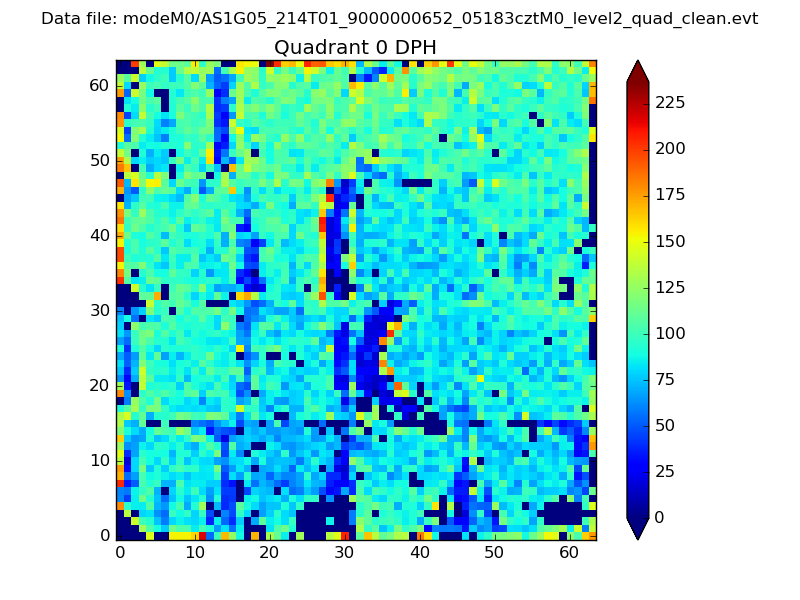 |
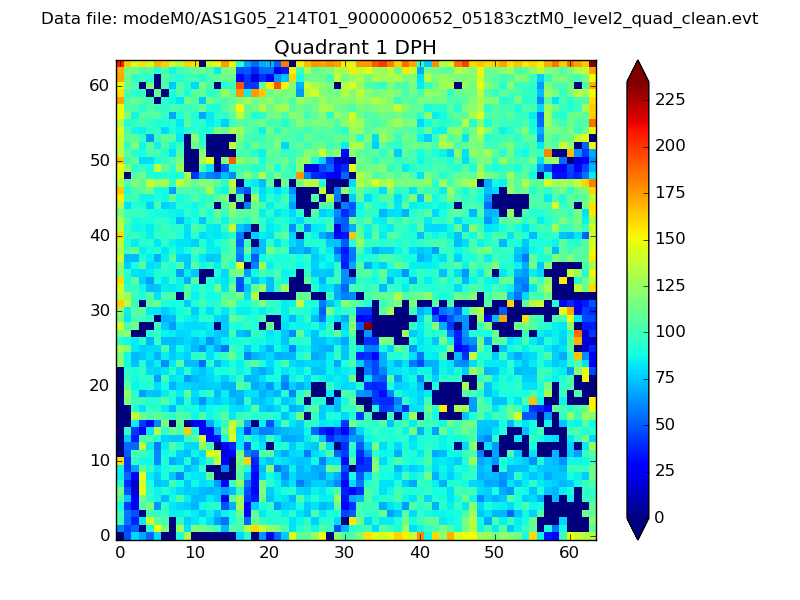 |
Quadrant B |
|---|---|---|---|
| Quadrant D | 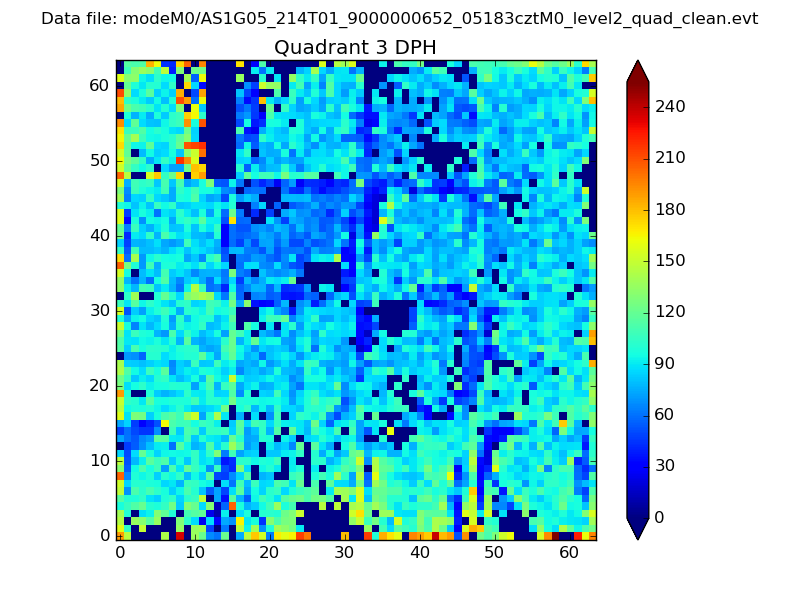 |
 |
Quadrant C |
| Plot type | Count rate plots | Images |
|---|---|---|
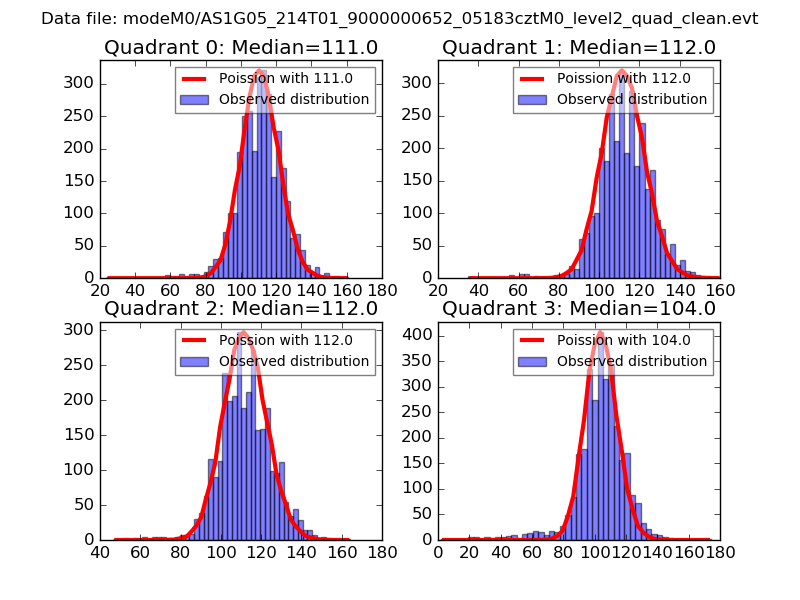
| Comparison with Poisson distribution Blue bars denote a histogram of data divided into 1 sec bins. Red curve is a Poisson curve with rate = median count rate of data. |
 |
 |
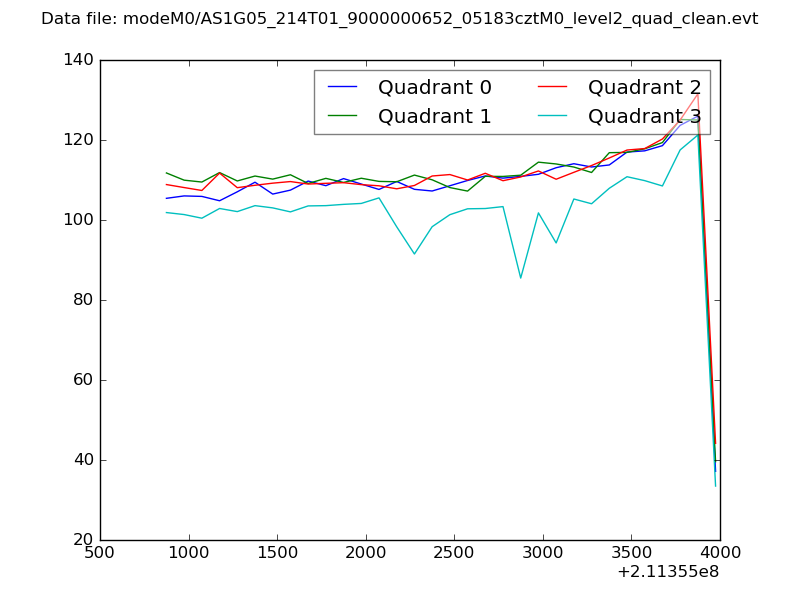
| Quadrant-wise count rates Data is divided into 100 sec bins |
 |
|
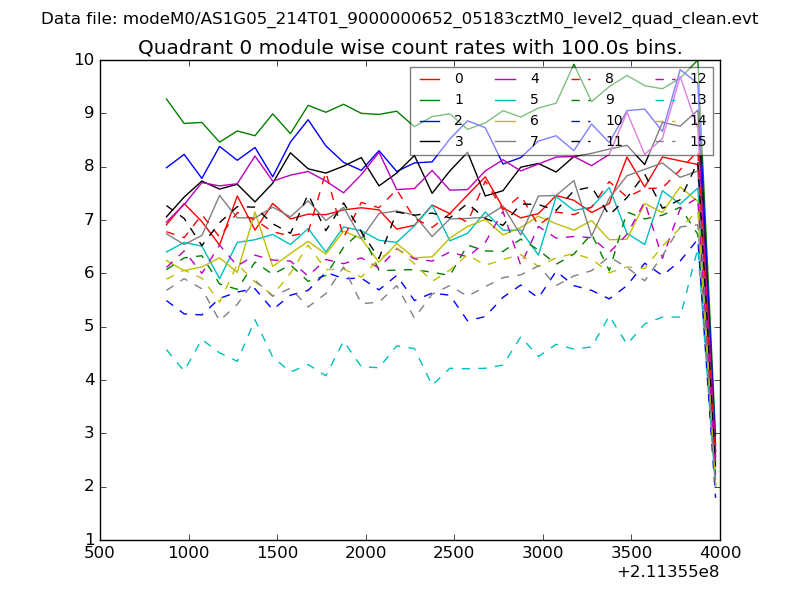
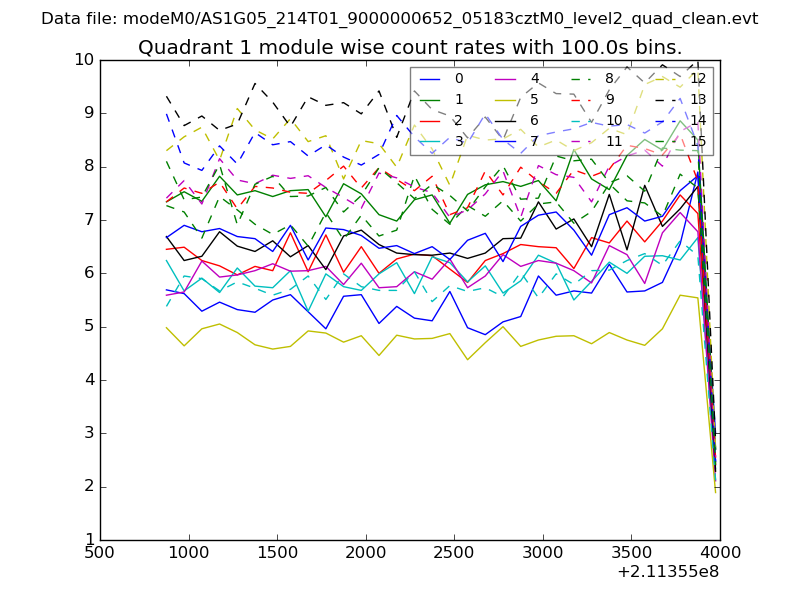
| Module-wise count rates for Quadrant A Data is divided into 100 sec bins |
 |
 |
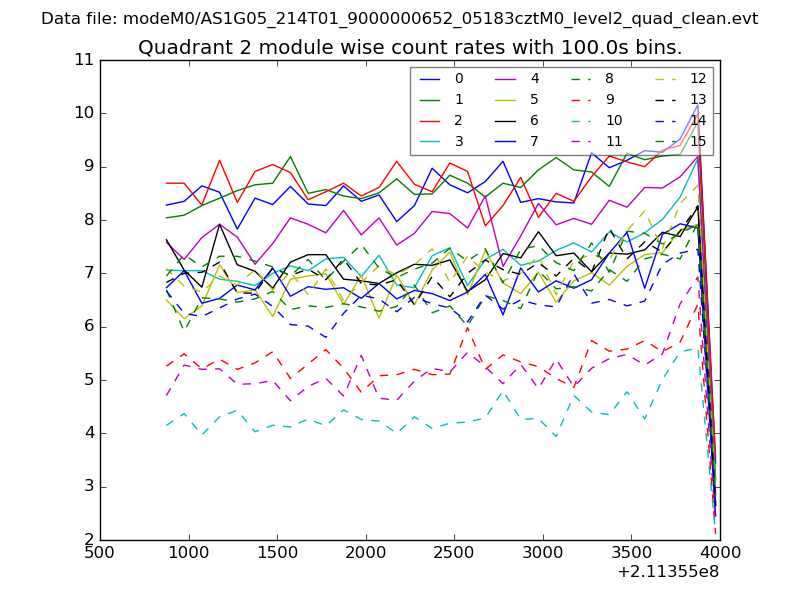
| Module-wise count rates for Quadrant B Data is divided into 100 sec bins |
 |
 |
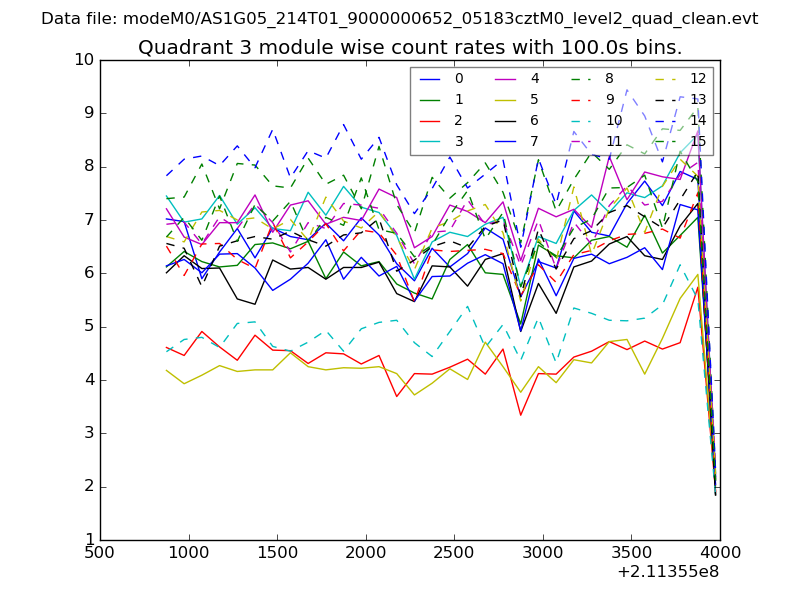
| Module-wise count rates for Quadrant C Data is divided into 100 sec bins |
 |
 |
| Module-wise count rates for Quadrant D Data is divided into 100 sec bins |
 |
 |
| Parameter | Plot |
|---|---|
| CZT HV Monitor | 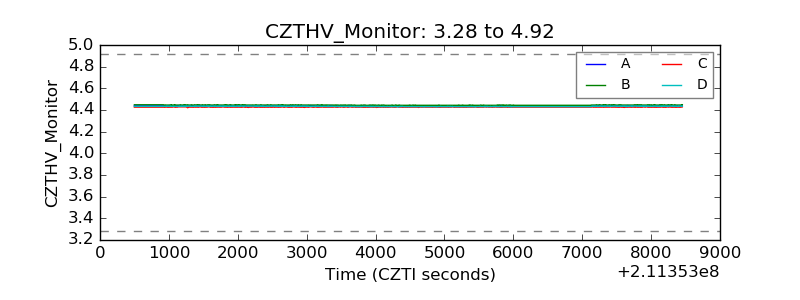 |
| D_VDD | 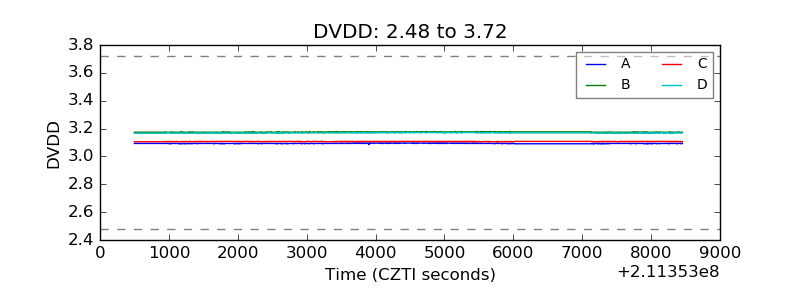 |
| Temperature 1 | 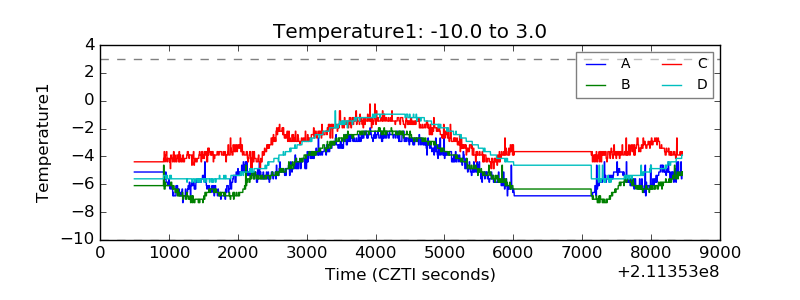 |
| Veto HV Monitor | 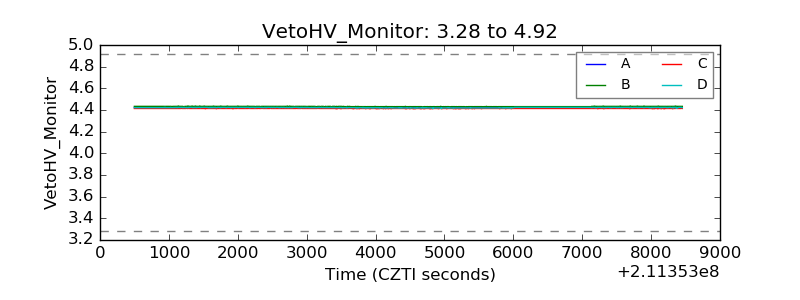 |
| Veto LLD | 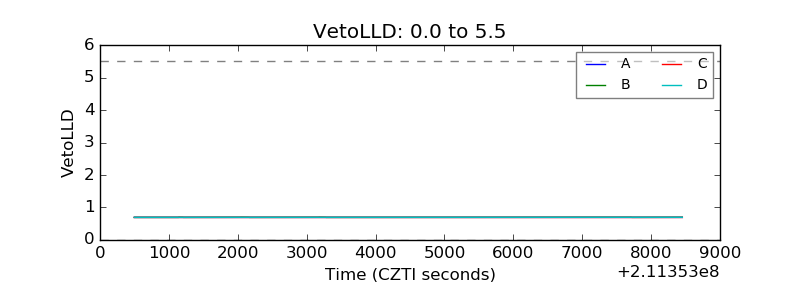 |
| Alpha Counter | 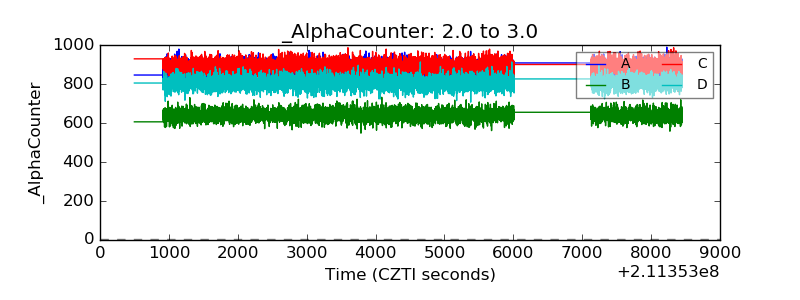 |
| _CPM_Rate | 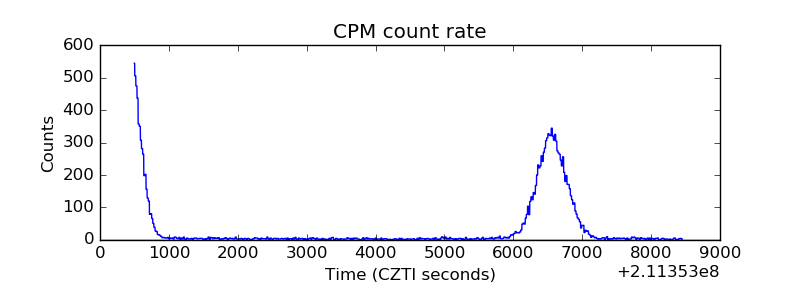 |
| CZT Counter | 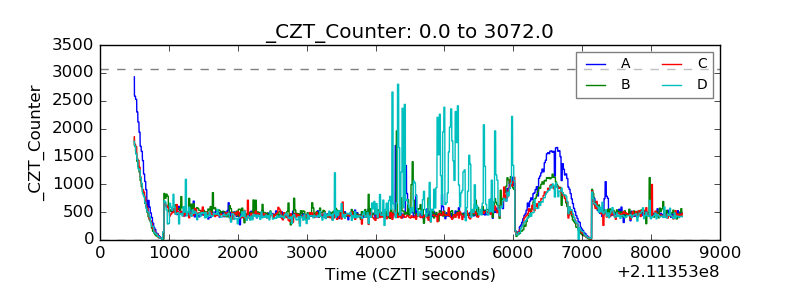 |
| +2.5 Volts monitor |  |
| +5 Volts monitor |  |
| _ROLL_ROT | 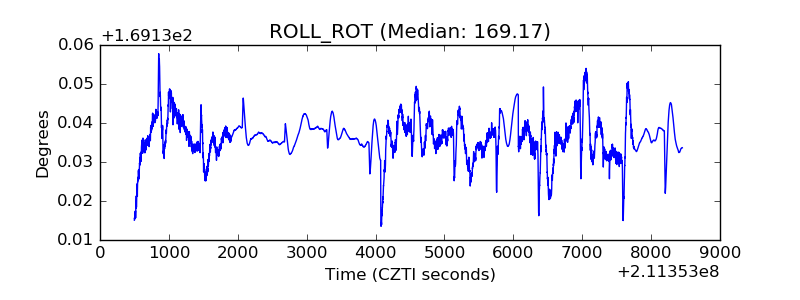 |
| _Roll_DEC | 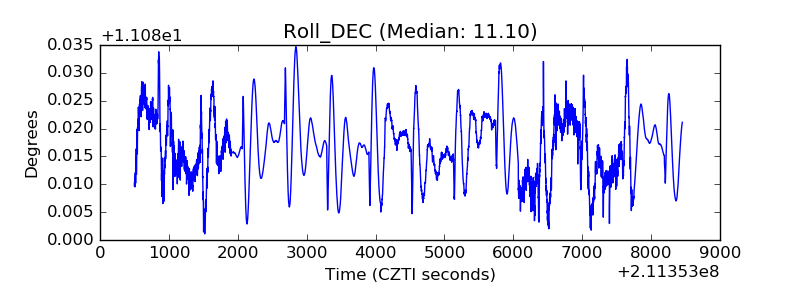 |
| _Roll_RA | 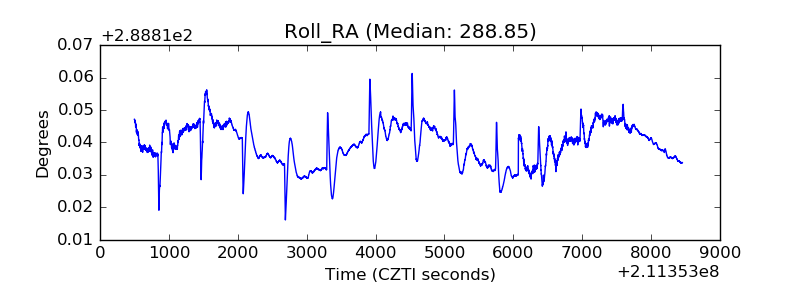 |
| Veto Counter | 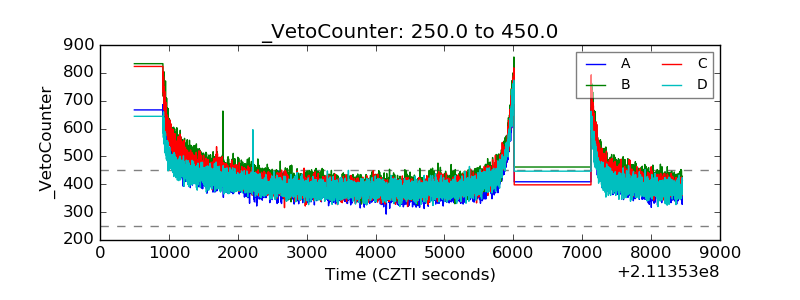 |