| Param | Original file | Final file |
|---|---|---|
| Filename | modeM0/AS1G05_214T01_9000000652_05184cztM0_level2.evt | modeM0/AS1G05_214T01_9000000652_05184cztM0_level2_quad_clean.evt |
| Size (bytes) | 532,480,320 | 77,175,360 |
| Size | 507.8 MB | 73.6 MB |
| Events in quadrant A | 3,696,770 | 459,616 |
| Events in quadrant B | 3,922,431 | 465,958 |
| Events in quadrant C | 3,519,957 | 468,321 |
| Events in quadrant D | 4,486,271 | 429,628 |
| Mode SS | |||
|---|---|---|---|
| Quadrant | BADHDUFLAG | Total packets | Discarded packets |
| A | 0 | 152 | 0 |
| B | 0 | 152 | 0 |
| C | 0 | 152 | 0 |
| D | 0 | 152 | 0 |
| Mode M9 | |||
|---|---|---|---|
| Quadrant | BADHDUFLAG | Total packets | Discarded packets |
| A | 0 | 19 | 0 |
| B | 0 | 19 | 0 |
| C | 0 | 19 | 0 |
| D | 0 | 19 | 0 |
| Mode M0 | |||
|---|---|---|---|
| Quadrant | BADHDUFLAG | Total packets | Discarded packets |
| A | 0 | 15838 | 3 |
| B | 0 | 16256 | 2 |
| C | 0 | 15517 | 2 |
| D | 0 | 18390 | 2 |
| Quadrant | Total seconds | Saturated seconds | Saturation percentage |
|---|---|---|---|
| A | 7371 | 254 | 3.445937% |
| B | 7371 | 298 | 4.042871% |
| C | 7371 | 188 | 2.550536% |
| D | 7371 | 390 | 5.291005% |
Noise dominated data is calculated using 1-second bins in cleaned event files. If a bin has >2000 counts, and if more than 50% of those come from <1% of pixels, then it is considered to be noise-dominated and hence unusable.
| Quadrant | # 1 sec bins | Bins with >0 counts | Bins with >2000 counts | High rate bins dominated by noise | Noise dominated (total time) | Noise dominated (detector-on time) | Marked lightcurve |
|---|---|---|---|---|---|---|---|
| A | 9256 | 7372 | 11 | 11 | 0.12% | 0.15% | 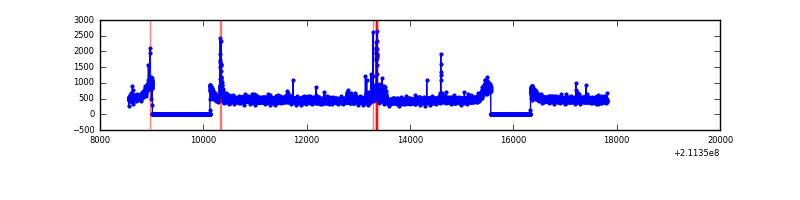 |
| B | 9256 | 7372 | 22 | 22 | 0.24% | 0.30% | 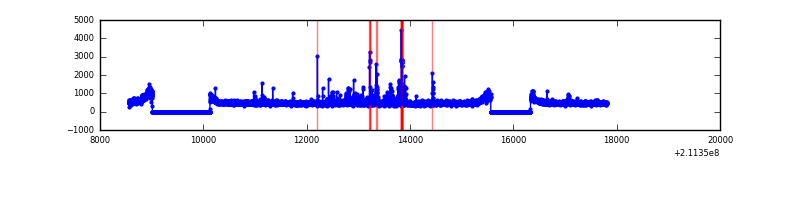 |
| C | 9256 | 7373 | 0 | 0 | 0.00% | 0.00% | 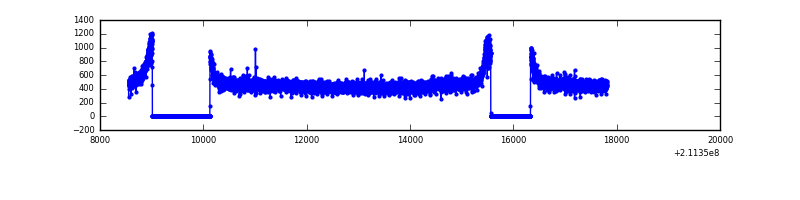 |
| D | 9256 | 7372 | 203 | 203 | 2.19% | 2.75% | 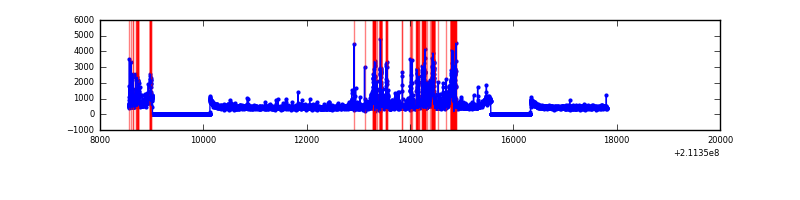 |
Top three noisy pixels from each quadrant. If the there are fewer than three noisy pixels in the level2.evt file, extra rows are filled as -1
| Pixel properties | Quadrant properties | ||||||
|---|---|---|---|---|---|---|---|
| Quadrant | DetID | PixID | Counts | Sigma | Mean | Median | Sigma |
| A | 0 | 247 | 93215 | 487.09 | 920 | 899 | 189.5 |
| A | 13 | 170 | 37467 | 192.95 | 920 | 899 | 189.5 |
| A | 0 | 226 | 17588 | 88.06 | 920 | 899 | 189.5 |
| B | 4 | 80 | 113563 | 622.29 | 930 | 908 | 181.0 |
| B | 5 | 70 | 105419 | 577.31 | 930 | 908 | 181.0 |
| B | 15 | 204 | 55855 | 303.52 | 930 | 908 | 181.0 |
| C | 1 | 16 | 23007 | 105.63 | 896 | 902 | 209.3 |
| C | 13 | 61 | 7380 | 30.95 | 896 | 902 | 209.3 |
| C | 12 | 4 | 2781 | 8.98 | 896 | 902 | 209.3 |
| D | 2 | 33 | 746204 | 3408.95 | 883 | 856 | 218.6 |
| D | 2 | 136 | 108660 | 493.06 | 883 | 856 | 218.6 |
| D | 13 | 105 | 101657 | 461.03 | 883 | 856 | 218.6 |
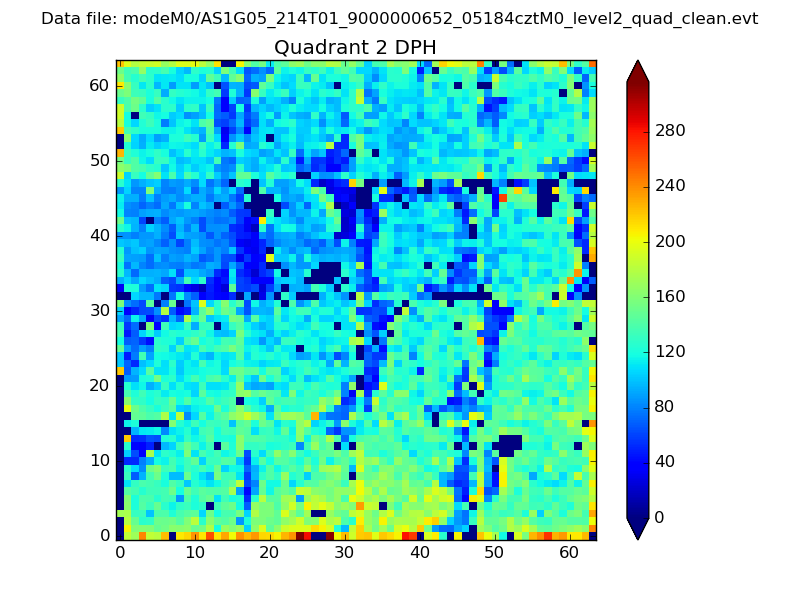
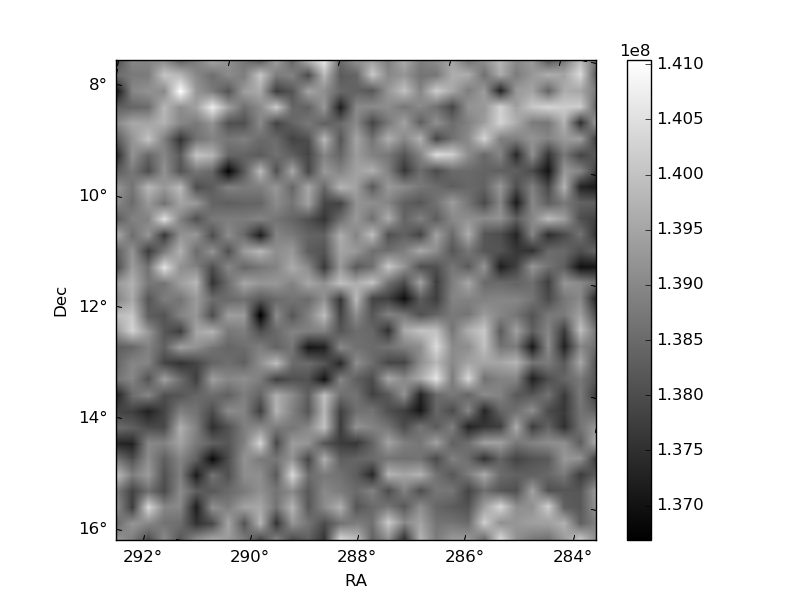
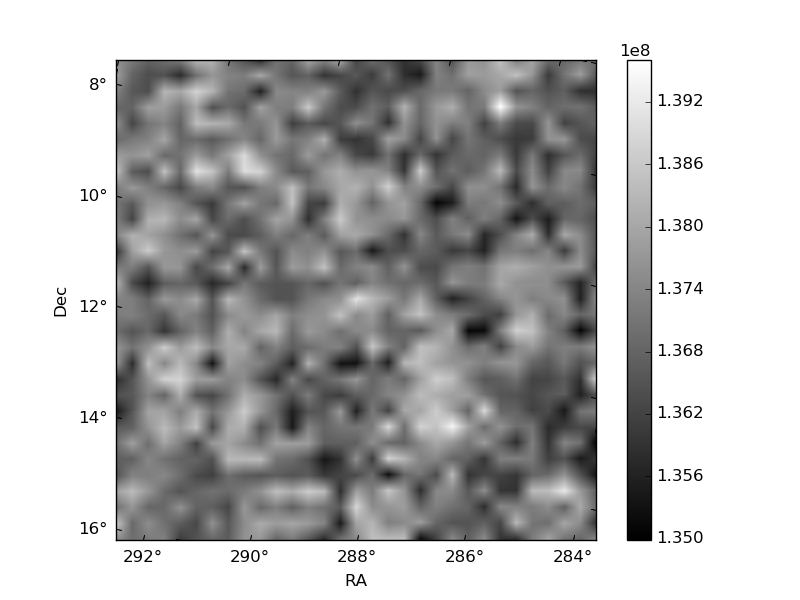
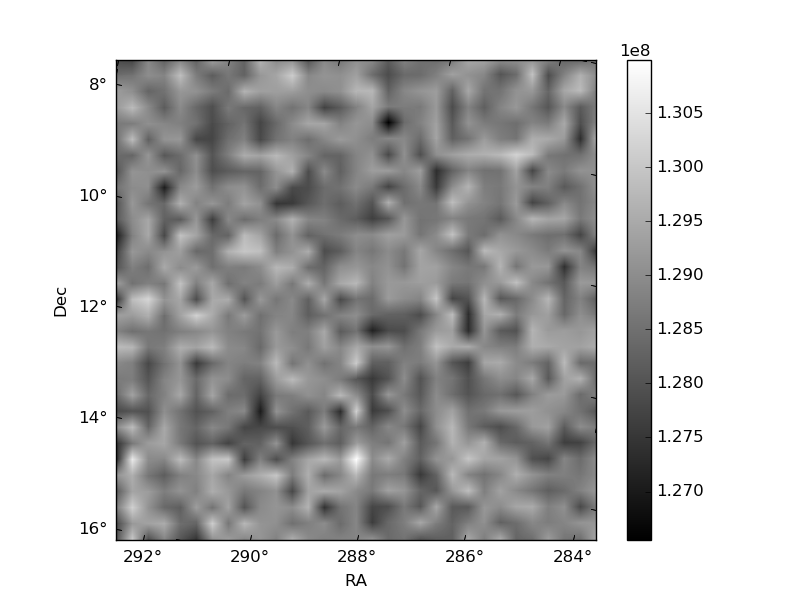
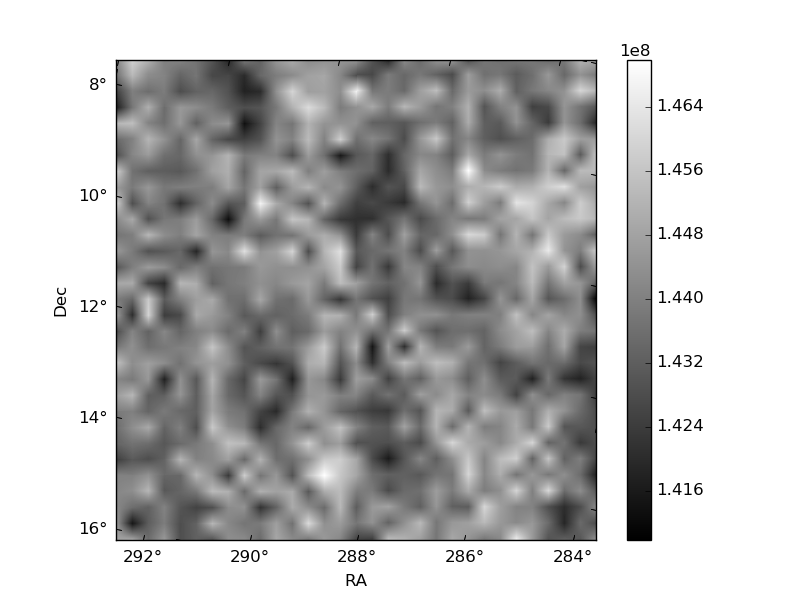
Histogram calculated using DETX and DETY for each event in the final _common_clean file
| Quadrant A | 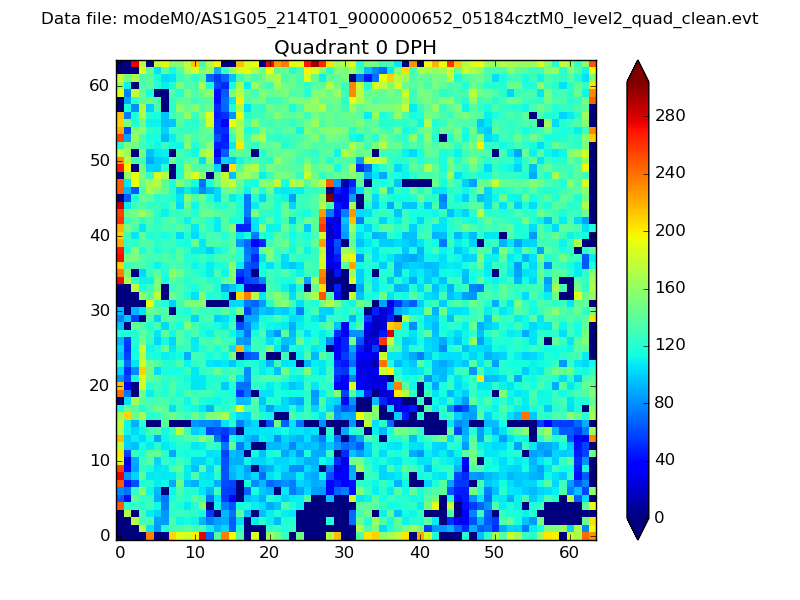 |
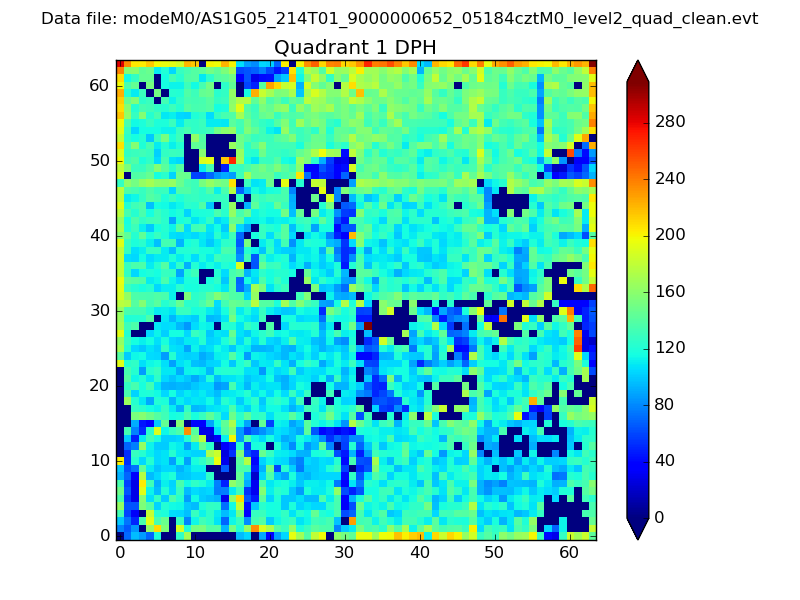 |
Quadrant B |
|---|---|---|---|
| Quadrant D | 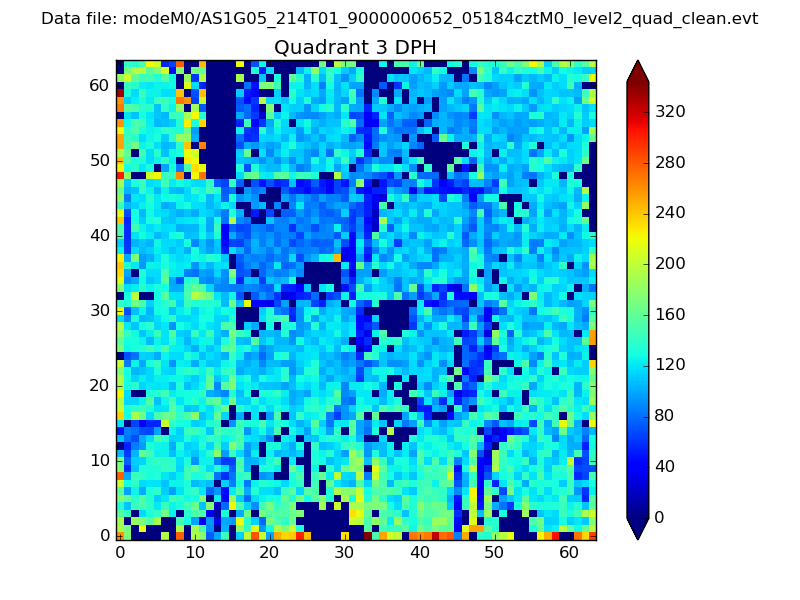 |
 |
Quadrant C |
| Plot type | Count rate plots | Images |
|---|---|---|
| Comparison with Poisson distribution Blue bars denote a histogram of data divided into 1 sec bins. Red curve is a Poisson curve with rate = median count rate of data. |
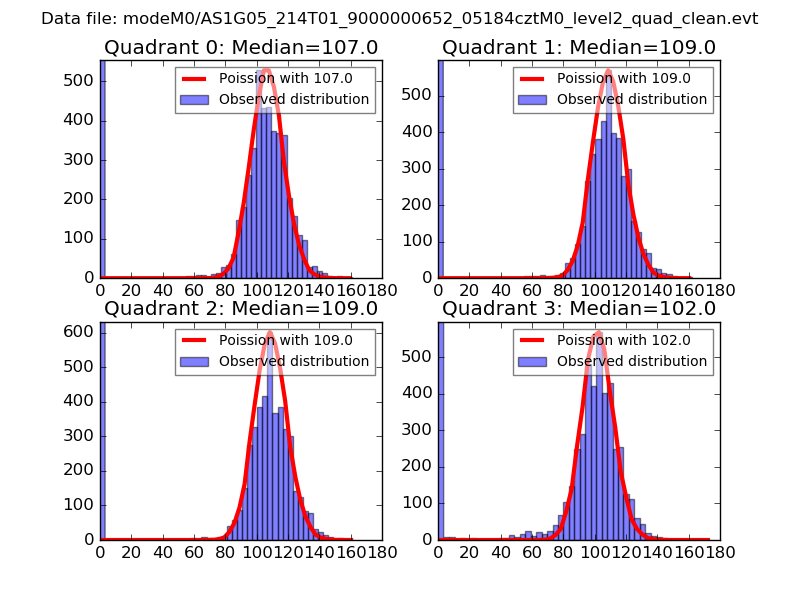 |
 |
| Quadrant-wise count rates Data is divided into 100 sec bins |
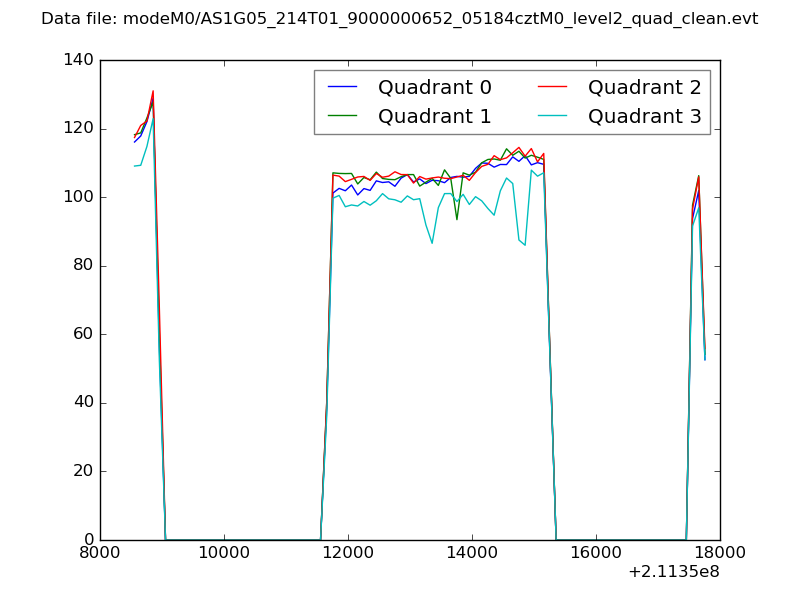 |
|
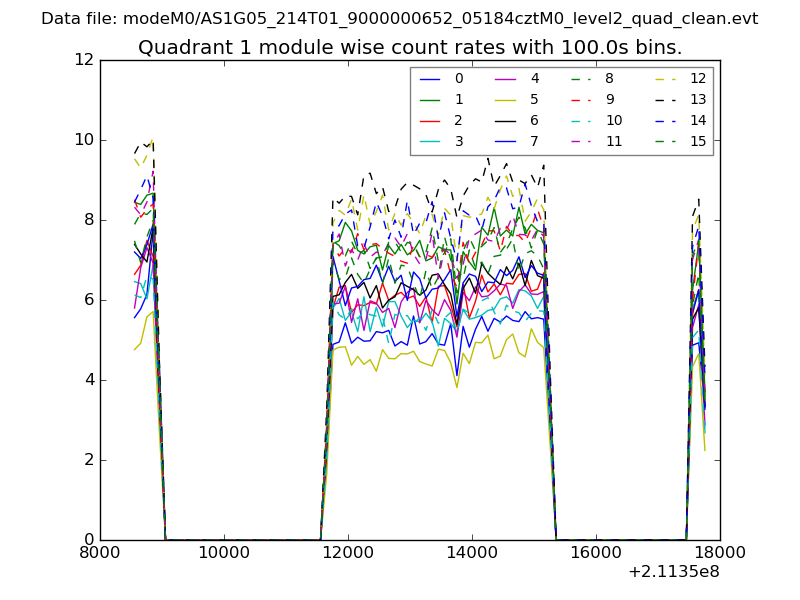
| Module-wise count rates for Quadrant A Data is divided into 100 sec bins |
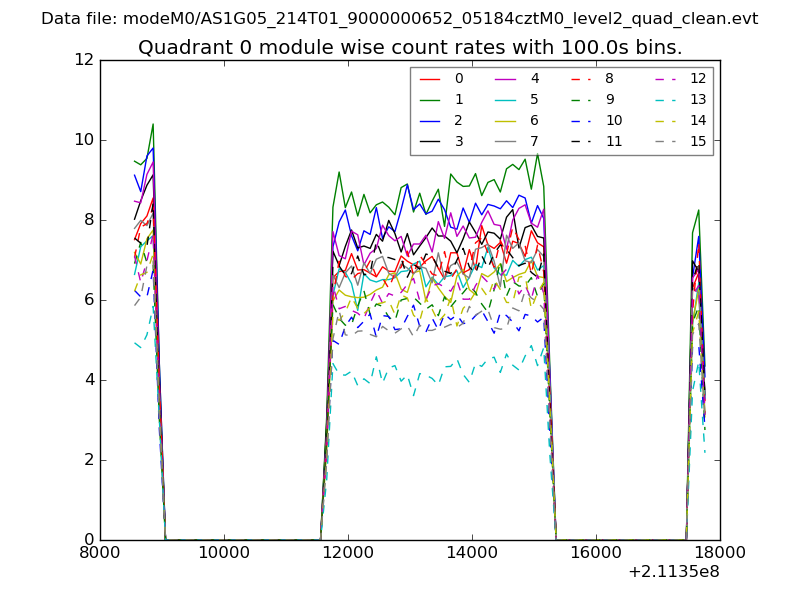 |
 |
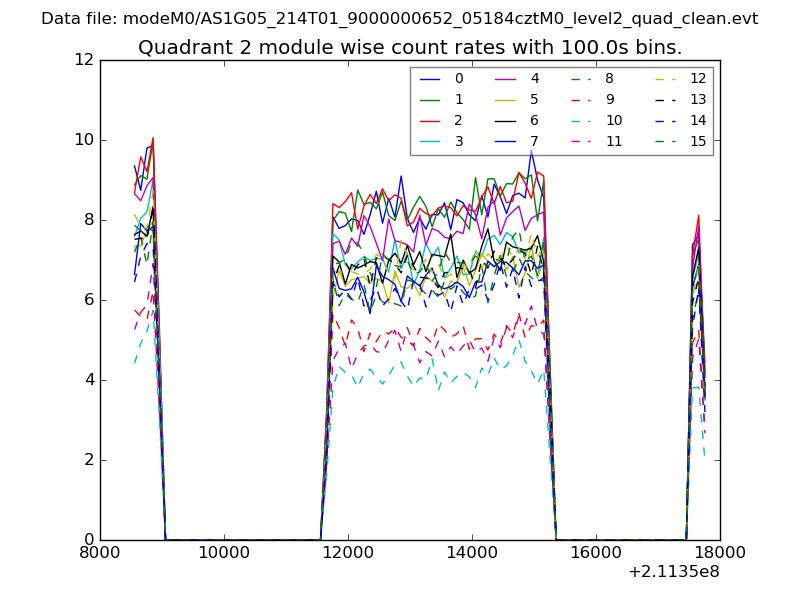
| Module-wise count rates for Quadrant B Data is divided into 100 sec bins |
 |
 |
| Module-wise count rates for Quadrant C Data is divided into 100 sec bins |
 |
 |
| Module-wise count rates for Quadrant D Data is divided into 100 sec bins |
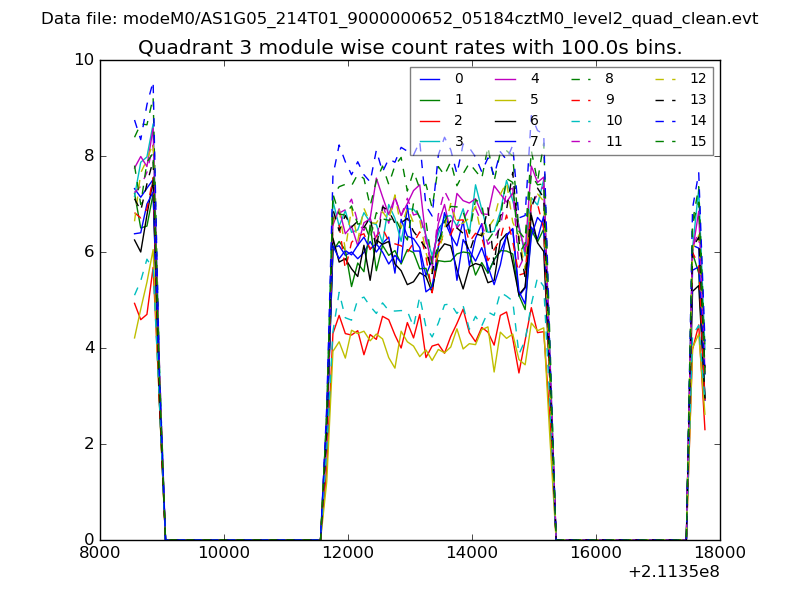 |
 |
| Parameter | Plot |
|---|---|
| CZT HV Monitor | 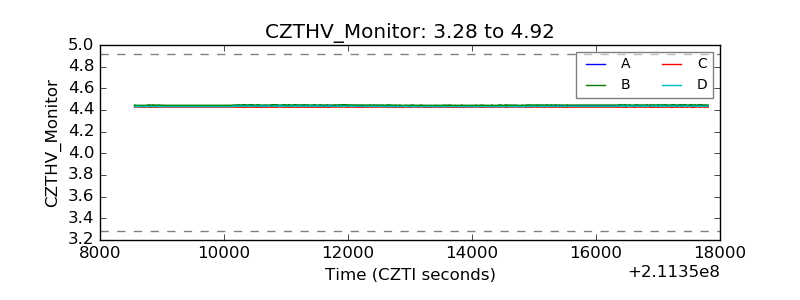 |
| D_VDD | 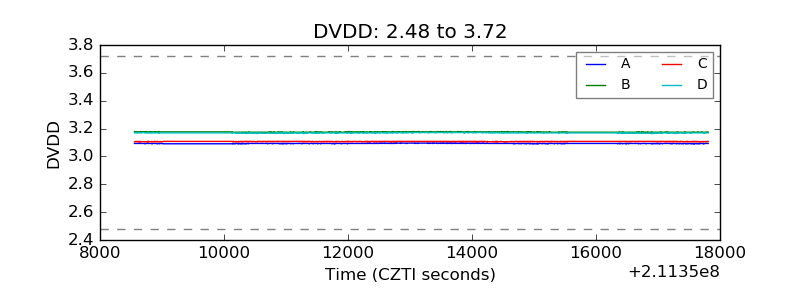 |
| Temperature 1 | 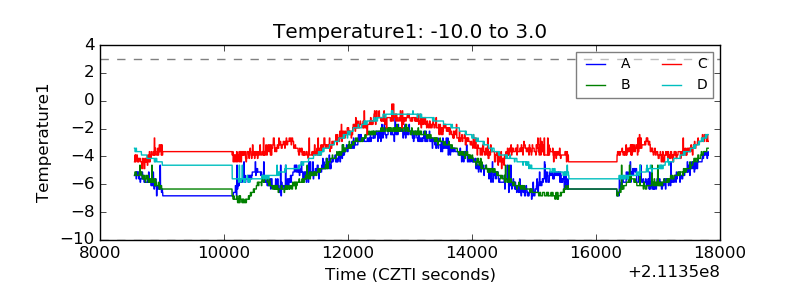 |
| Veto HV Monitor | 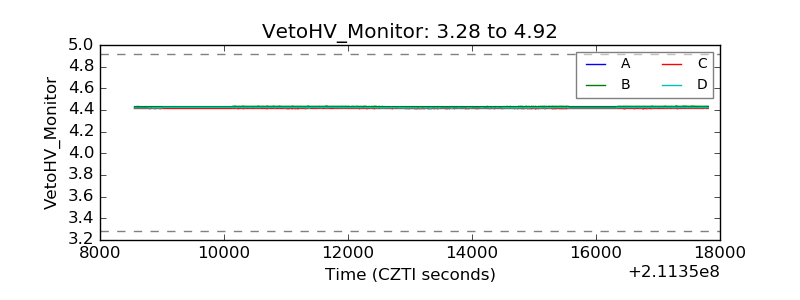 |
| Veto LLD | 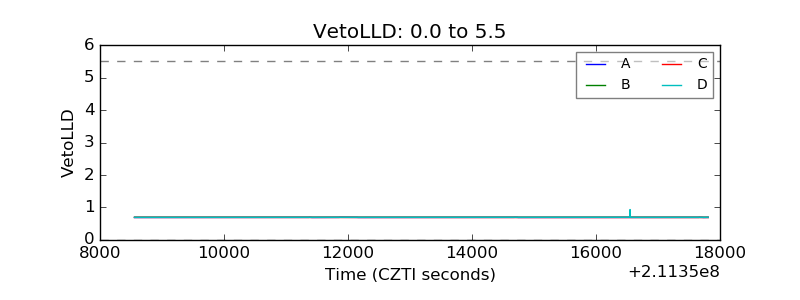 |
| Alpha Counter | 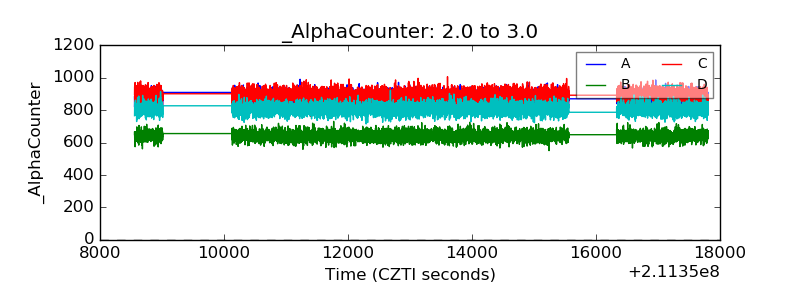 |
| _CPM_Rate | 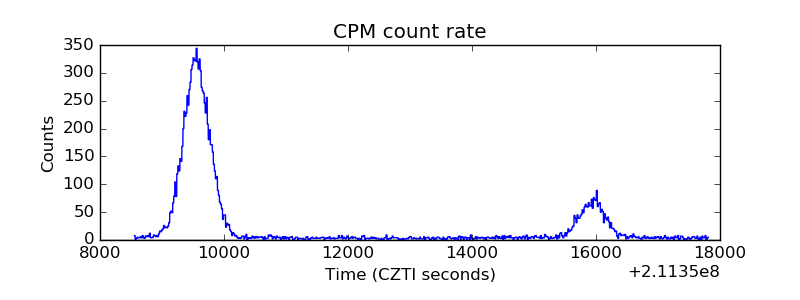 |
| CZT Counter | 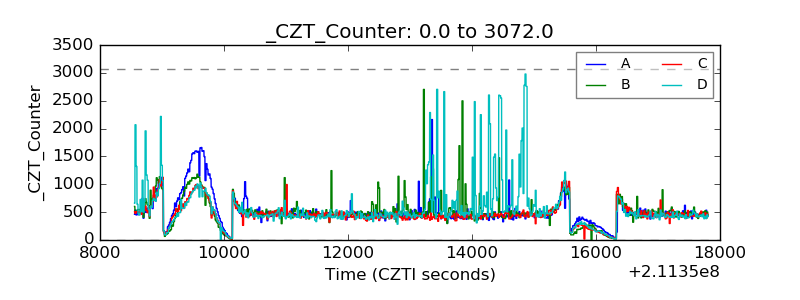 |
| +2.5 Volts monitor | 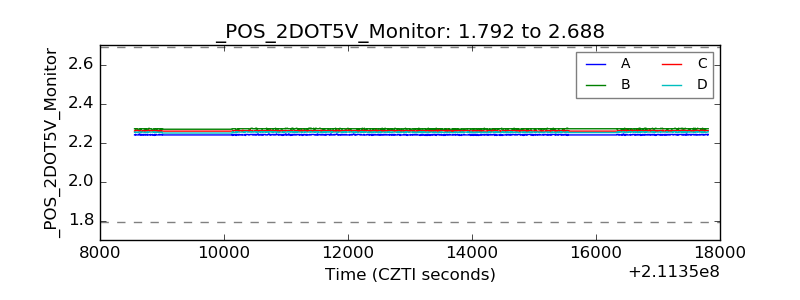 |
| +5 Volts monitor | 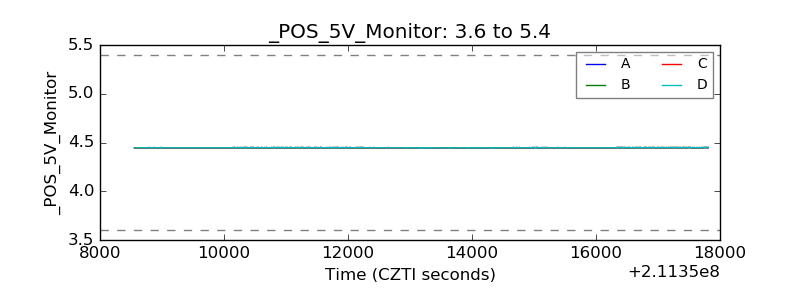 |
| _ROLL_ROT | 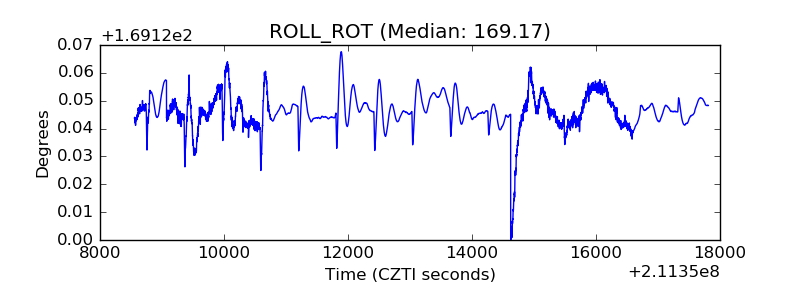 |
| _Roll_DEC | 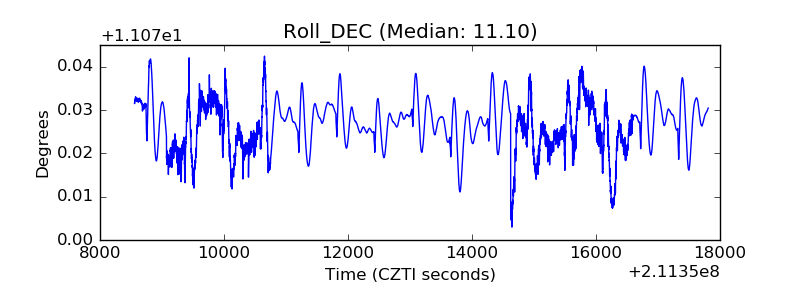 |
| _Roll_RA | 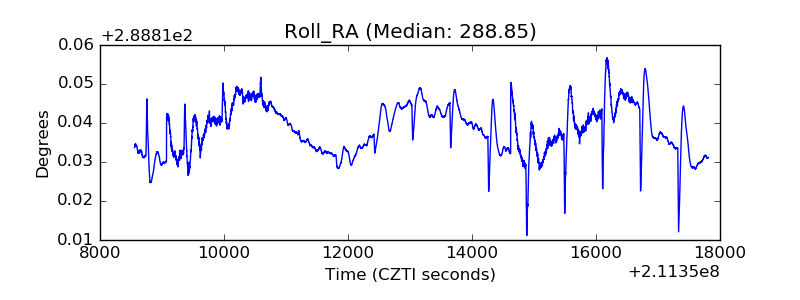 |
| Veto Counter | 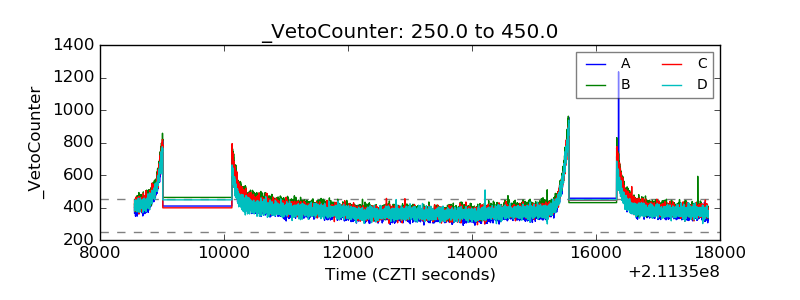 |