| Param | Original file | Final file |
|---|---|---|
| Filename | modeM0/AS1G05_214T01_9000000652_05185cztM0_level2.evt | modeM0/AS1G05_214T01_9000000652_05185cztM0_level2_quad_clean.evt |
| Size (bytes) | 215,475,840 | 30,997,440 |
| Size | 205.5 MB | 29.6 MB |
| Events in quadrant A | 1,524,738 | 179,637 |
| Events in quadrant B | 1,580,517 | 182,005 |
| Events in quadrant C | 1,489,011 | 182,987 |
| Events in quadrant D | 1,715,588 | 169,915 |
| Mode SS | |||
|---|---|---|---|
| Quadrant | BADHDUFLAG | Total packets | Discarded packets |
| A | 0 | 64 | 0 |
| B | 0 | 64 | 0 |
| C | 0 | 64 | 0 |
| D | 0 | 64 | 0 |
| Mode M9 | |||
|---|---|---|---|
| Quadrant | BADHDUFLAG | Total packets | Discarded packets |
| A | 0 | 8 | 0 |
| B | 0 | 8 | 0 |
| C | 0 | 8 | 0 |
| D | 0 | 8 | 0 |
| Mode M0 | |||
|---|---|---|---|
| Quadrant | BADHDUFLAG | Total packets | Discarded packets |
| A | 0 | 6604 | 1 |
| B | 0 | 6718 | 1 |
| C | 0 | 6627 | 1 |
| D | 0 | 7319 | 1 |
| Quadrant | Total seconds | Saturated seconds | Saturation percentage |
|---|---|---|---|
| A | 3145 | 159 | 5.055644% |
| B | 3145 | 163 | 5.182830% |
| C | 3145 | 124 | 3.942766% |
| D | 3145 | 199 | 6.327504% |
Noise dominated data is calculated using 1-second bins in cleaned event files. If a bin has >2000 counts, and if more than 50% of those come from <1% of pixels, then it is considered to be noise-dominated and hence unusable.
| Quadrant | # 1 sec bins | Bins with >0 counts | Bins with >2000 counts | High rate bins dominated by noise | Noise dominated (total time) | Noise dominated (detector-on time) | Marked lightcurve |
|---|---|---|---|---|---|---|---|
| A | 3915 | 3145 | 0 | 0 | 0.00% | 0.00% | 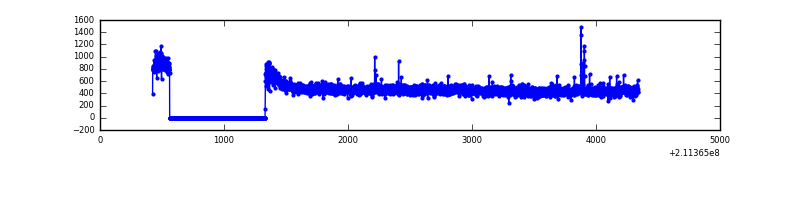 |
| B | 3915 | 3145 | 4 | 4 | 0.10% | 0.13% | 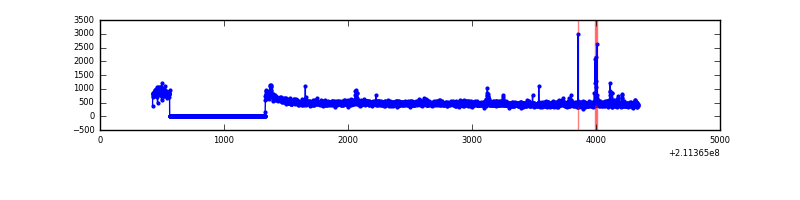 |
| C | 3915 | 3146 | 0 | 0 | 0.00% | 0.00% | 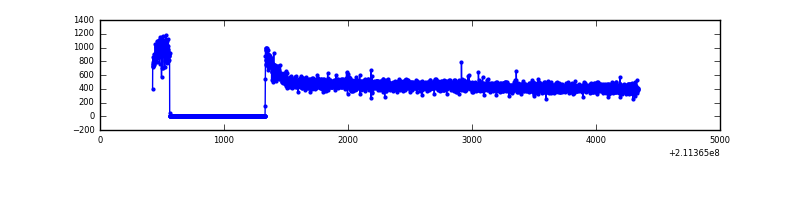 |
| D | 3915 | 3145 | 58 | 58 | 1.48% | 1.84% | 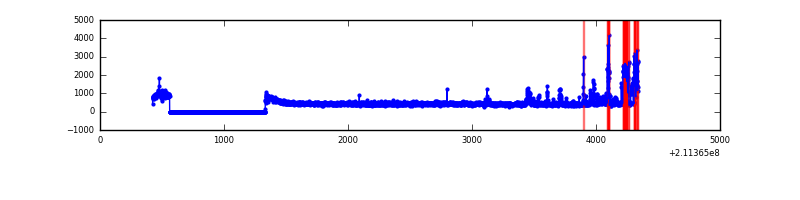 |
Top three noisy pixels from each quadrant. If the there are fewer than three noisy pixels in the level2.evt file, extra rows are filled as -1
| Pixel properties | Quadrant properties | ||||||
|---|---|---|---|---|---|---|---|
| Quadrant | DetID | PixID | Counts | Sigma | Mean | Median | Sigma |
| A | 0 | 247 | 15472 | 184.25 | 387 | 377 | 81.9 |
| A | 0 | 50 | 8683 | 101.39 | 387 | 377 | 81.9 |
| A | 0 | 226 | 5163 | 58.42 | 387 | 377 | 81.9 |
| B | 4 | 80 | 38279 | 492.35 | 388 | 378 | 77.0 |
| B | 15 | 54 | 10313 | 129.06 | 388 | 378 | 77.0 |
| B | 5 | 70 | 10258 | 128.35 | 388 | 378 | 77.0 |
| C | 1 | 16 | 19754 | 216.67 | 376 | 377 | 89.4 |
| C | 13 | 61 | 3072 | 30.13 | 376 | 377 | 89.4 |
| C | 12 | 4 | 1125 | 8.36 | 376 | 377 | 89.4 |
| D | 2 | 14 | 165524 | 1759.36 | 375 | 361 | 93.9 |
| D | 2 | 33 | 72612 | 769.64 | 375 | 361 | 93.9 |
| D | 13 | 105 | 28840 | 303.37 | 375 | 361 | 93.9 |
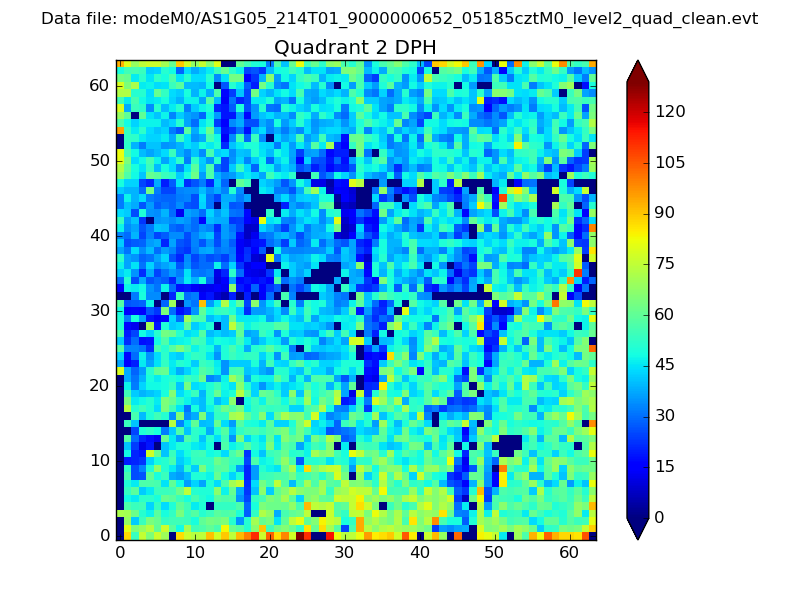
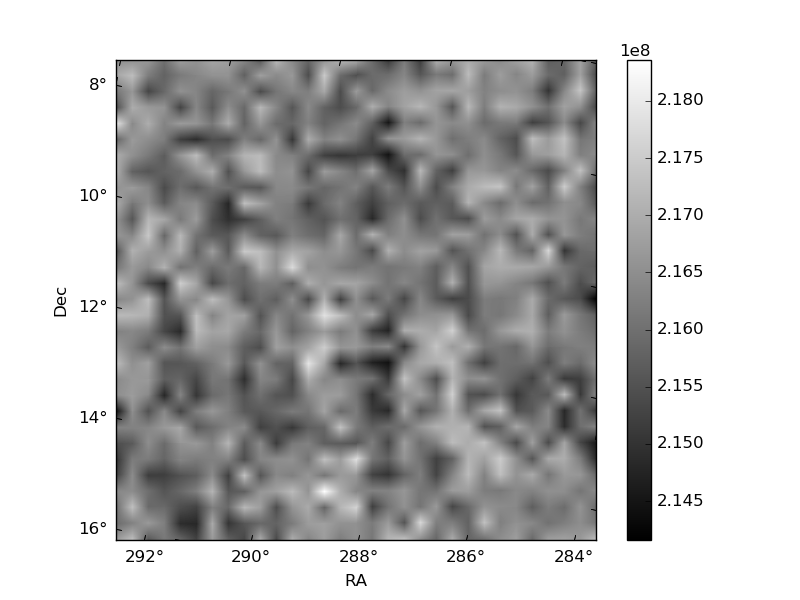
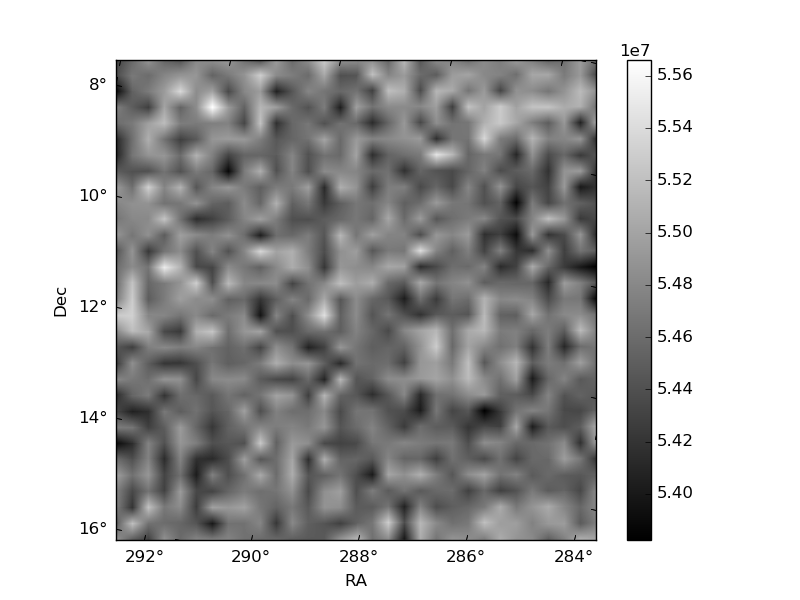
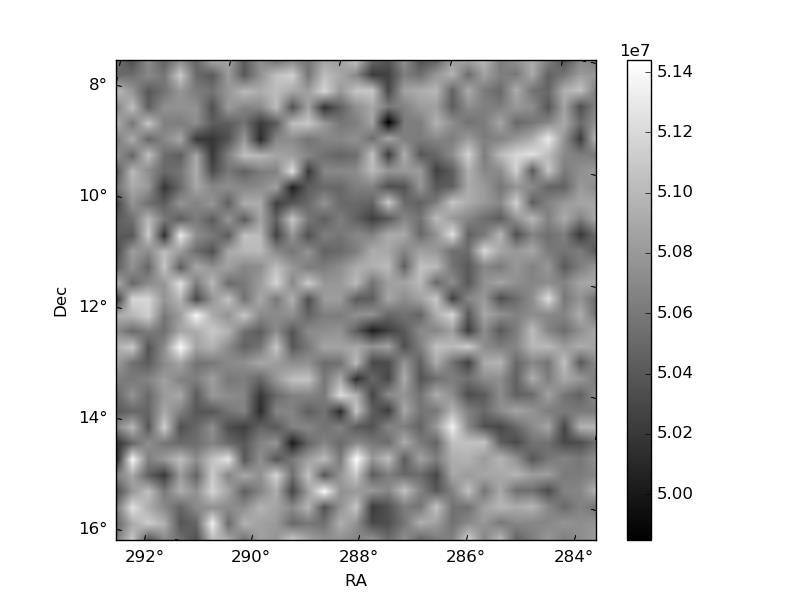
Histogram calculated using DETX and DETY for each event in the final _common_clean file
| Quadrant A | 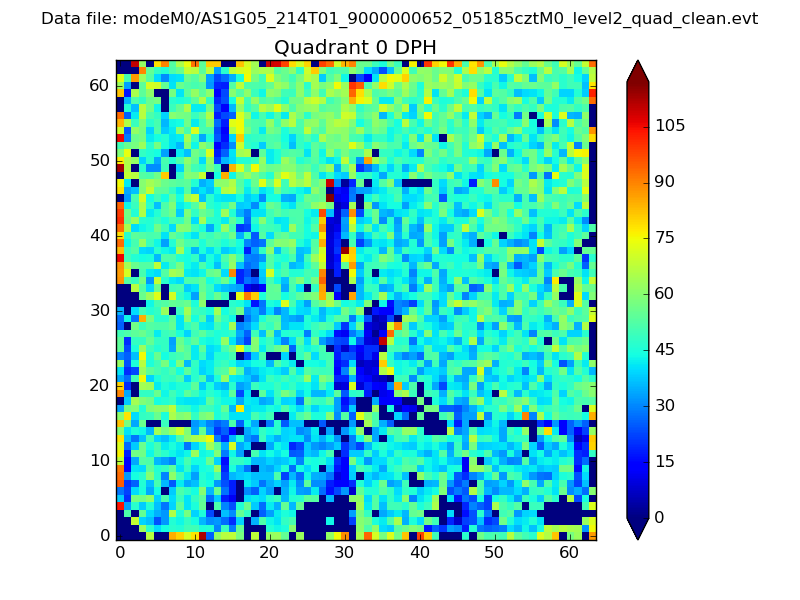 |
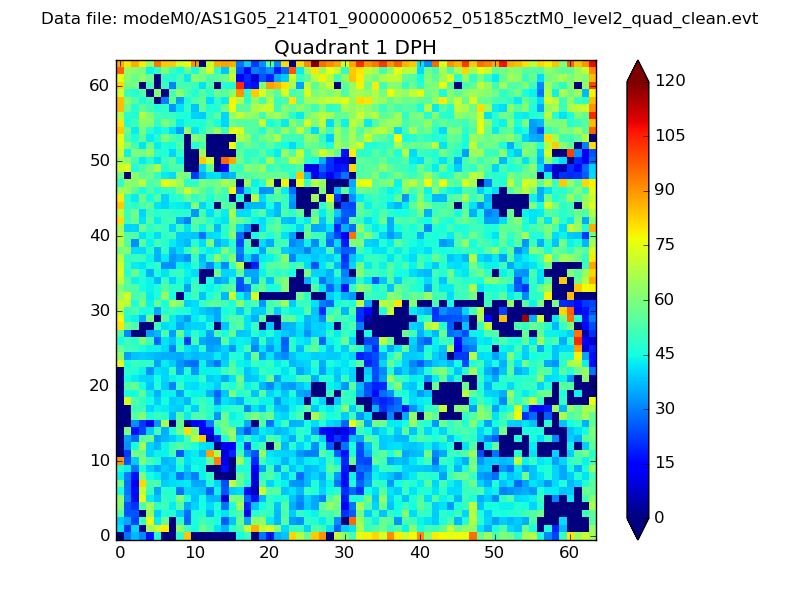 |
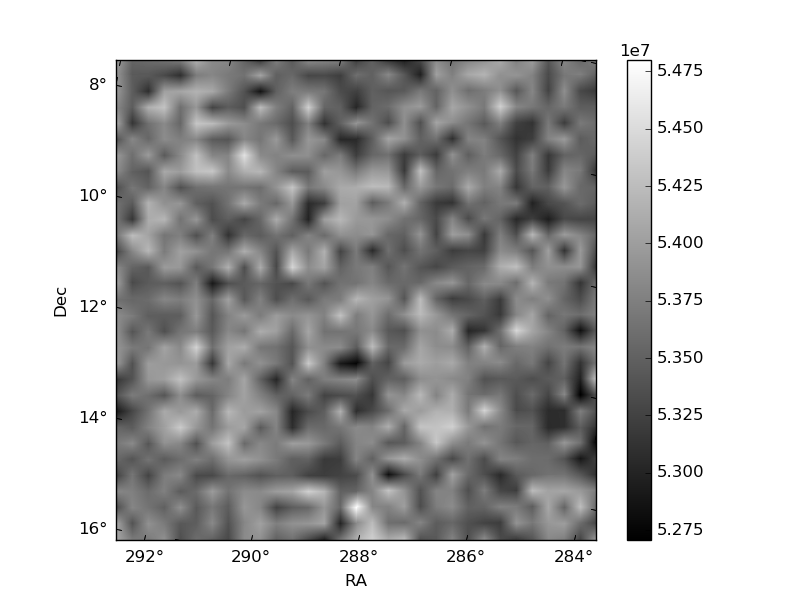
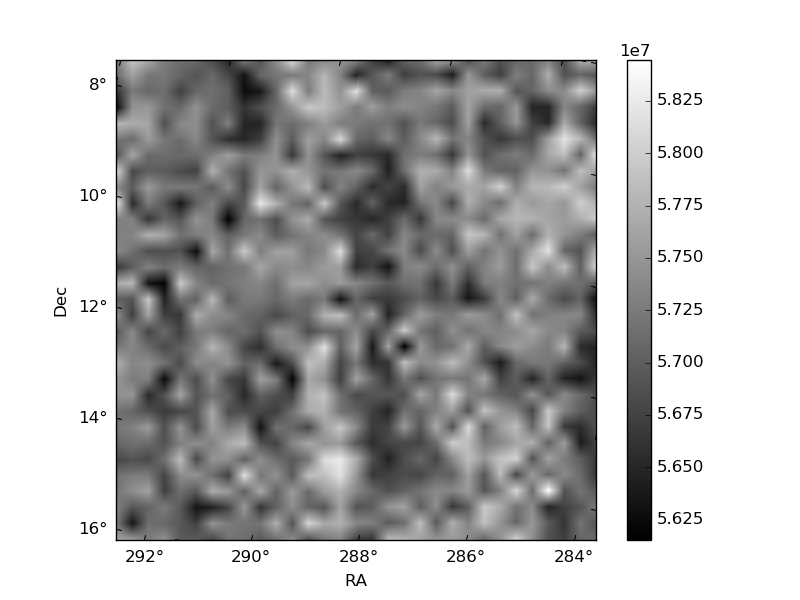
Quadrant B |
|---|---|---|---|
| Quadrant D | 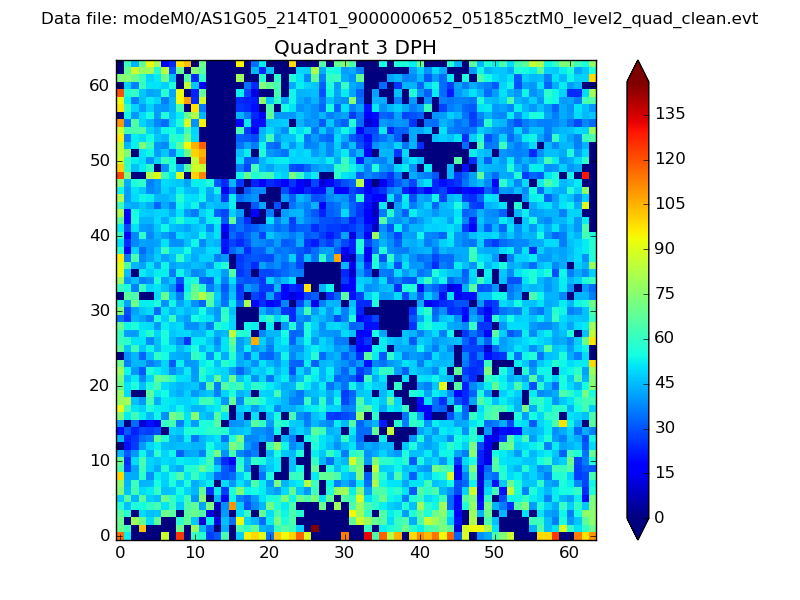 |
 |
Quadrant C |
| Plot type | Count rate plots | Images |
|---|---|---|
| Comparison with Poisson distribution Blue bars denote a histogram of data divided into 1 sec bins. Red curve is a Poisson curve with rate = median count rate of data. |
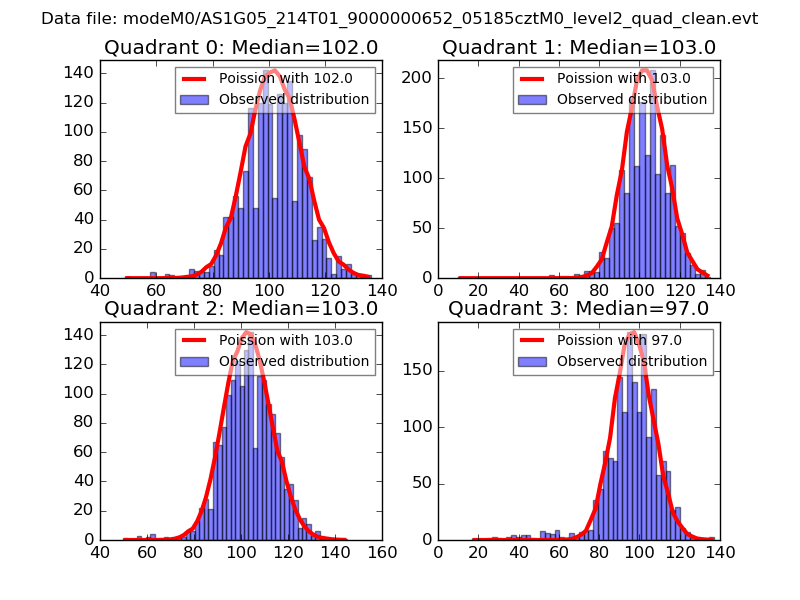 |
 |
| Quadrant-wise count rates Data is divided into 100 sec bins |
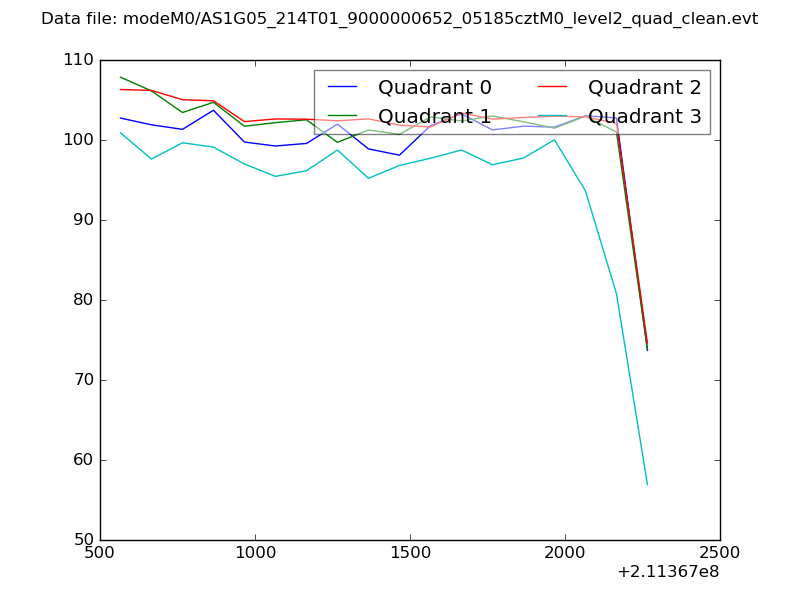 |
|
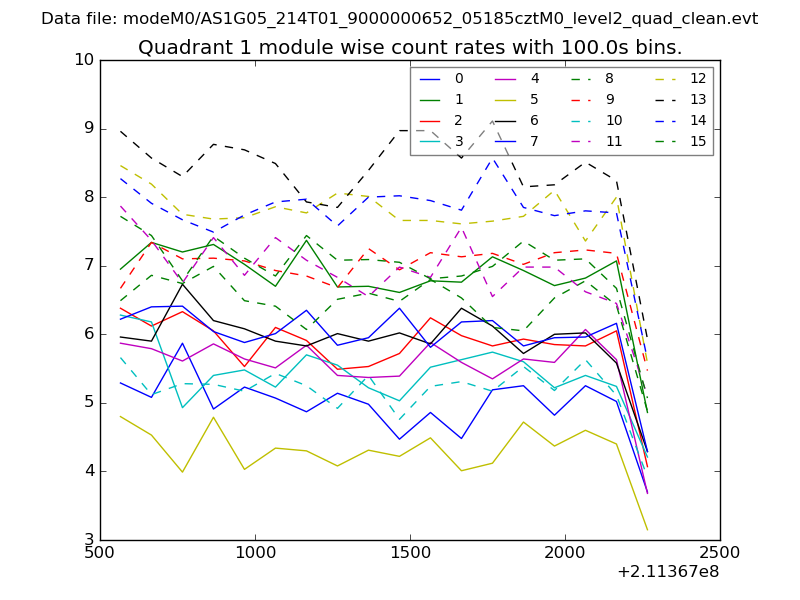
| Module-wise count rates for Quadrant A Data is divided into 100 sec bins |
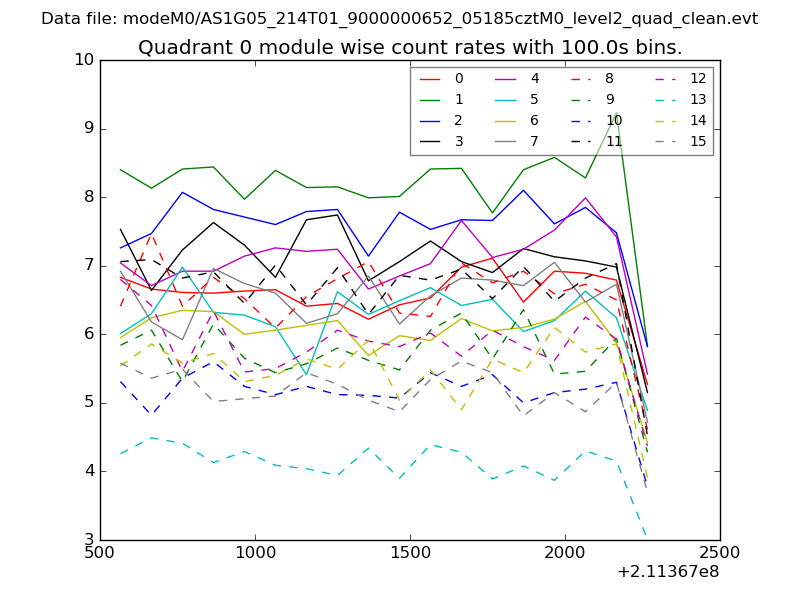 |
 |
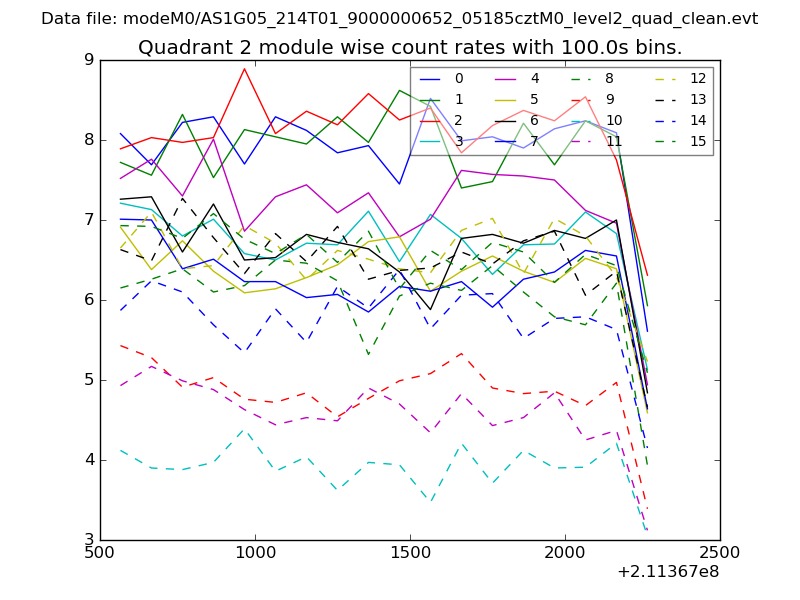
| Module-wise count rates for Quadrant B Data is divided into 100 sec bins |
 |
 |
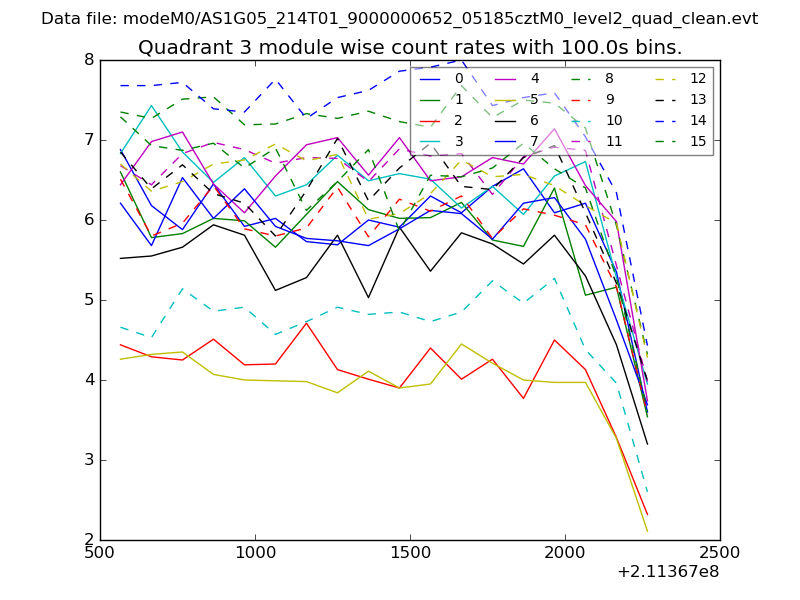
| Module-wise count rates for Quadrant C Data is divided into 100 sec bins |
 |
 |
| Module-wise count rates for Quadrant D Data is divided into 100 sec bins |
 |
 |
| Parameter | Plot |
|---|---|
| CZT HV Monitor | 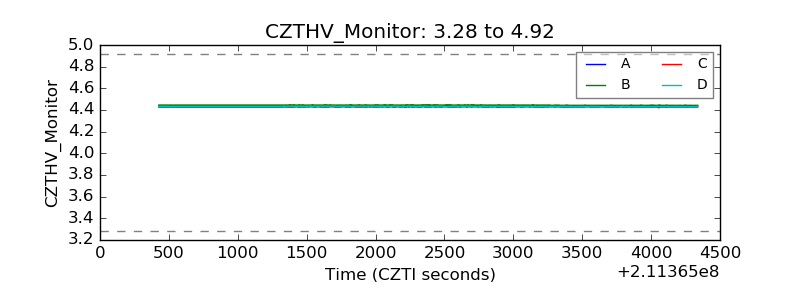 |
| D_VDD | 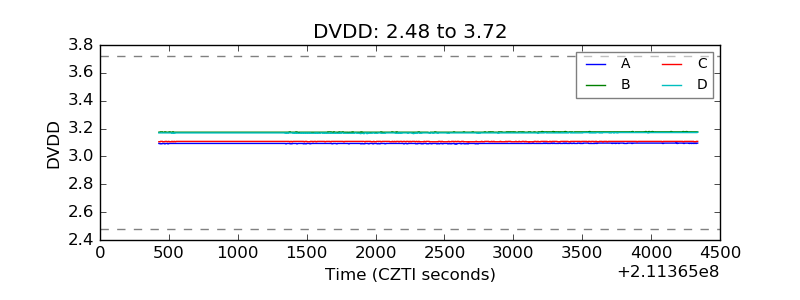 |
| Temperature 1 | 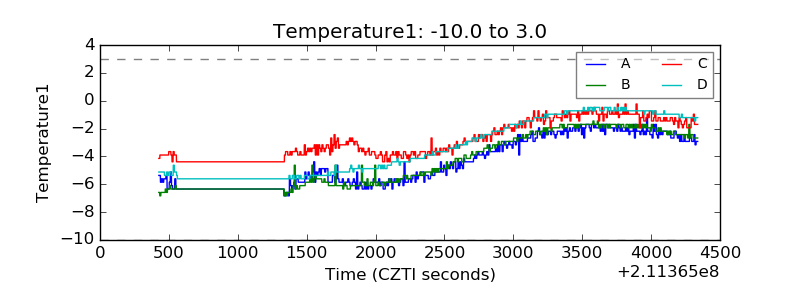 |
| Veto HV Monitor | 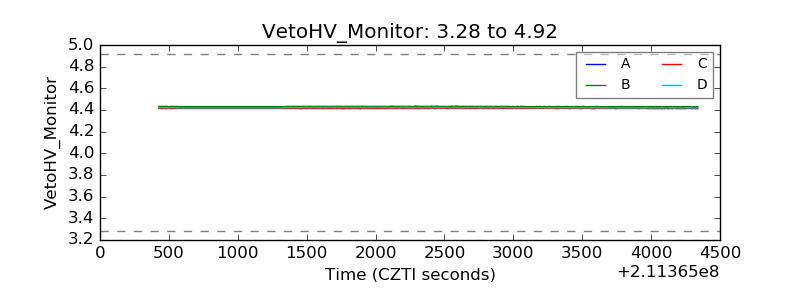 |
| Veto LLD | 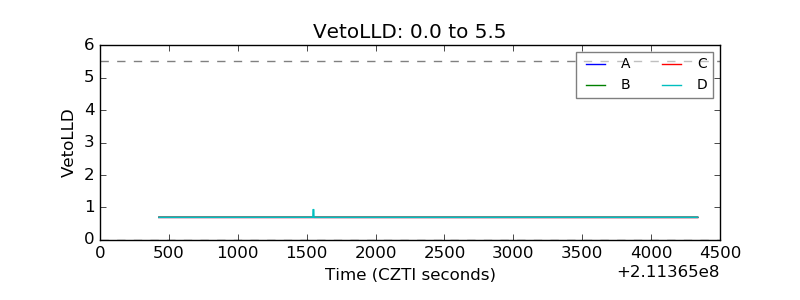 |
| Alpha Counter | 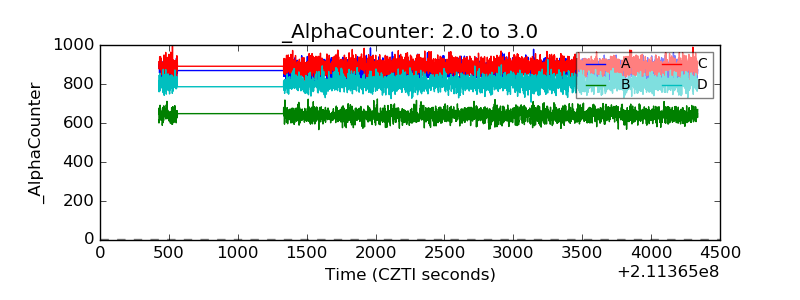 |
| _CPM_Rate |  |
| CZT Counter | 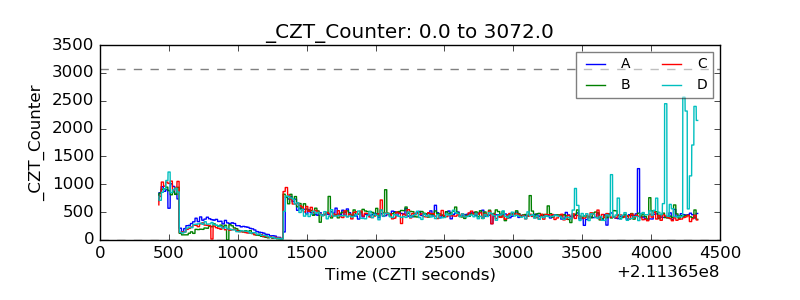 |
| +2.5 Volts monitor |  |
| +5 Volts monitor | 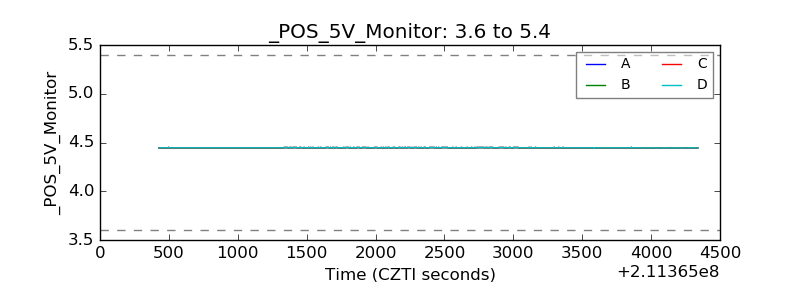 |
| _ROLL_ROT | 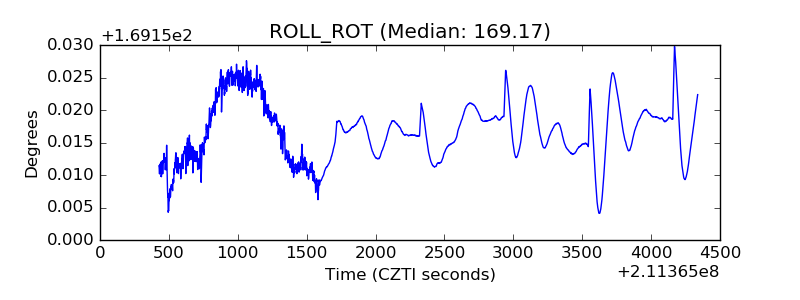 |
| _Roll_DEC | 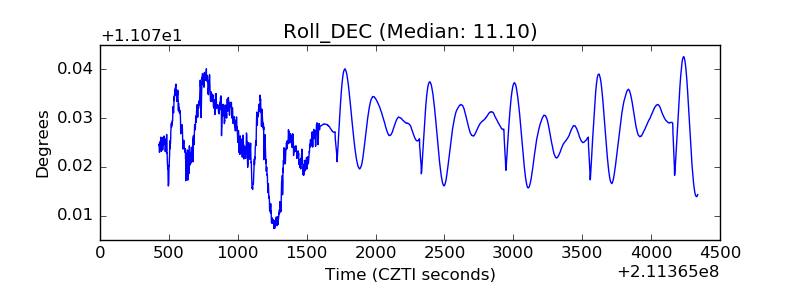 |
| _Roll_RA | 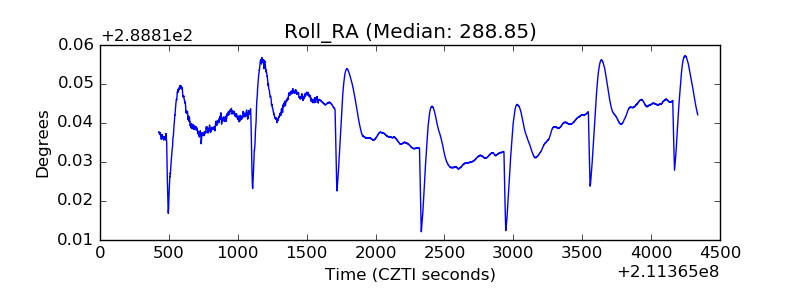 |
| Veto Counter | 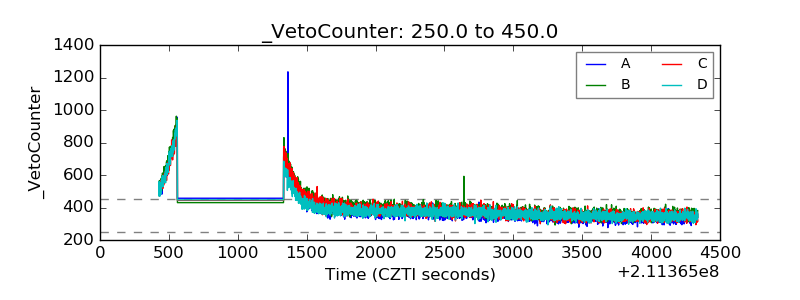 |