| Param | Original file | Final file |
|---|---|---|
| Filename | modeM0/AS1G05_104T01_9000000656cztM0_level2.fits | modeM0/AS1G05_104T01_9000000656cztM0_level2_quad_clean.evt |
| Size (bytes) | 592,862,400 | 744,828,480 |
| Size | 565.4 MB | 710.3 MB |
| Events in quadrant A | 3,544,086 | 4,687,574 |
| Events in quadrant B | 3,448,876 | 4,722,028 |
| Events in quadrant C | 3,538,422 | 4,611,123 |
| Events in quadrant D | 2,974,424 | 4,091,478 |
| Mode M9 | |||
|---|---|---|---|
| Quadrant | BADHDUFLAG | Total packets | Discarded packets |
| A | 0 | 108 | 0 |
| B | 0 | 108 | 0 |
| C | 0 | 108 | 0 |
| D | 0 | 108 | 0 |
| Mode SS | |||
|---|---|---|---|
| Quadrant | BADHDUFLAG | Total packets | Discarded packets |
| A | 0 | 1328 | 0 |
| B | 0 | 1320 | 0 |
| C | 0 | 1330 | 0 |
| D | 0 | 1326 | 0 |
| Mode M0 | |||
|---|---|---|---|
| Quadrant | BADHDUFLAG | Total packets | Discarded packets |
| A | 0 | 134917 | 0 |
| B | 0 | 135164 | 0 |
| C | 0 | 132245 | 0 |
| D | 0 | 163805 | 0 |
| Quadrant | Total seconds | Saturated seconds | Saturation percentage |
|---|---|---|---|
| A | 64882 | 812 | 1.251503% |
| B | 64846 | 665 | 1.025507% |
| C | 64871 | 394 | 0.607359% |
| D | 64714 | 2824 | 4.363816% |
Noise dominated data is calculated using 1-second bins in cleaned event files. If a bin has >2000 counts, and if more than 50% of those come from <1% of pixels, then it is considered to be noise-dominated and hence unusable.
| Quadrant | # 1 sec bins | Bins with >0 counts | Bins with >2000 counts | High rate bins dominated by noise | Noise dominated (total time) | Noise dominated (detector-on time) | Marked lightcurve |
|---|---|---|---|---|---|---|---|
| A | 77873 | 65256 | 0 | 0 | 0.00% | 0.00% | 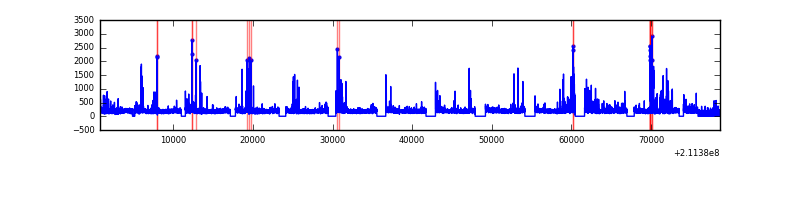 |
| B | 77875 | 65225 | 0 | 0 | 0.00% | 0.00% | 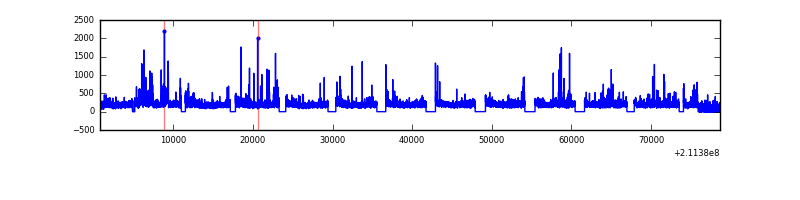 |
| C | 77874 | 65258 | 0 | 0 | 0.00% | 0.00% |  |
| D | 77875 | 64972 | 0 | 0 | 0.00% | 0.00% | 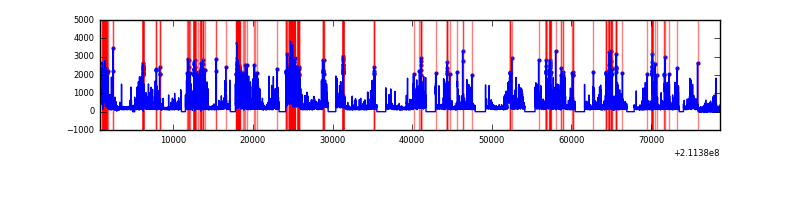 |
Top three noisy pixels from each quadrant. If the there are fewer than three noisy pixels in the level2.evt file, extra rows are filled as -1
| Pixel properties | Quadrant properties | ||||||
|---|---|---|---|---|---|---|---|
| Quadrant | DetID | PixID | Counts | Sigma | Mean | Median | Sigma |
| A | 0 | 29 | 3513 | 11.22 | 920 | 861 | 236.3 |
| A | 7 | 110 | 2995 | 9.03 | 920 | 861 | 236.3 |
| A | 0 | 30 | 2695 | 7.76 | 920 | 861 | 236.3 |
| B | 2 | 9 | 3004 | 11.71 | 909 | 867 | 182.4 |
| B | 12 | 226 | 2546 | 9.2 | 909 | 867 | 182.4 |
| B | 5 | 128 | 2320 | 7.97 | 909 | 867 | 182.4 |
| C | 1 | 80 | 2660 | 7.27 | 934 | 866 | 246.8 |
| C | 1 | 81 | 2545 | 6.8 | 934 | 866 | 246.8 |
| C | 12 | 241 | 2421 | 6.3 | 934 | 866 | 246.8 |
| D | 11 | 82 | 2302 | 6.84 | 846 | 770 | 224.0 |
| D | 3 | 14 | 2274 | 6.71 | 846 | 770 | 224.0 |
| D | 6 | 231 | 2250 | 6.61 | 846 | 770 | 224.0 |
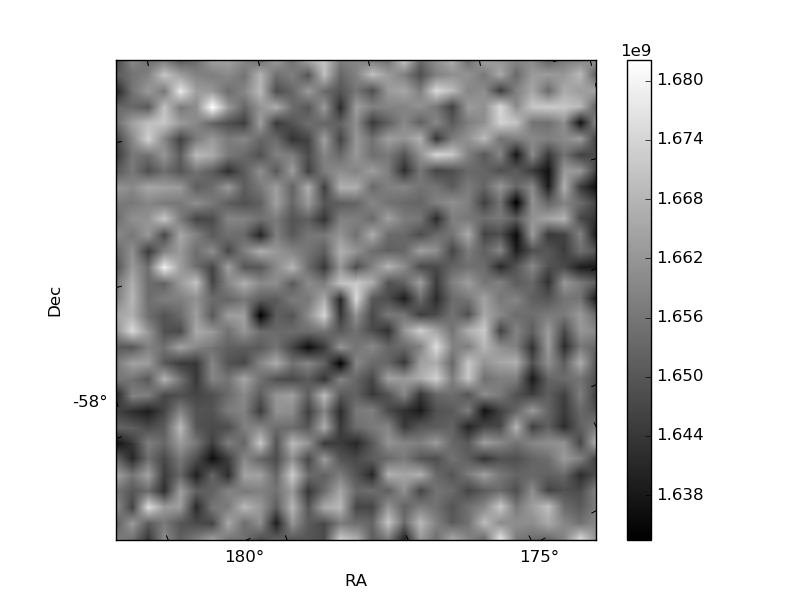
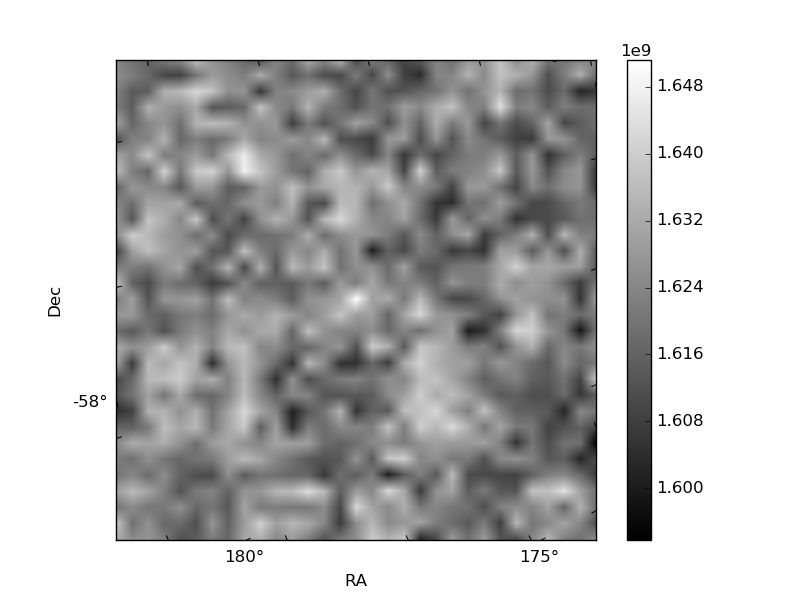
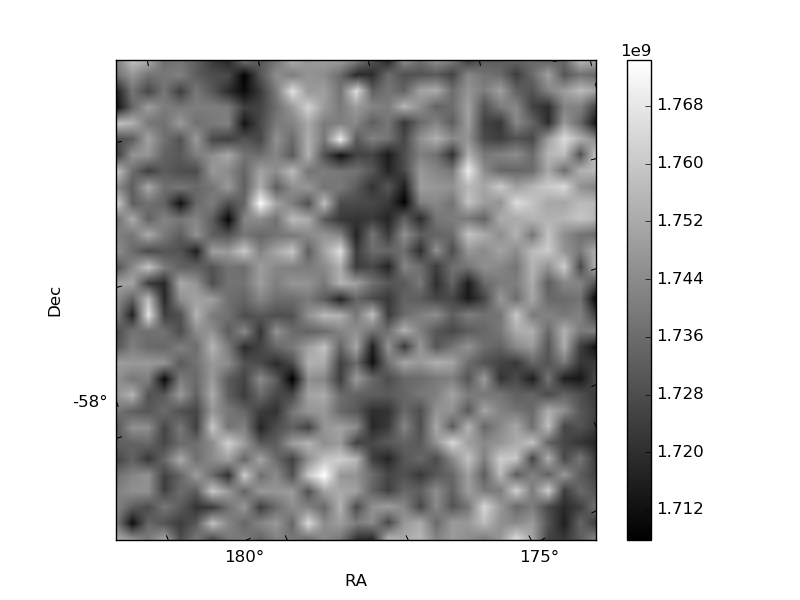
Histogram calculated using DETX and DETY for each event in the final _common_clean file
| Quadrant A |  |
 |
Quadrant B |
|---|---|---|---|
| Quadrant D |  |
 |
Quadrant C |
| Plot type | Count rate plots | Images |
|---|---|---|
| Comparison with Poisson distribution Blue bars denote a histogram of data divided into 1 sec bins. Red curve is a Poisson curve with rate = median count rate of data. |
 |
 |
| Quadrant-wise count rates Data is divided into 100 sec bins |
 |
|
| Module-wise count rates for Quadrant A Data is divided into 100 sec bins |
 |
 |
| Module-wise count rates for Quadrant B Data is divided into 100 sec bins |
 |
 |
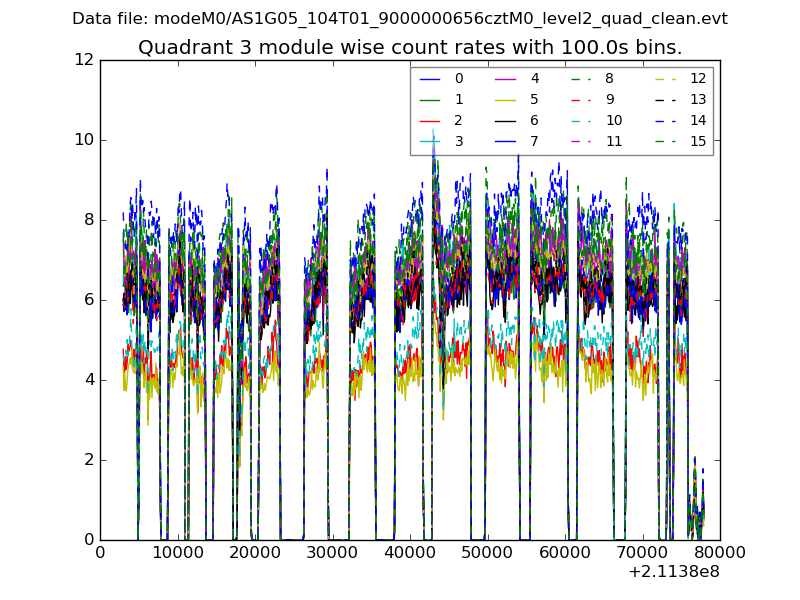
| Module-wise count rates for Quadrant C Data is divided into 100 sec bins |
 |
 |
| Module-wise count rates for Quadrant D Data is divided into 100 sec bins |
 |
 |
| Parameter | Plot |
|---|---|
| CZT HV Monitor |  |
| D_VDD |  |
| Temperature 1 |  |
| Veto HV Monitor |  |
| Veto LLD |  |
| Alpha Counter |  |
| _CPM_Rate | 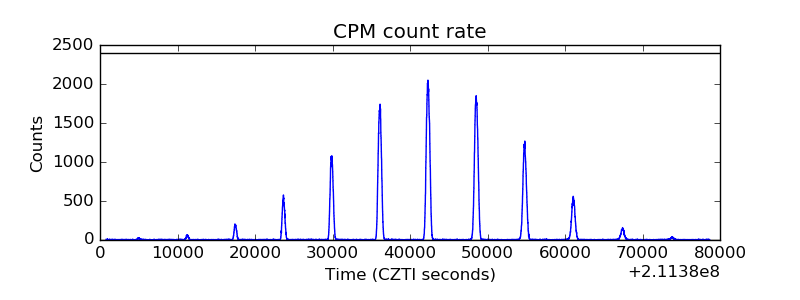 |
| CZT Counter |  |
| +2.5 Volts monitor |  |
| +5 Volts monitor |  |
| _ROLL_ROT |  |
| _Roll_DEC |  |
| _Roll_RA |  |
| Veto Counter |  |