| Param | Original file | Final file |
|---|---|---|
| Filename | modeM0/AS1G05_104T01_9000000656_05190cztM0_level2.evt | modeM0/AS1G05_104T01_9000000656_05190cztM0_level2_quad_clean.evt |
| Size (bytes) | 1,224,155,520 | 230,175,360 |
| Size | 1.1 GB | 219.5 MB |
| Events in quadrant A | 7,929,940 | 1,460,332 |
| Events in quadrant B | 8,560,789 | 1,461,050 |
| Events in quadrant C | 7,673,339 | 1,476,387 |
| Events in quadrant D | 11,727,281 | 1,368,211 |
| Mode M9 | |||
|---|---|---|---|
| Quadrant | BADHDUFLAG | Total packets | Discarded packets |
| A | 0 | 21 | 0 |
| B | 0 | 21 | 0 |
| C | 0 | 21 | 0 |
| D | 0 | 21 | 0 |
| Mode SS | |||
|---|---|---|---|
| Quadrant | BADHDUFLAG | Total packets | Discarded packets |
| A | 0 | 354 | 0 |
| B | 0 | 354 | 0 |
| C | 0 | 354 | 0 |
| D | 0 | 354 | 0 |
| Mode M0 | |||
|---|---|---|---|
| Quadrant | BADHDUFLAG | Total packets | Discarded packets |
| A | 0 | 36084 | 3 |
| B | 0 | 37270 | 2 |
| C | 0 | 35578 | 2 |
| D | 0 | 47251 | 2 |
| Quadrant | Total seconds | Saturated seconds | Saturation percentage |
|---|---|---|---|
| A | 17487 | 178 | 1.017899% |
| B | 17487 | 144 | 0.823469% |
| C | 17487 | 69 | 0.394579% |
| D | 17487 | 1075 | 6.147424% |
Noise dominated data is calculated using 1-second bins in cleaned event files. If a bin has >2000 counts, and if more than 50% of those come from <1% of pixels, then it is considered to be noise-dominated and hence unusable.
| Quadrant | # 1 sec bins | Bins with >0 counts | Bins with >2000 counts | High rate bins dominated by noise | Noise dominated (total time) | Noise dominated (detector-on time) | Marked lightcurve |
|---|---|---|---|---|---|---|---|
| A | 19492 | 17490 | 52 | 52 | 0.27% | 0.30% | 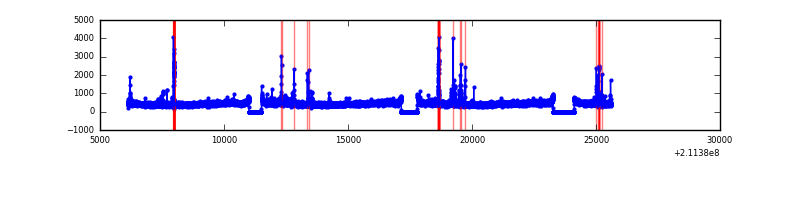 |
| B | 19492 | 17490 | 16 | 16 | 0.08% | 0.09% | 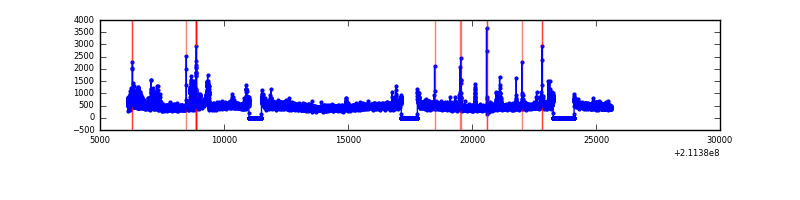 |
| C | 19492 | 17490 | 2 | 2 | 0.01% | 0.01% | 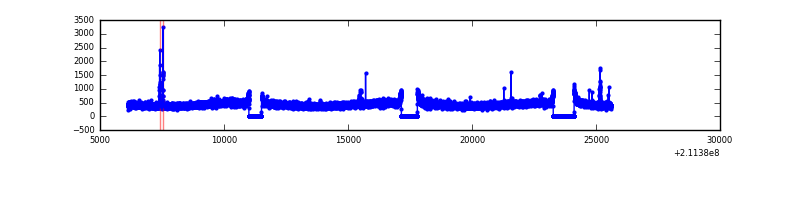 |
| D | 19492 | 17490 | 833 | 833 | 4.27% | 4.76% | 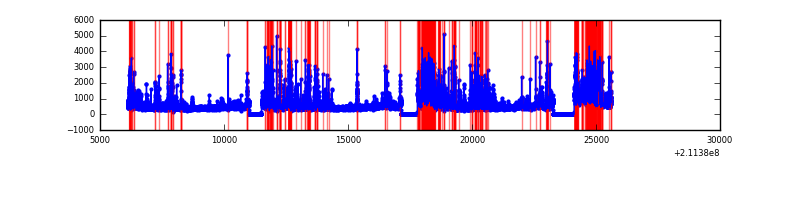 |
Top three noisy pixels from each quadrant. If the there are fewer than three noisy pixels in the level2.evt file, extra rows are filled as -1
| Pixel properties | Quadrant properties | ||||||
|---|---|---|---|---|---|---|---|
| Quadrant | DetID | PixID | Counts | Sigma | Mean | Median | Sigma |
| A | 0 | 50 | 242377 | 602.75 | 1965 | 1924 | 398.9 |
| A | 4 | 2 | 44085 | 105.69 | 1965 | 1924 | 398.9 |
| A | 0 | 247 | 39845 | 95.06 | 1965 | 1924 | 398.9 |
| B | 15 | 204 | 406474 | 1074.58 | 1985 | 1940 | 376.5 |
| B | 0 | 187 | 229078 | 603.35 | 1985 | 1940 | 376.5 |
| B | 4 | 48 | 94661 | 246.3 | 1985 | 1940 | 376.5 |
| C | 1 | 16 | 99991 | 223.08 | 1911 | 1920 | 439.6 |
| C | 12 | 4 | 49618 | 108.5 | 1911 | 1920 | 439.6 |
| C | 8 | 128 | 28110 | 59.57 | 1911 | 1920 | 439.6 |
| D | 2 | 33 | 1946330 | 4263.44 | 1863 | 1804 | 456.1 |
| D | 14 | 34 | 942559 | 2062.64 | 1863 | 1804 | 456.1 |
| D | 12 | 233 | 457191 | 998.45 | 1863 | 1804 | 456.1 |
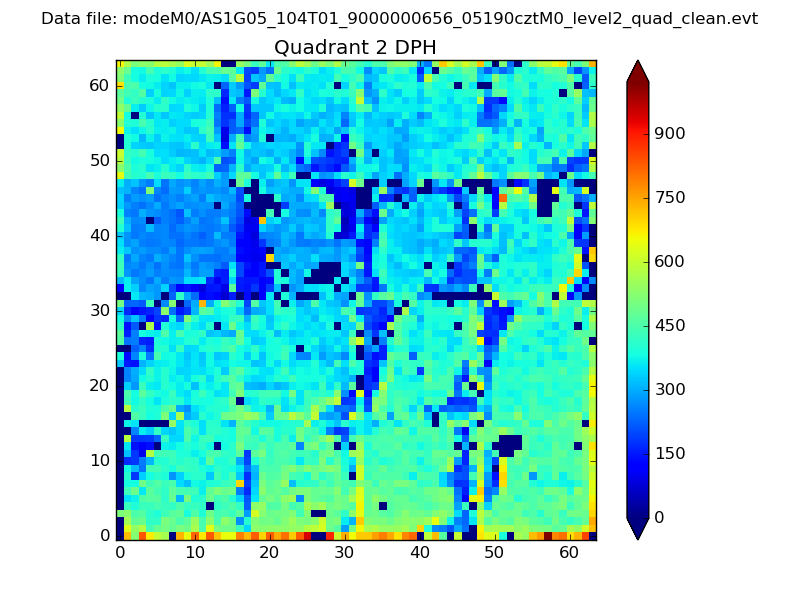
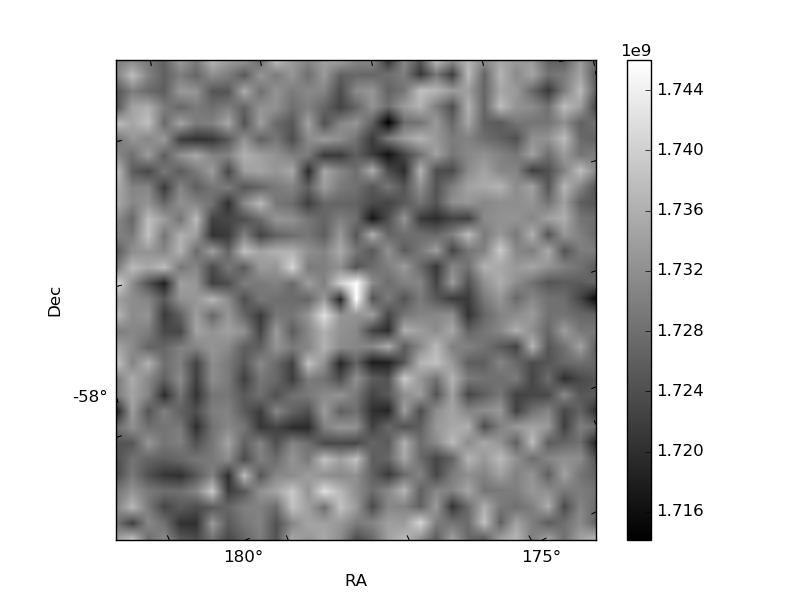
Histogram calculated using DETX and DETY for each event in the final _common_clean file
| Quadrant A | 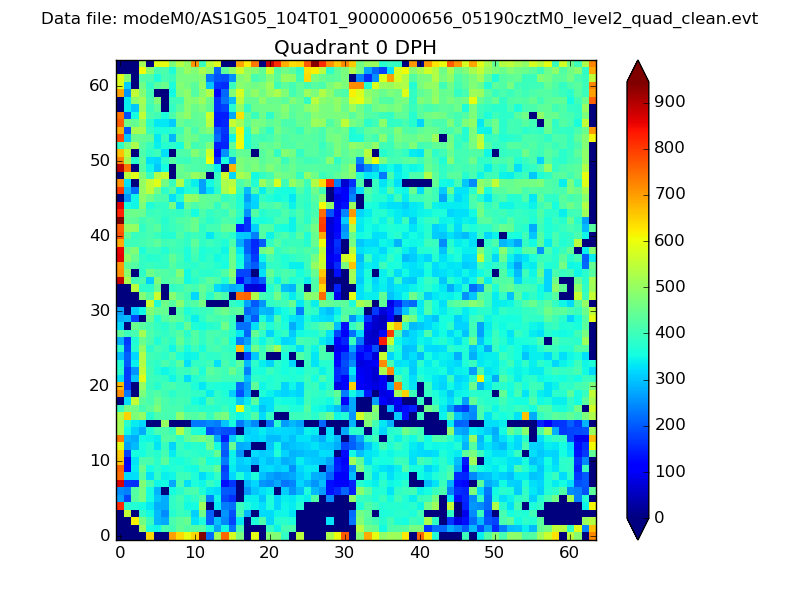 |
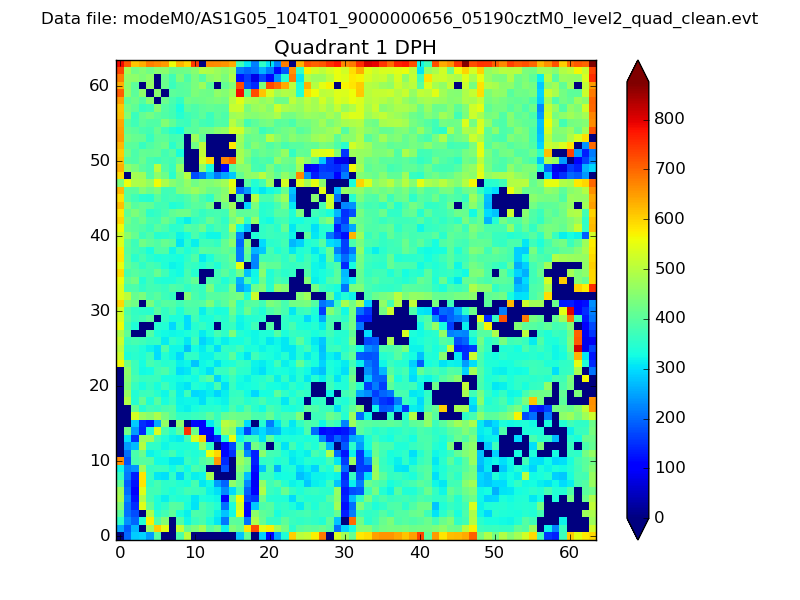 |
Quadrant B |
|---|---|---|---|
| Quadrant D | 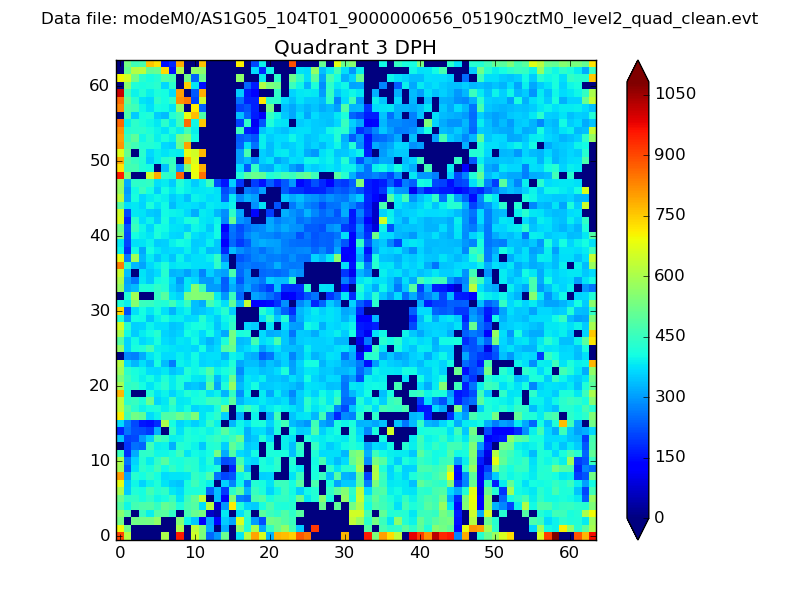 |
 |
Quadrant C |
| Plot type | Count rate plots | Images |
|---|---|---|
| Comparison with Poisson distribution Blue bars denote a histogram of data divided into 1 sec bins. Red curve is a Poisson curve with rate = median count rate of data. |
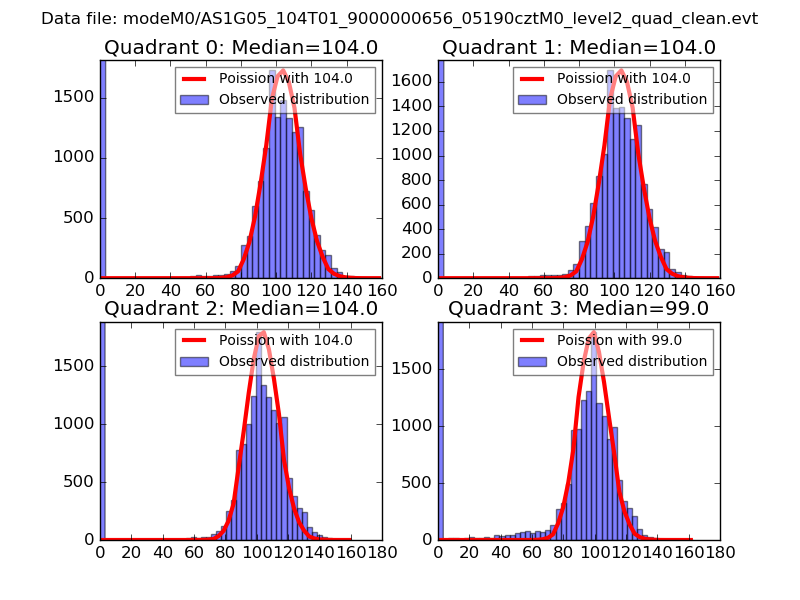 |
 |
| Quadrant-wise count rates Data is divided into 100 sec bins |
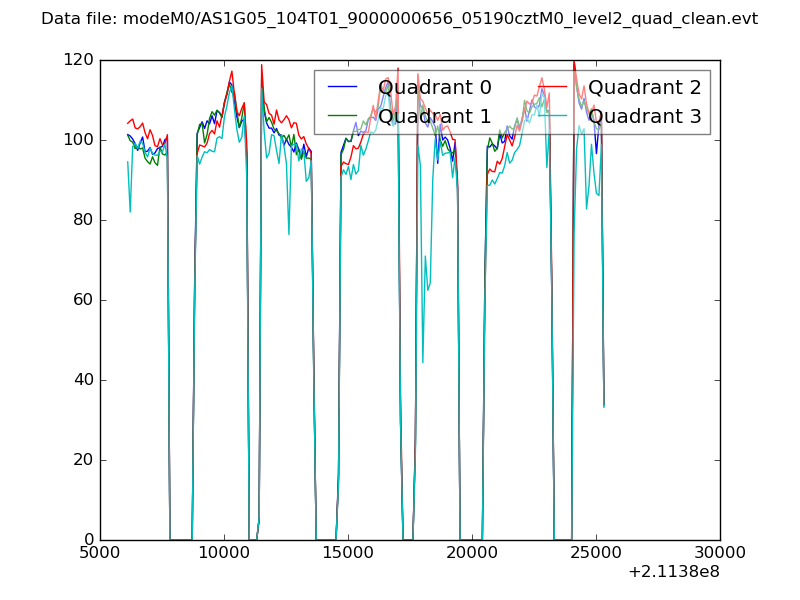 |
|
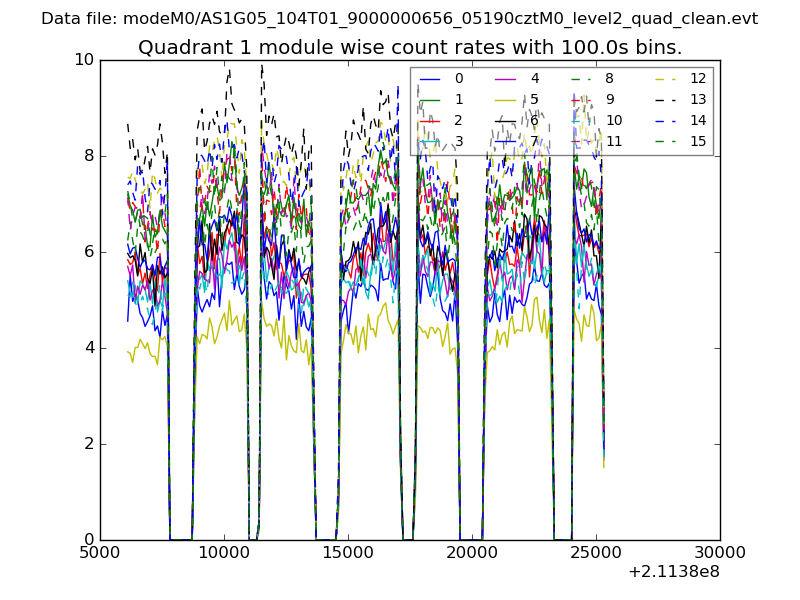
| Module-wise count rates for Quadrant A Data is divided into 100 sec bins |
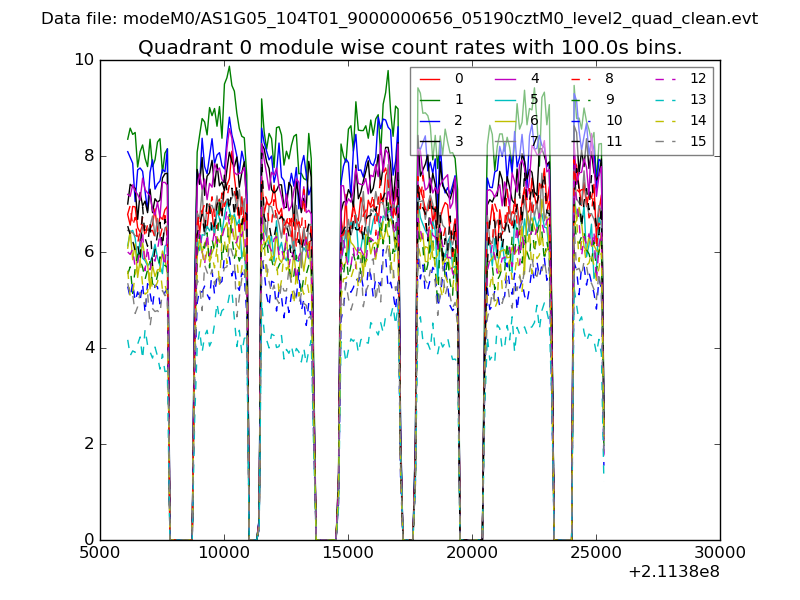 |
 |
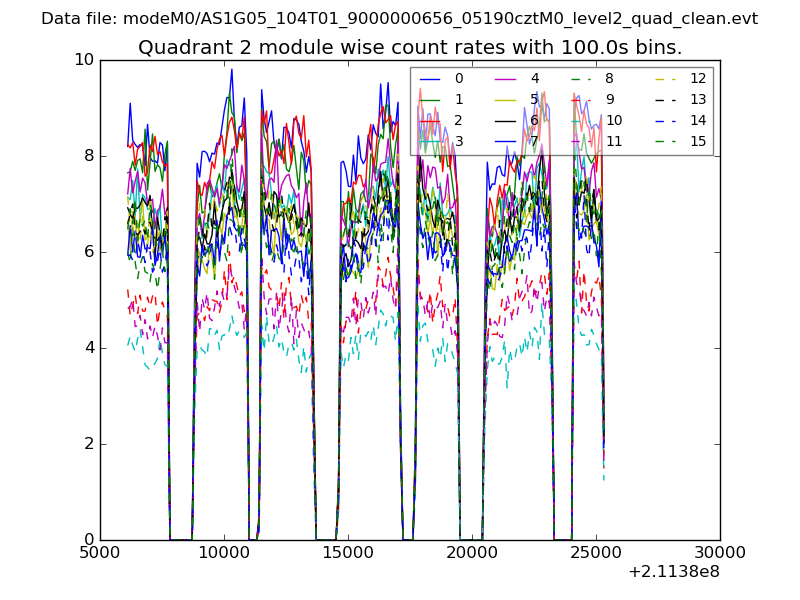
| Module-wise count rates for Quadrant B Data is divided into 100 sec bins |
 |
 |
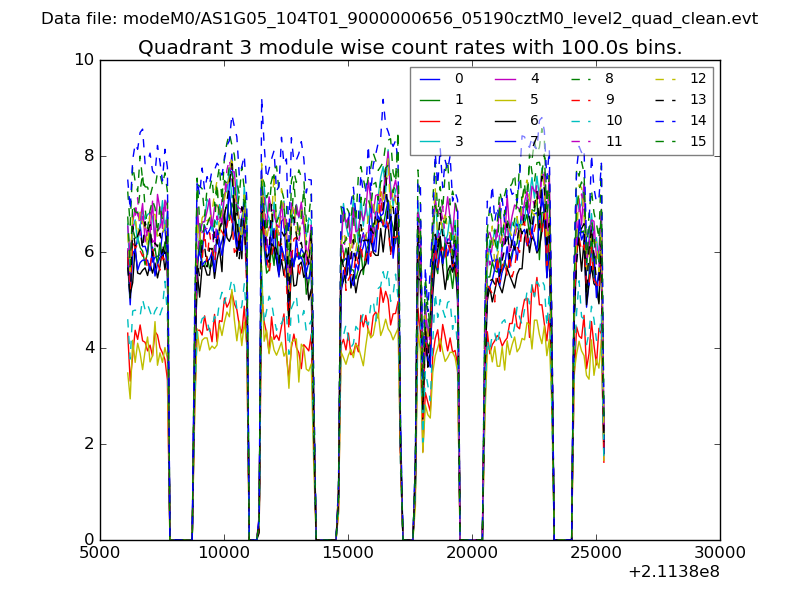
| Module-wise count rates for Quadrant C Data is divided into 100 sec bins |
 |
 |
| Module-wise count rates for Quadrant D Data is divided into 100 sec bins |
 |
 |
| Parameter | Plot |
|---|---|
| CZT HV Monitor | 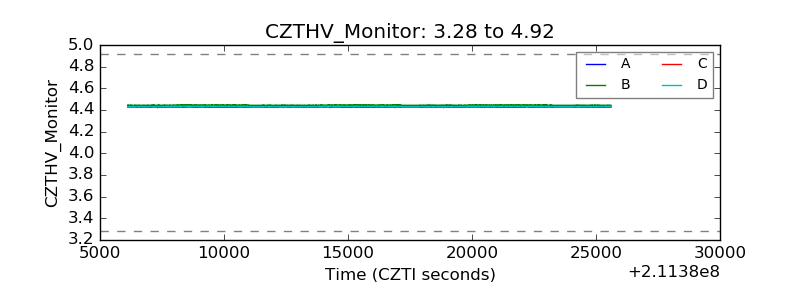 |
| D_VDD | 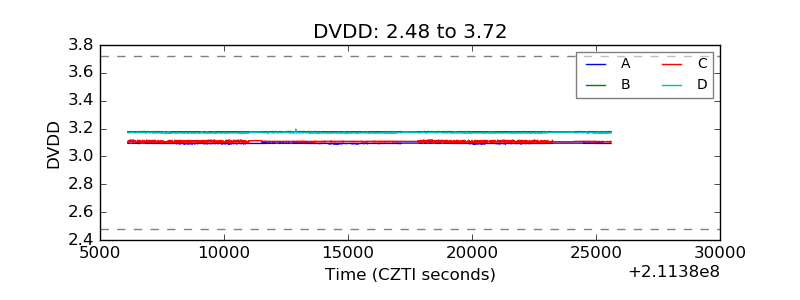 |
| Temperature 1 | 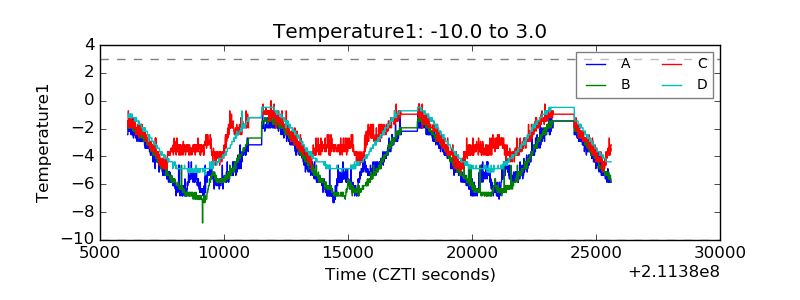 |
| Veto HV Monitor | 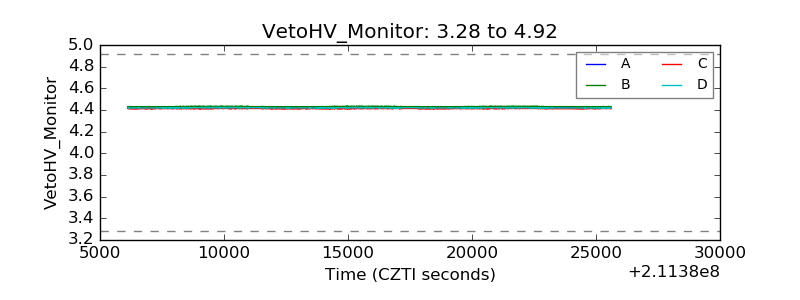 |
| Veto LLD | 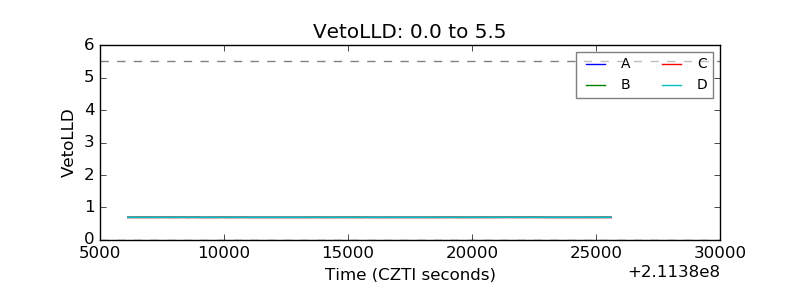 |
| Alpha Counter | 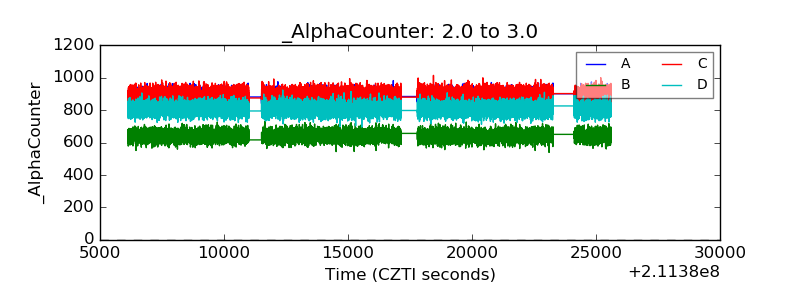 |
| _CPM_Rate | 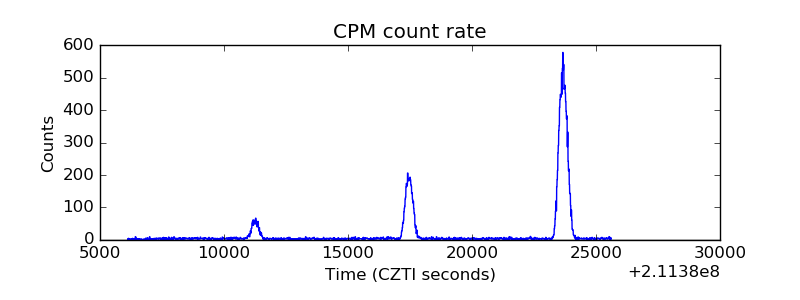 |
| CZT Counter |  |
| +2.5 Volts monitor |  |
| +5 Volts monitor |  |
| _ROLL_ROT | 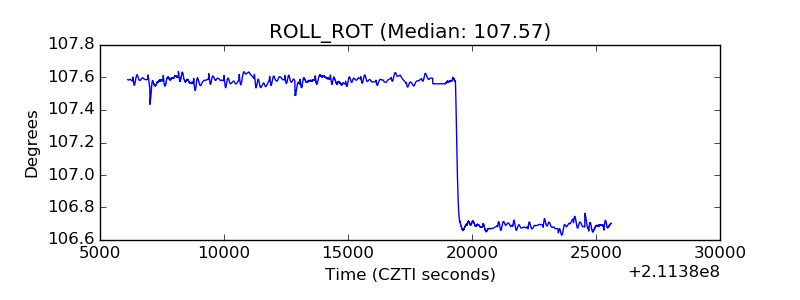 |
| _Roll_DEC | 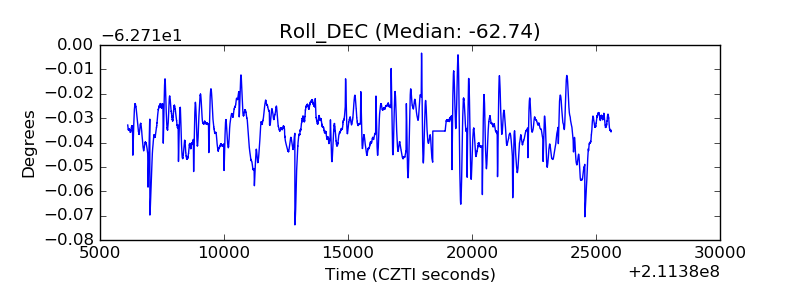 |
| _Roll_RA | 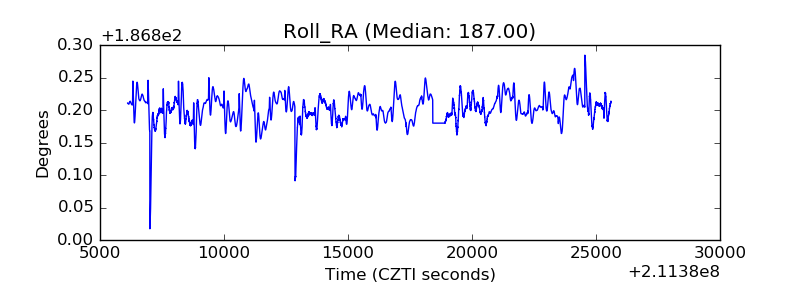 |
| Veto Counter | 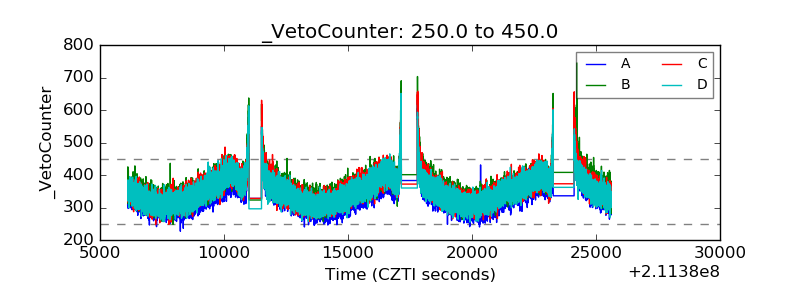 |