| Param | Original file | Final file |
|---|---|---|
| Filename | modeM0/AS1G05_104T01_9000000656_05193cztM0_level2.evt | modeM0/AS1G05_104T01_9000000656_05193cztM0_level2_quad_clean.evt |
| Size (bytes) | 423,480,960 | 78,315,840 |
| Size | 403.9 MB | 74.7 MB |
| Events in quadrant A | 2,994,825 | 482,254 |
| Events in quadrant B | 3,082,887 | 485,937 |
| Events in quadrant C | 2,889,735 | 486,395 |
| Events in quadrant D | 3,414,270 | 462,067 |
| Mode M9 | |||
|---|---|---|---|
| Quadrant | BADHDUFLAG | Total packets | Discarded packets |
| A | 0 | 12 | 0 |
| B | 0 | 12 | 0 |
| C | 0 | 12 | 0 |
| D | 0 | 13 | 0 |
| Mode SS | |||
|---|---|---|---|
| Quadrant | BADHDUFLAG | Total packets | Discarded packets |
| A | 0 | 132 | 0 |
| B | 0 | 132 | 0 |
| C | 0 | 132 | 0 |
| D | 0 | 132 | 0 |
| Mode M0 | |||
|---|---|---|---|
| Quadrant | BADHDUFLAG | Total packets | Discarded packets |
| A | 0 | 13462 | 3 |
| B | 0 | 13520 | 2 |
| C | 0 | 13203 | 2 |
| D | 0 | 14854 | 2 |
| Quadrant | Total seconds | Saturated seconds | Saturation percentage |
|---|---|---|---|
| A | 6522 | 22 | 0.337320% |
| B | 6522 | 33 | 0.505980% |
| C | 6522 | 4 | 0.061331% |
| D | 6522 | 71 | 1.088623% |
Noise dominated data is calculated using 1-second bins in cleaned event files. If a bin has >2000 counts, and if more than 50% of those come from <1% of pixels, then it is considered to be noise-dominated and hence unusable.
| Quadrant | # 1 sec bins | Bins with >0 counts | Bins with >2000 counts | High rate bins dominated by noise | Noise dominated (total time) | Noise dominated (detector-on time) | Marked lightcurve |
|---|---|---|---|---|---|---|---|
| A | 7647 | 6523 | 4 | 4 | 0.05% | 0.06% | 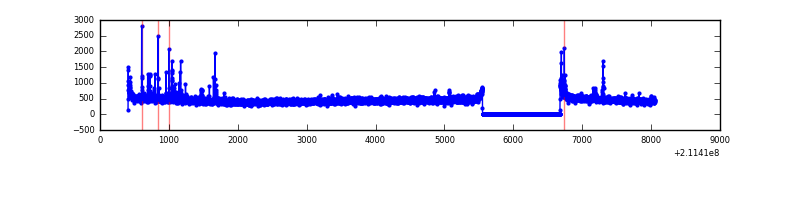 |
| B | 7647 | 6523 | 4 | 4 | 0.05% | 0.06% | 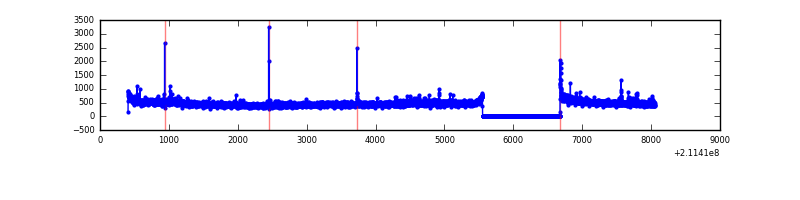 |
| C | 7647 | 6523 | 0 | 0 | 0.00% | 0.00% | 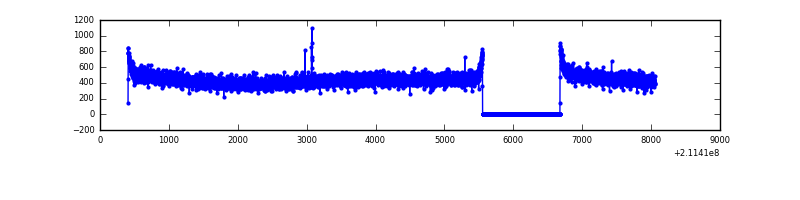 |
| D | 7647 | 6523 | 60 | 60 | 0.78% | 0.92% | 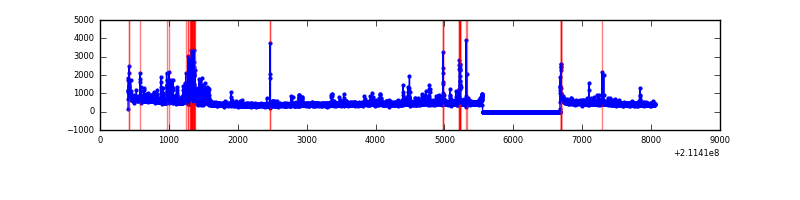 |
Top three noisy pixels from each quadrant. If the there are fewer than three noisy pixels in the level2.evt file, extra rows are filled as -1
| Pixel properties | Quadrant properties | ||||||
|---|---|---|---|---|---|---|---|
| Quadrant | DetID | PixID | Counts | Sigma | Mean | Median | Sigma |
| A | 0 | 50 | 61170 | 394.86 | 751 | 734 | 153.1 |
| A | 4 | 2 | 36148 | 231.38 | 751 | 734 | 153.1 |
| A | 12 | 194 | 7459 | 43.94 | 751 | 734 | 153.1 |
| B | 4 | 48 | 45167 | 306.6 | 765 | 749 | 144.9 |
| B | 0 | 219 | 33235 | 224.24 | 765 | 749 | 144.9 |
| B | 0 | 183 | 16080 | 105.83 | 765 | 749 | 144.9 |
| C | 1 | 16 | 22555 | 130.07 | 733 | 737 | 167.7 |
| C | 13 | 61 | 6112 | 32.04 | 733 | 737 | 167.7 |
| C | 14 | 67 | 4570 | 22.85 | 733 | 737 | 167.7 |
| D | 2 | 136 | 209533 | 1178.91 | 726 | 706 | 177.1 |
| D | 13 | 53 | 158136 | 888.75 | 726 | 706 | 177.1 |
| D | 13 | 105 | 100961 | 565.98 | 726 | 706 | 177.1 |
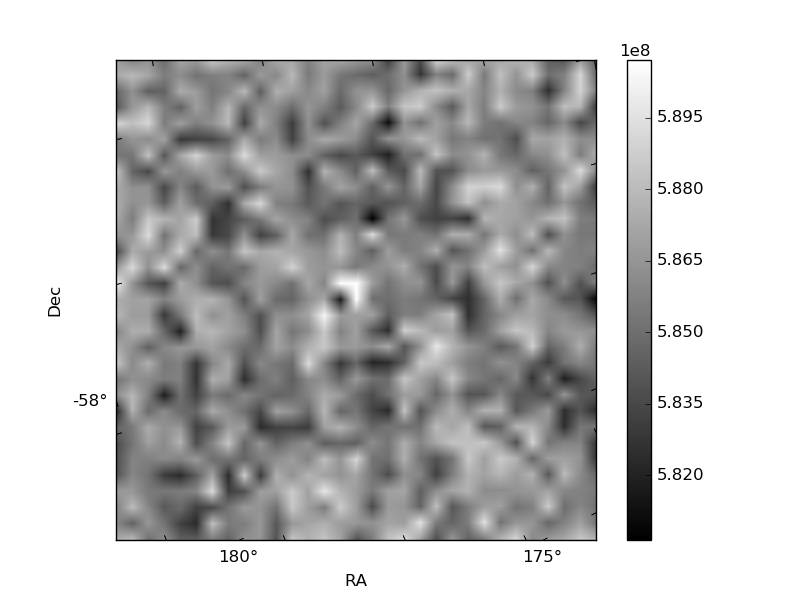
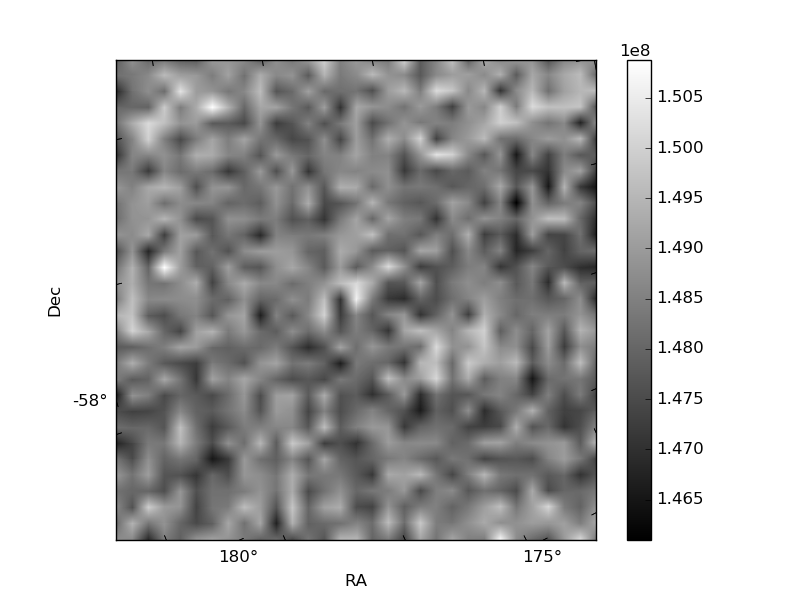
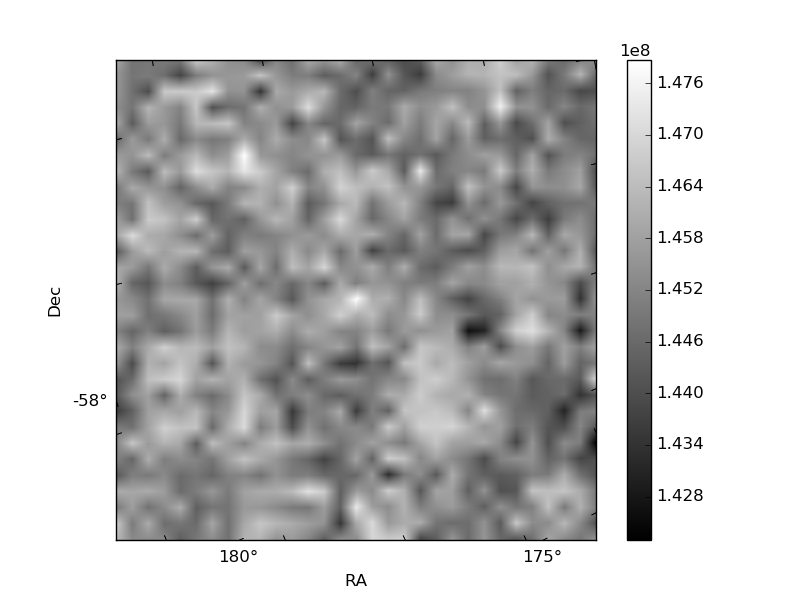
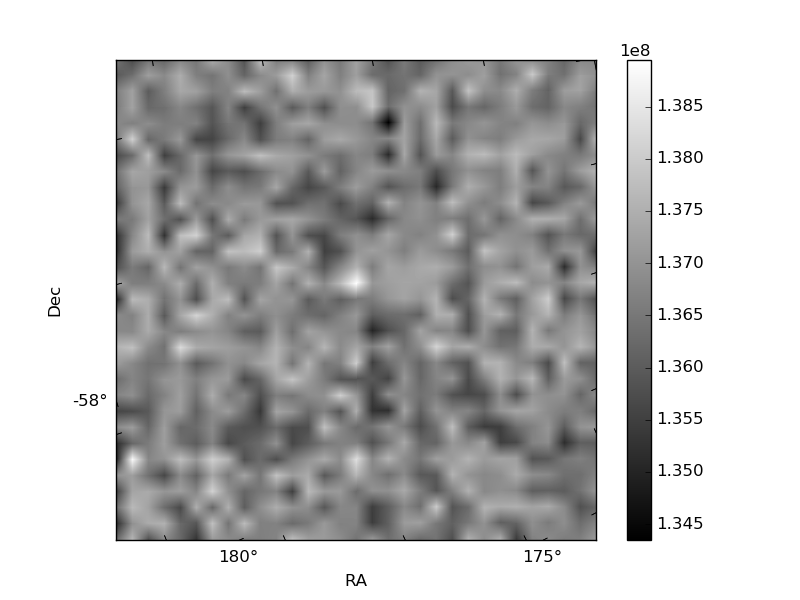
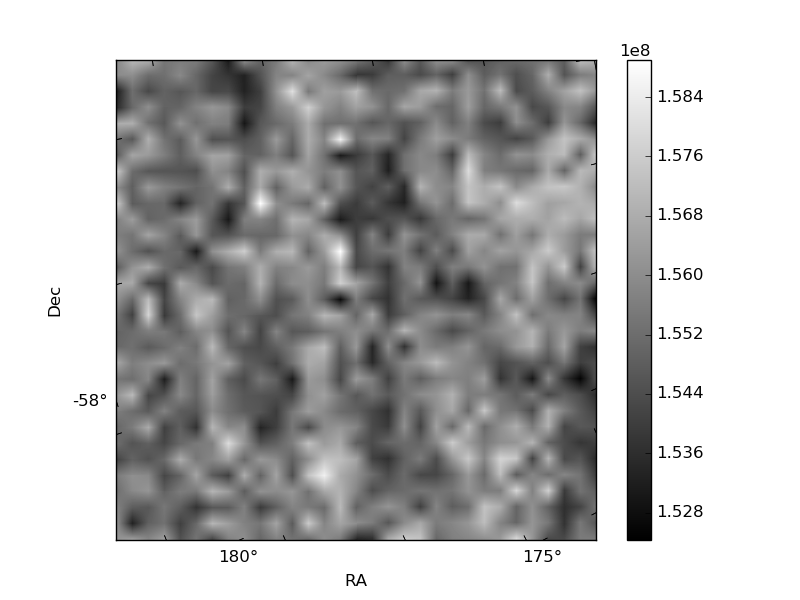
Histogram calculated using DETX and DETY for each event in the final _common_clean file
| Quadrant A | 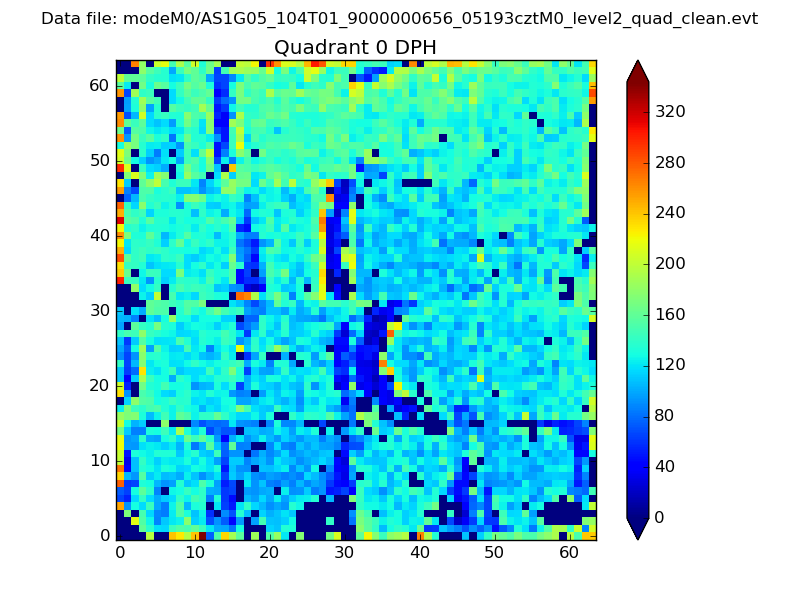 |
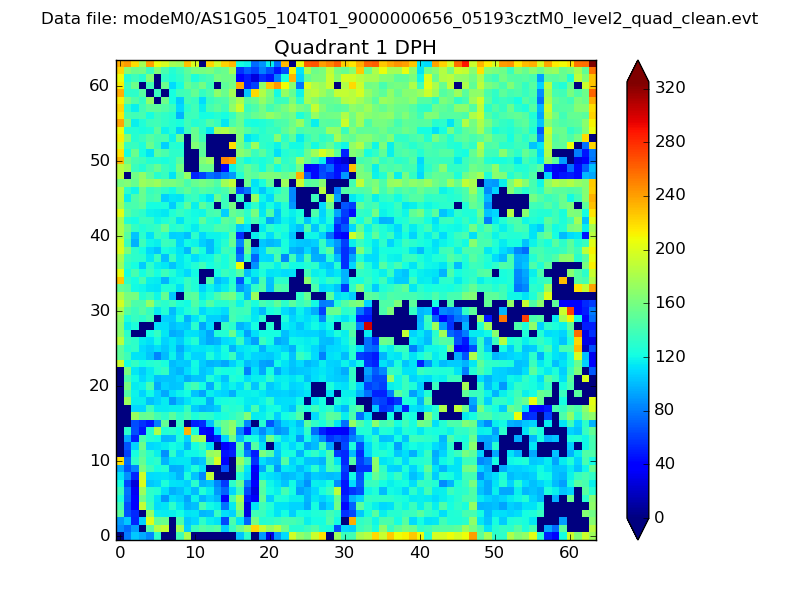 |
Quadrant B |
|---|---|---|---|
| Quadrant D | 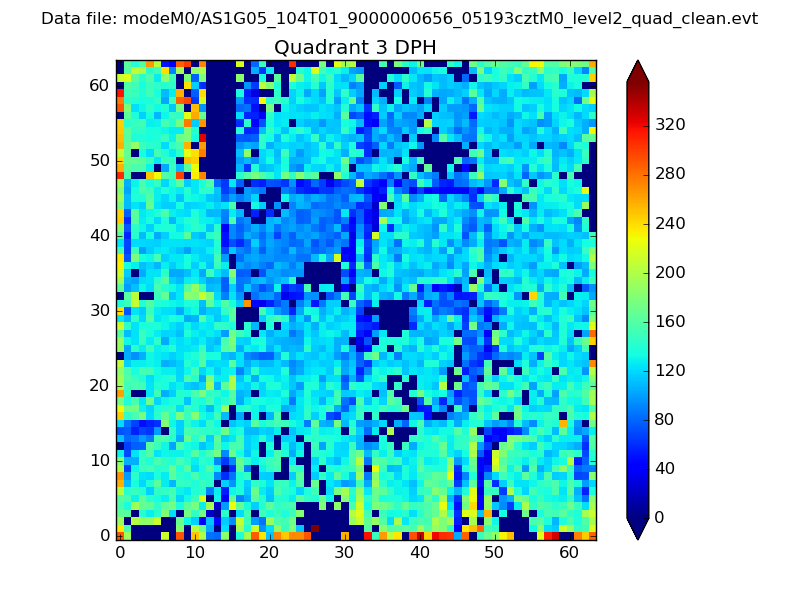 |
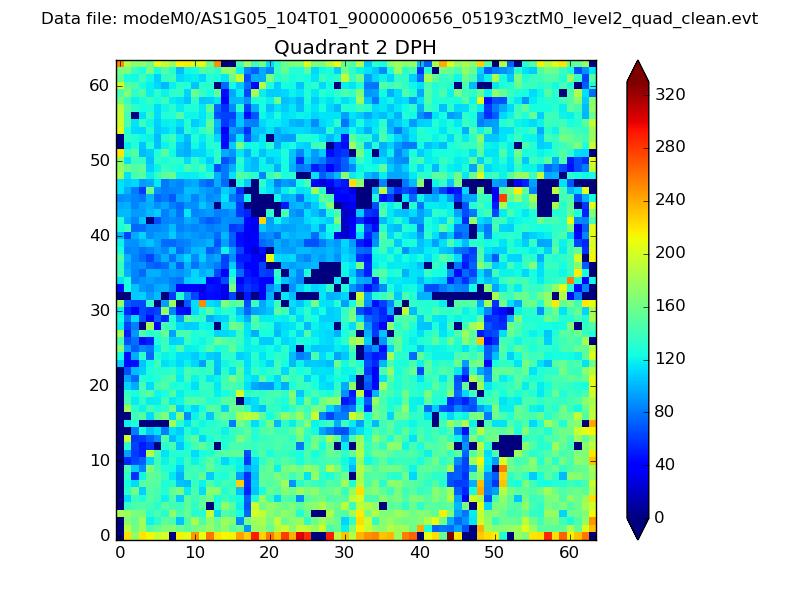 |
Quadrant C |
| Plot type | Count rate plots | Images |
|---|---|---|
| Comparison with Poisson distribution Blue bars denote a histogram of data divided into 1 sec bins. Red curve is a Poisson curve with rate = median count rate of data. |
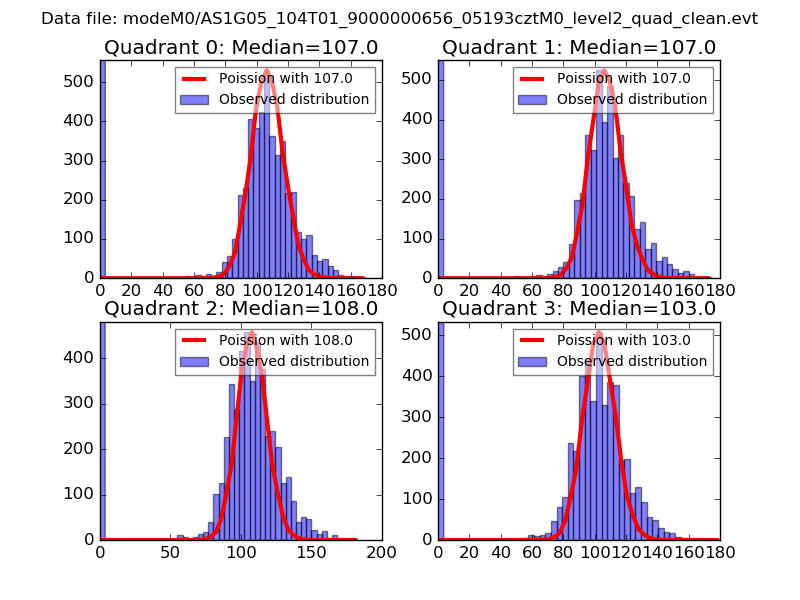 |
 |
| Quadrant-wise count rates Data is divided into 100 sec bins |
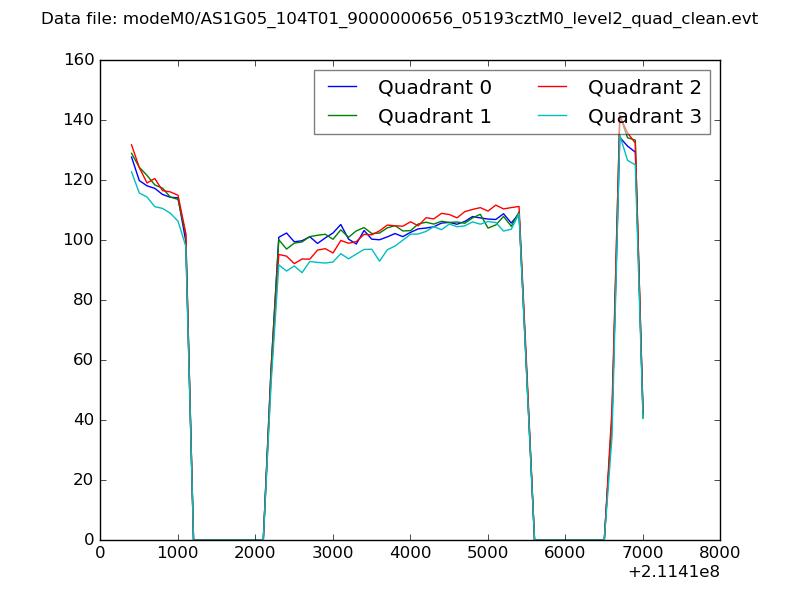 |
|
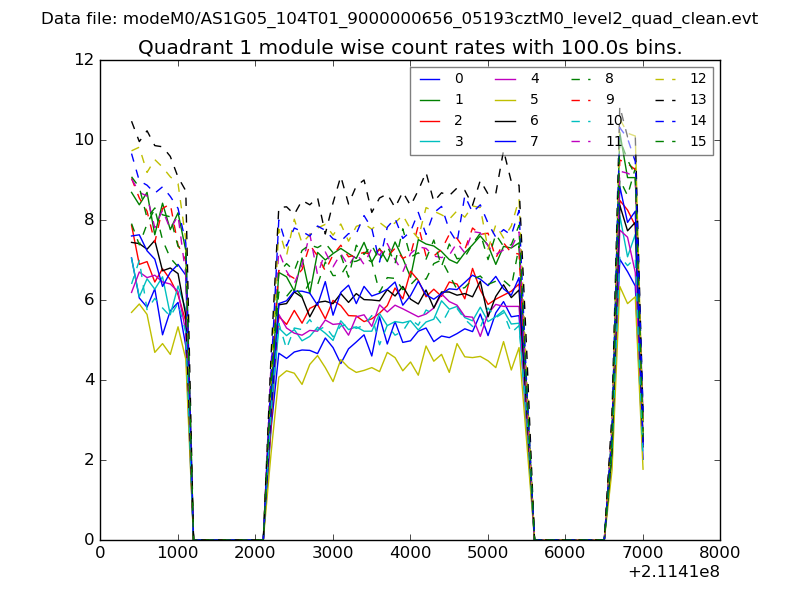
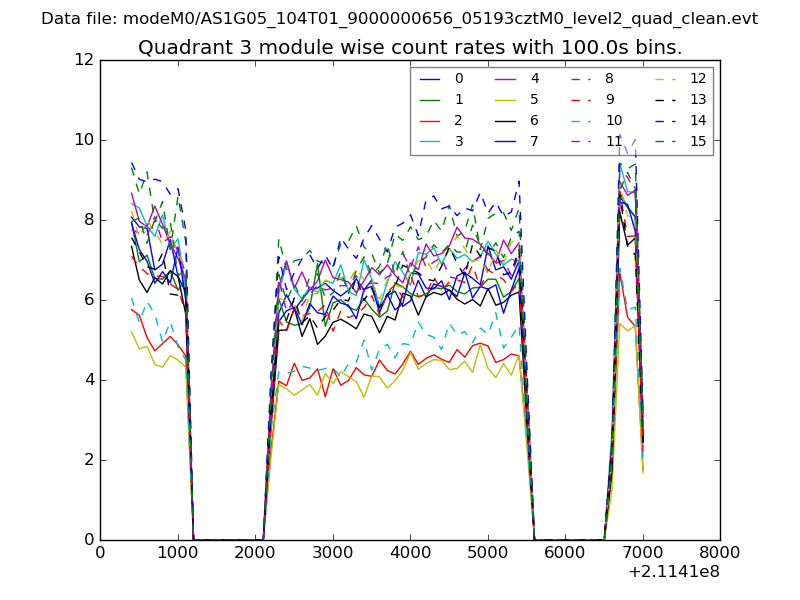
| Module-wise count rates for Quadrant A Data is divided into 100 sec bins |
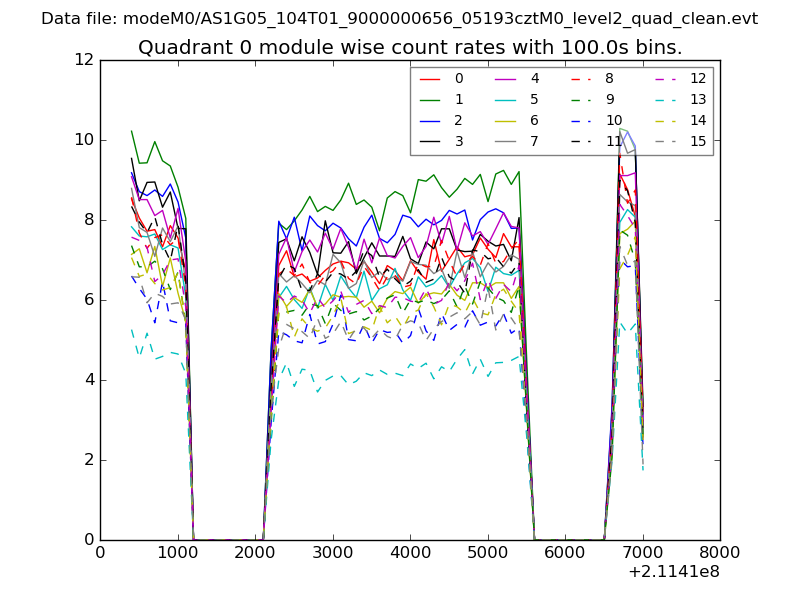 |
 |
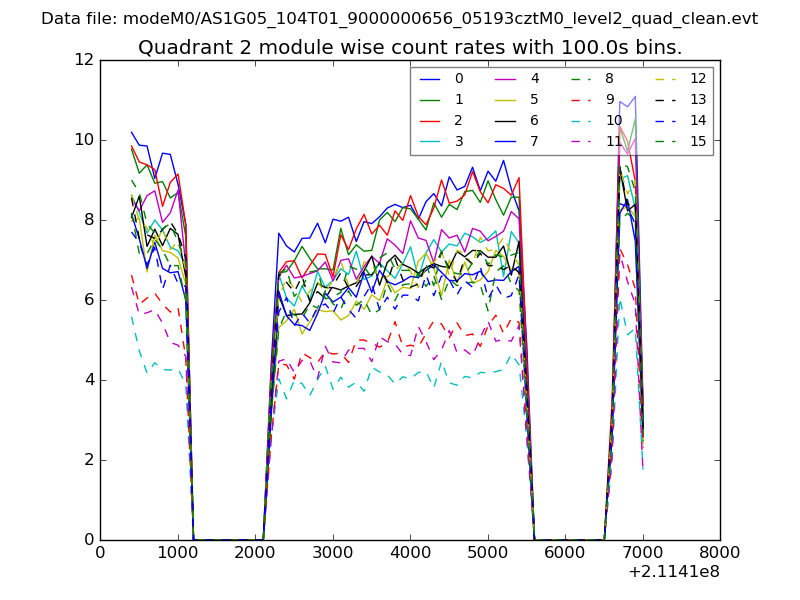
| Module-wise count rates for Quadrant B Data is divided into 100 sec bins |
 |
 |
| Module-wise count rates for Quadrant C Data is divided into 100 sec bins |
 |
 |
| Module-wise count rates for Quadrant D Data is divided into 100 sec bins |
 |
 |
| Parameter | Plot |
|---|---|
| CZT HV Monitor | 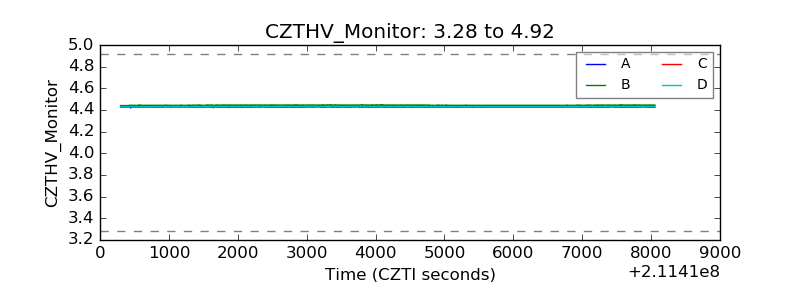 |
| D_VDD |  |
| Temperature 1 | 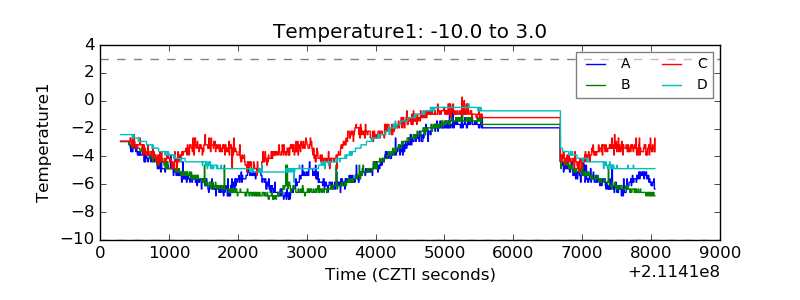 |
| Veto HV Monitor | 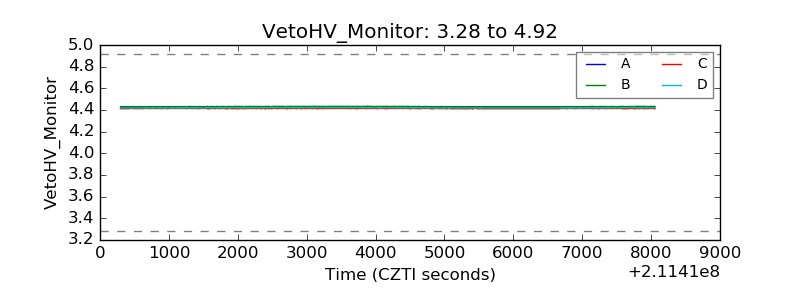 |
| Veto LLD | 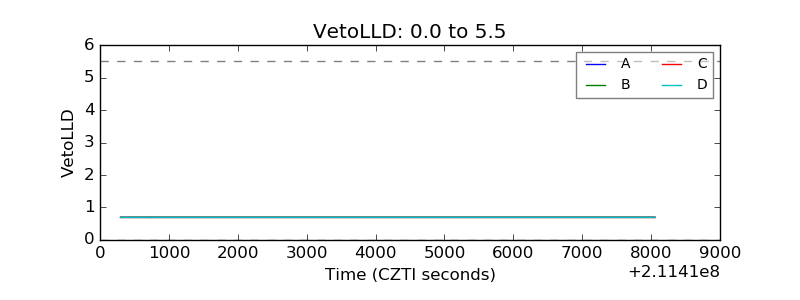 |
| Alpha Counter | 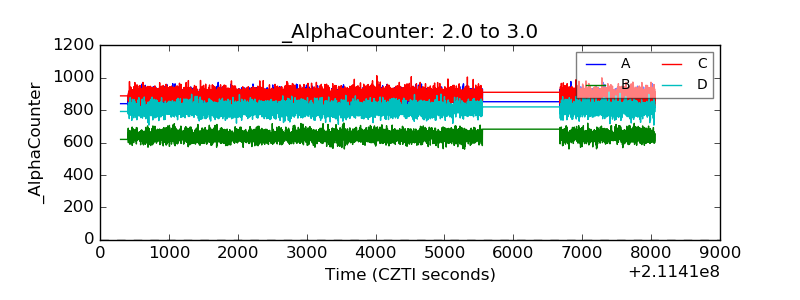 |
| _CPM_Rate | 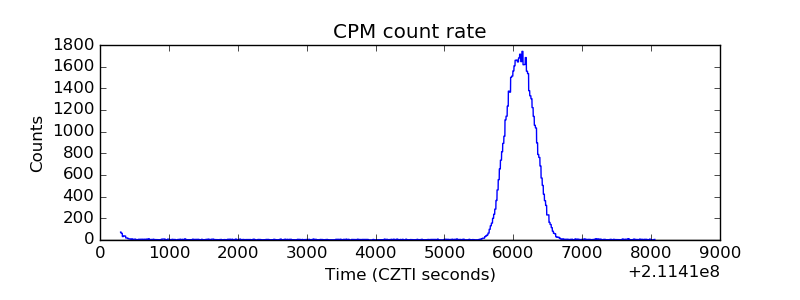 |
| CZT Counter | 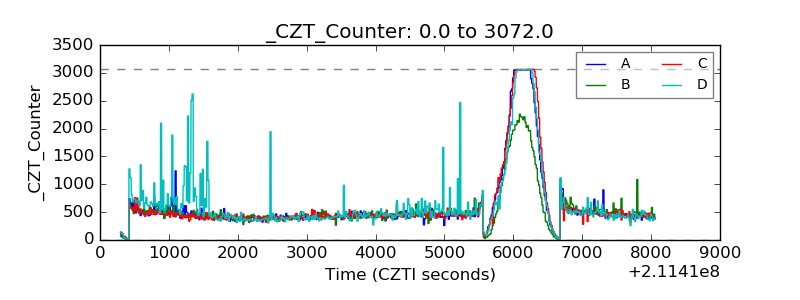 |
| +2.5 Volts monitor |  |
| +5 Volts monitor |  |
| _ROLL_ROT | 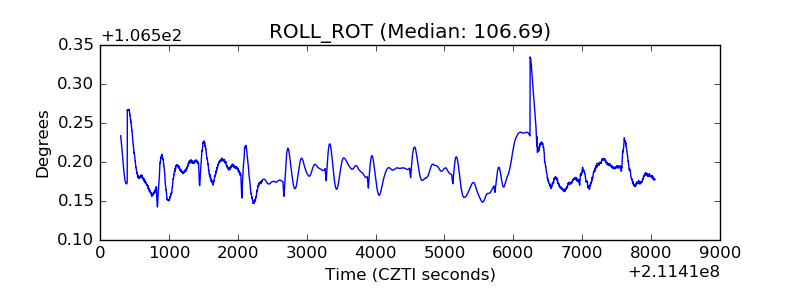 |
| _Roll_DEC | 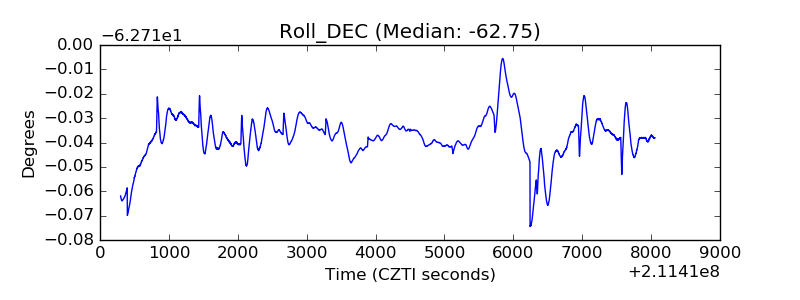 |
| _Roll_RA | 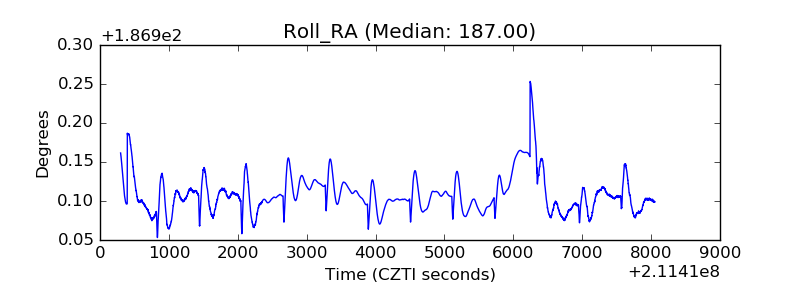 |
| Veto Counter | 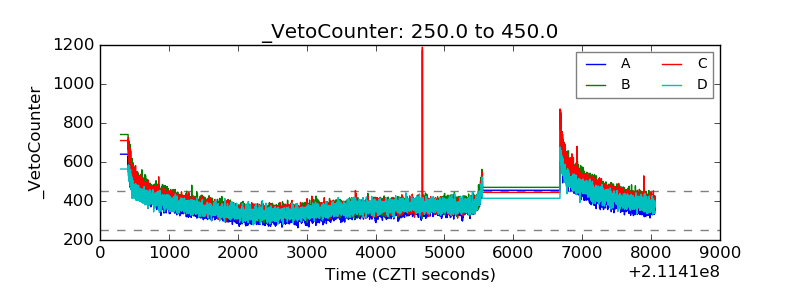 |