| Param | Original file | Final file |
|---|---|---|
| Filename | modeM0/AS1G05_104T01_9000000656_05196cztM0_level2.evt | modeM0/AS1G05_104T01_9000000656_05196cztM0_level2_quad_clean.evt |
| Size (bytes) | 435,839,040 | 95,892,480 |
| Size | 415.6 MB | 91.5 MB |
| Events in quadrant A | 3,006,548 | 620,146 |
| Events in quadrant B | 3,015,630 | 630,656 |
| Events in quadrant C | 2,978,735 | 626,427 |
| Events in quadrant D | 3,774,259 | 591,307 |
| Mode M9 | |||
|---|---|---|---|
| Quadrant | BADHDUFLAG | Total packets | Discarded packets |
| A | 0 | 16 | 0 |
| B | 0 | 16 | 0 |
| C | 0 | 16 | 0 |
| D | 0 | 17 | 0 |
| Mode SS | |||
|---|---|---|---|
| Quadrant | BADHDUFLAG | Total packets | Discarded packets |
| A | 0 | 126 | 0 |
| B | 0 | 126 | 0 |
| C | 0 | 126 | 0 |
| D | 0 | 126 | 0 |
| Mode M0 | |||
|---|---|---|---|
| Quadrant | BADHDUFLAG | Total packets | Discarded packets |
| A | 0 | 12961 | 3 |
| B | 0 | 12884 | 2 |
| C | 0 | 12819 | 2 |
| D | 0 | 15374 | 2 |
| Quadrant | Total seconds | Saturated seconds | Saturation percentage |
|---|---|---|---|
| A | 6244 | 50 | 0.800769% |
| B | 6244 | 45 | 0.720692% |
| C | 6244 | 35 | 0.560538% |
| D | 6244 | 115 | 1.841768% |
Noise dominated data is calculated using 1-second bins in cleaned event files. If a bin has >2000 counts, and if more than 50% of those come from <1% of pixels, then it is considered to be noise-dominated and hence unusable.
| Quadrant | # 1 sec bins | Bins with >0 counts | Bins with >2000 counts | High rate bins dominated by noise | Noise dominated (total time) | Noise dominated (detector-on time) | Marked lightcurve |
|---|---|---|---|---|---|---|---|
| A | 7529 | 6245 | 8 | 8 | 0.11% | 0.13% | 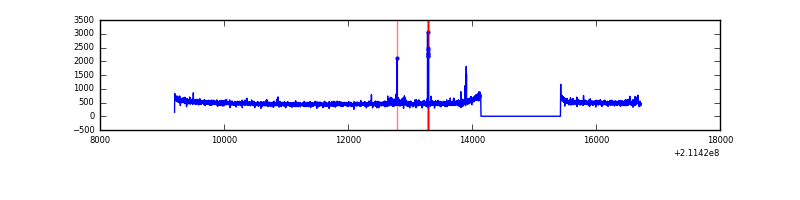 |
| B | 7529 | 6245 | 0 | 0 | 0.00% | 0.00% | 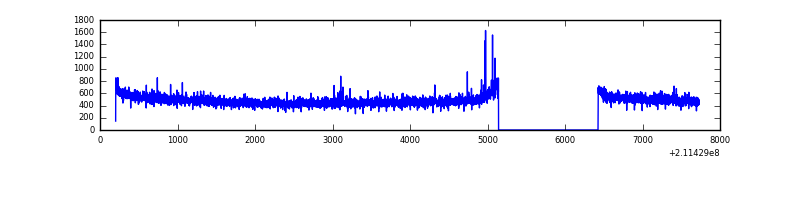 |
| C | 7529 | 6245 | 0 | 0 | 0.00% | 0.00% | 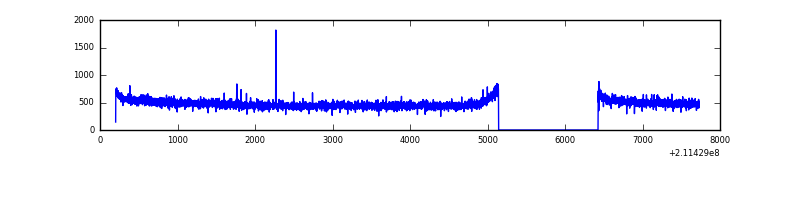 |
| D | 7529 | 6245 | 94 | 94 | 1.25% | 1.51% | 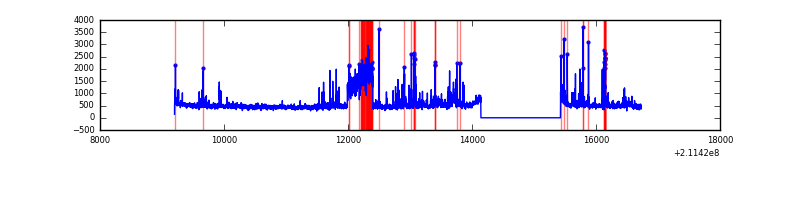 |
Top three noisy pixels from each quadrant. If the there are fewer than three noisy pixels in the level2.evt file, extra rows are filled as -1
| Pixel properties | Quadrant properties | ||||||
|---|---|---|---|---|---|---|---|
| Quadrant | DetID | PixID | Counts | Sigma | Mean | Median | Sigma |
| A | 0 | 50 | 45104 | 291.87 | 759 | 743 | 152.0 |
| A | 0 | 247 | 19641 | 124.34 | 759 | 743 | 152.0 |
| A | 4 | 2 | 12203 | 75.4 | 759 | 743 | 152.0 |
| B | 0 | 219 | 12430 | 81.89 | 769 | 752 | 142.6 |
| B | 12 | 111 | 12372 | 81.49 | 769 | 752 | 142.6 |
| B | 4 | 80 | 12274 | 80.8 | 769 | 752 | 142.6 |
| C | 1 | 16 | 32587 | 187.82 | 749 | 752 | 169.5 |
| C | 14 | 67 | 16391 | 92.27 | 749 | 752 | 169.5 |
| C | 12 | 4 | 7443 | 39.48 | 749 | 752 | 169.5 |
| D | 7 | 237 | 454838 | 2547.71 | 741 | 720 | 178.2 |
| D | 2 | 63 | 239447 | 1339.31 | 741 | 720 | 178.2 |
| D | 2 | 136 | 102578 | 571.45 | 741 | 720 | 178.2 |
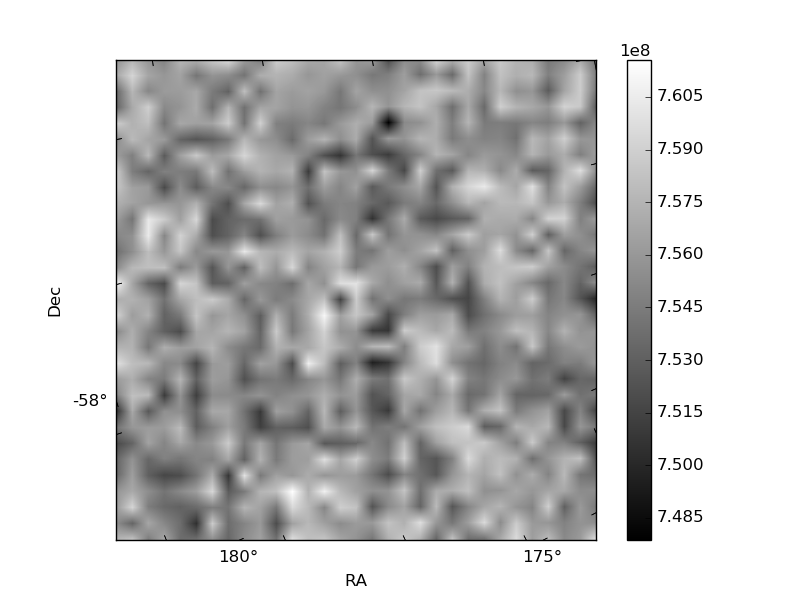
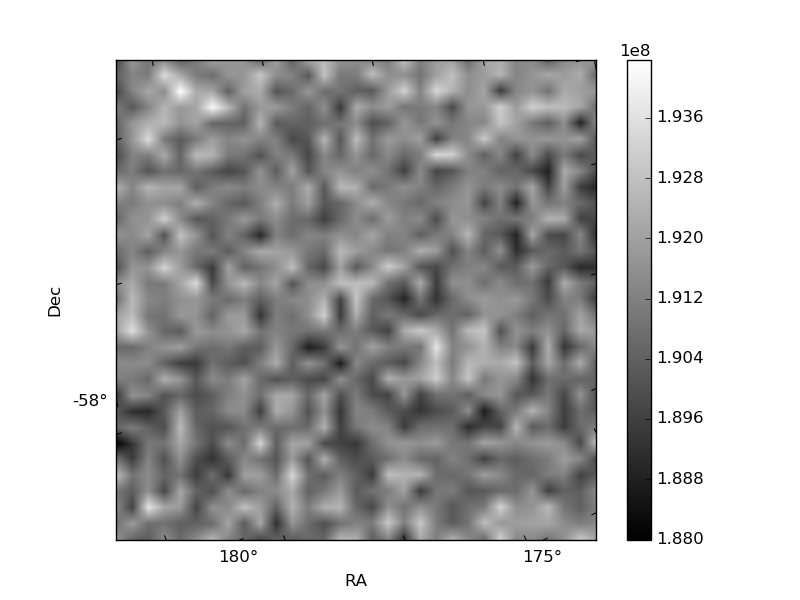
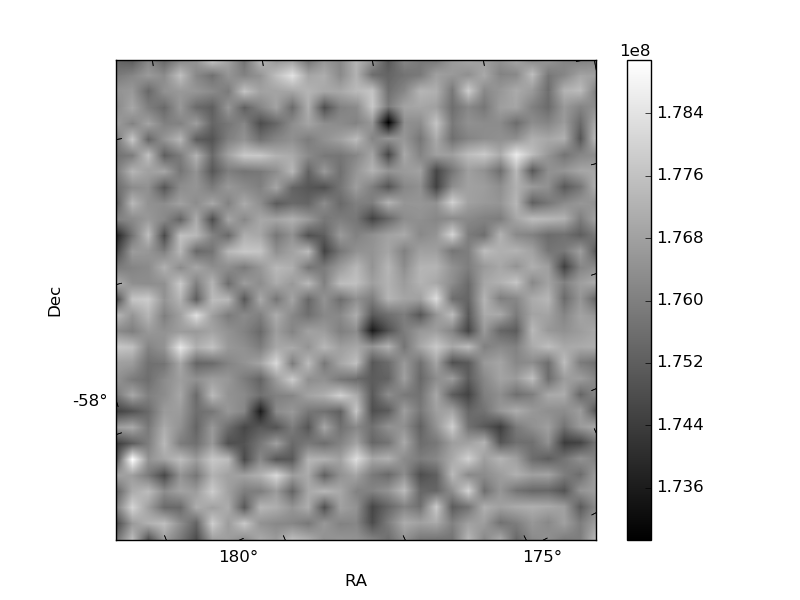
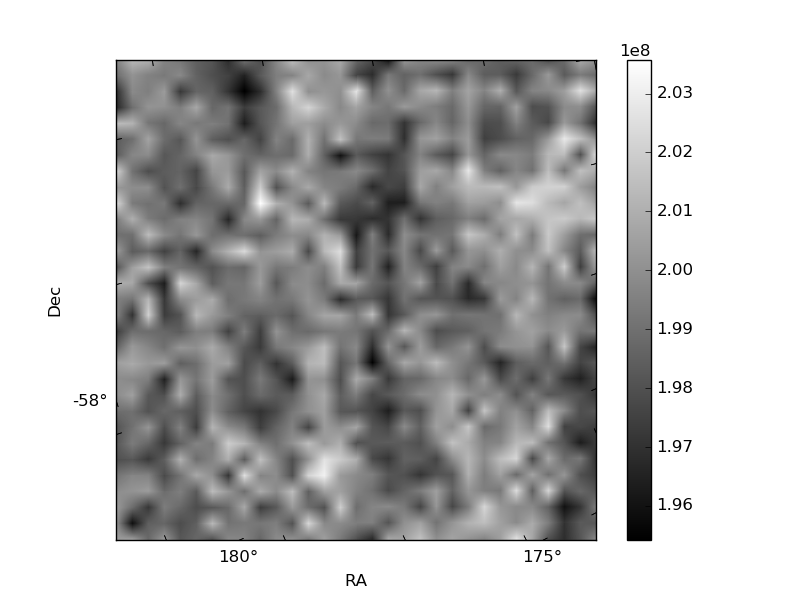
Histogram calculated using DETX and DETY for each event in the final _common_clean file
| Quadrant A | 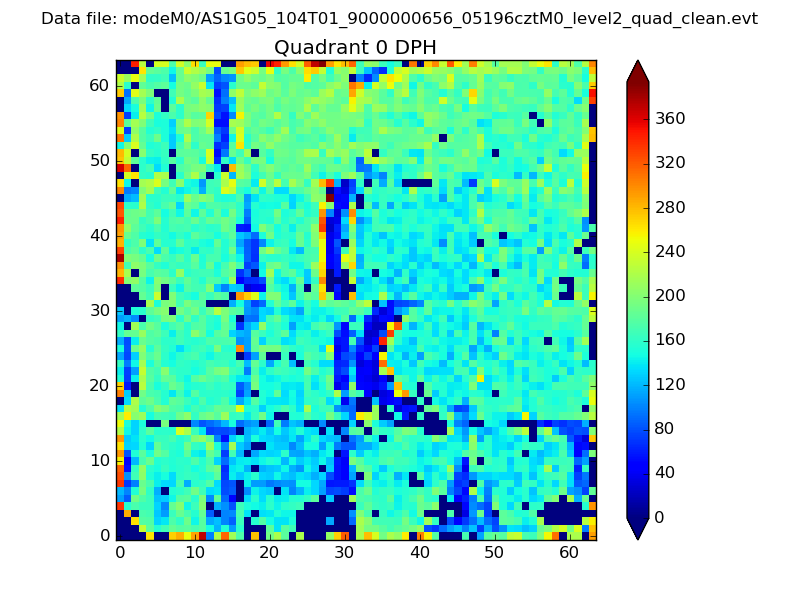 |
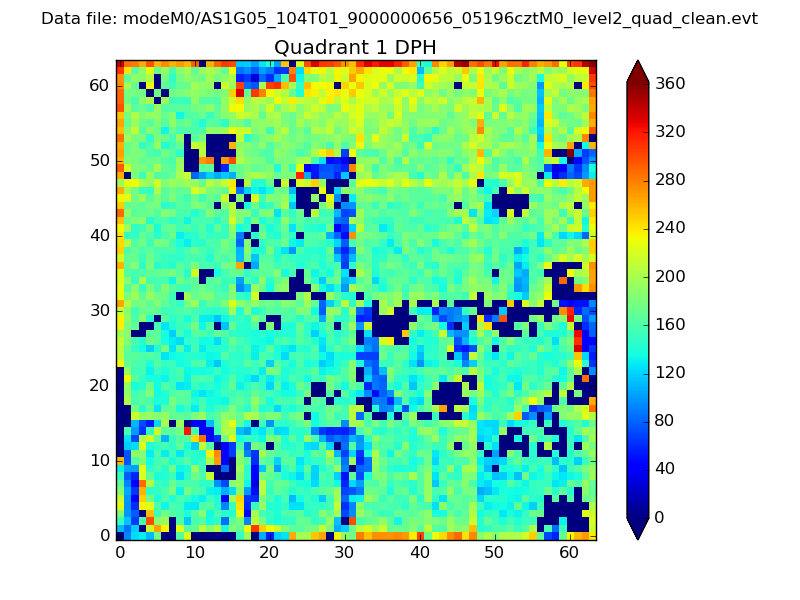 |
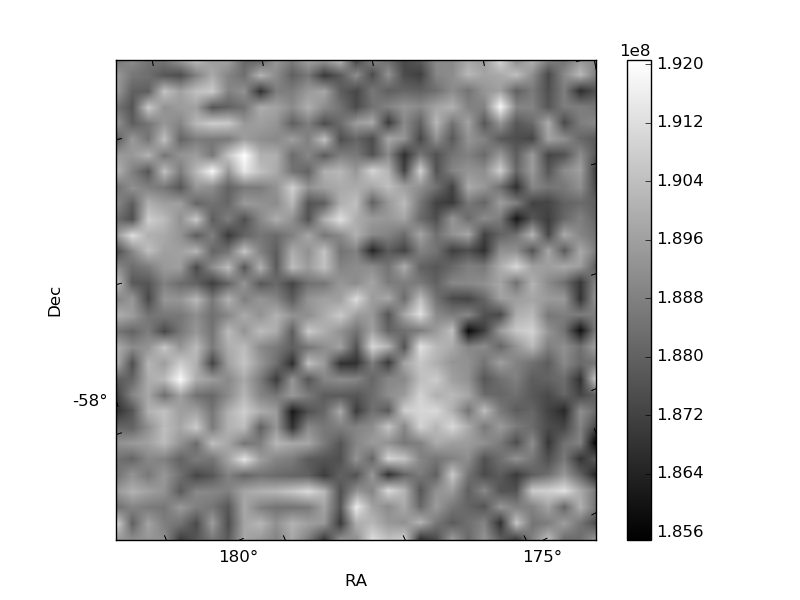
Quadrant B |
|---|---|---|---|
| Quadrant D | 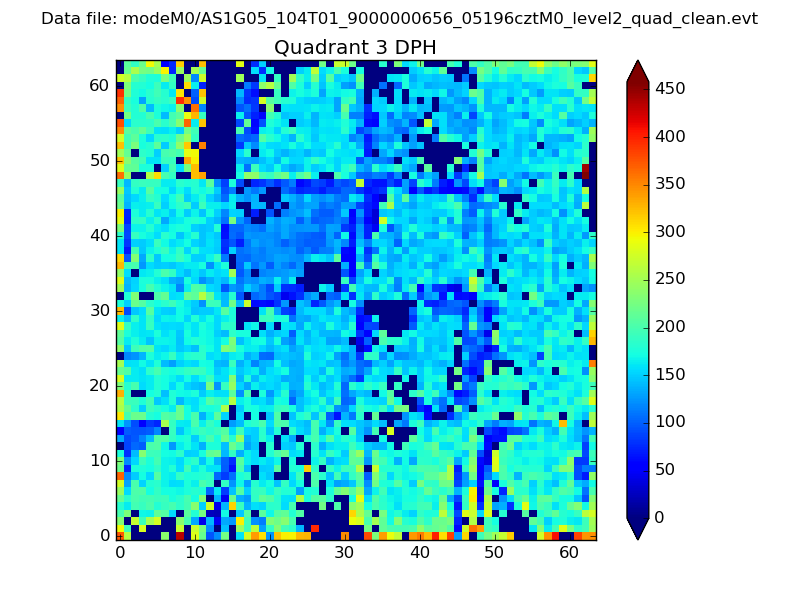 |
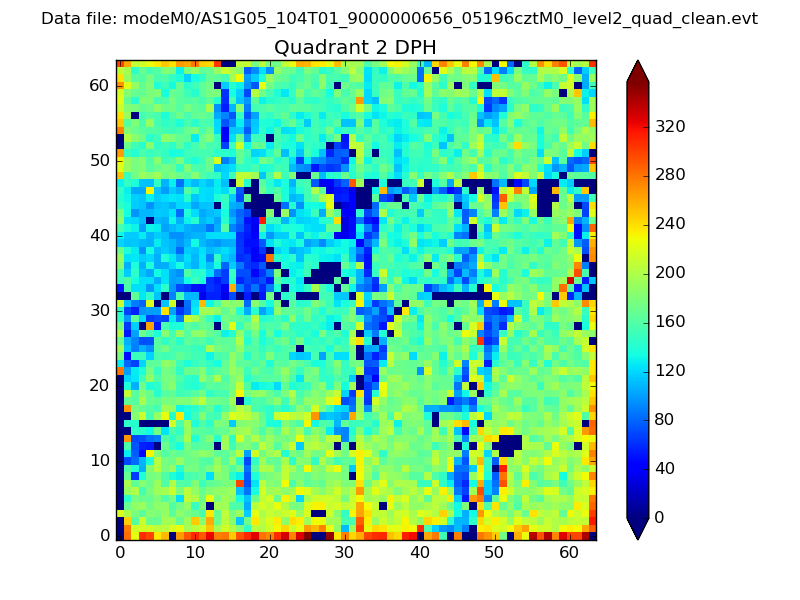 |
Quadrant C |
| Plot type | Count rate plots | Images |
|---|---|---|
| Comparison with Poisson distribution Blue bars denote a histogram of data divided into 1 sec bins. Red curve is a Poisson curve with rate = median count rate of data. |
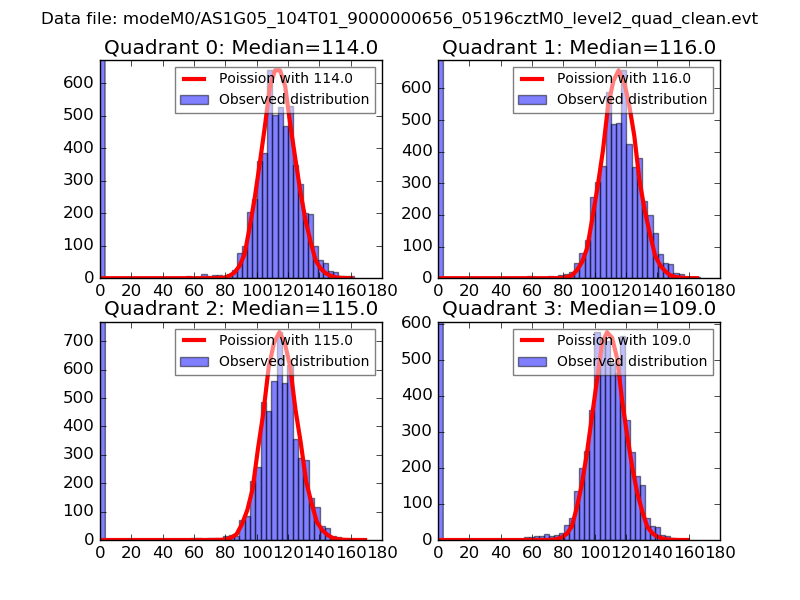 |
 |
| Quadrant-wise count rates Data is divided into 100 sec bins |
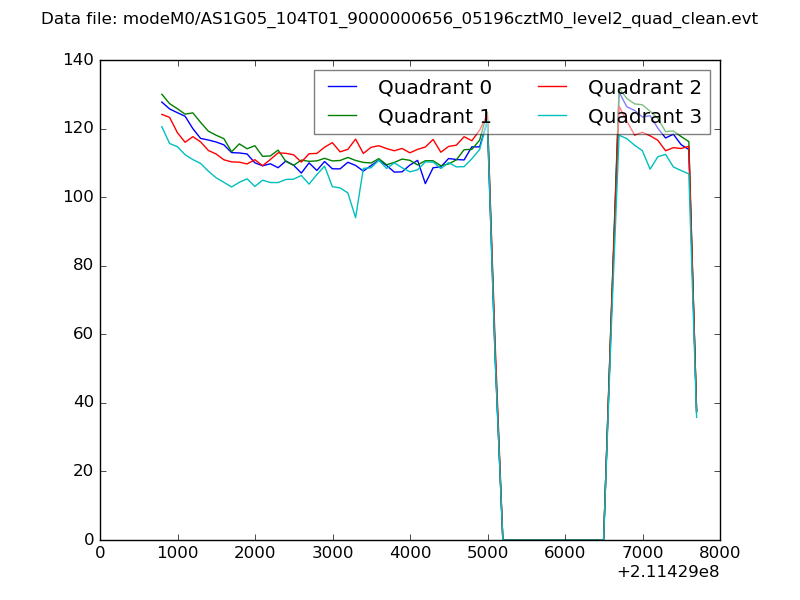 |
|
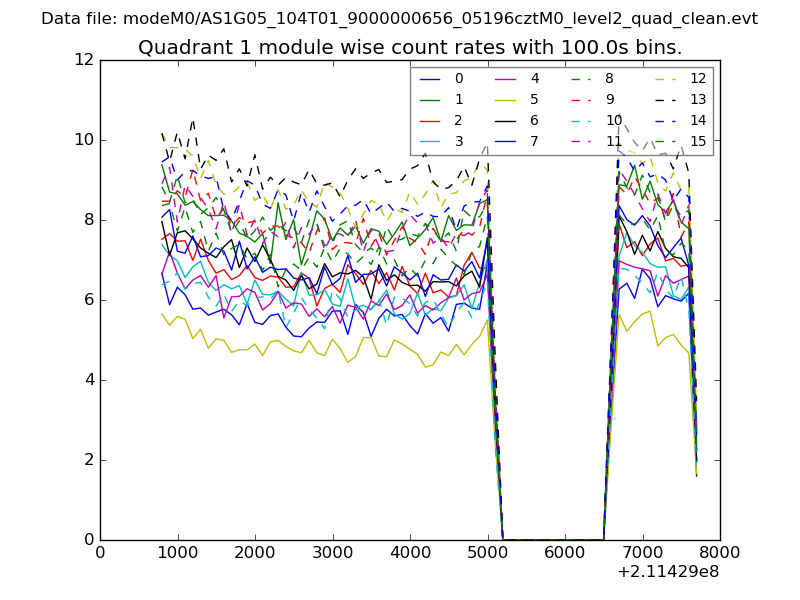
| Module-wise count rates for Quadrant A Data is divided into 100 sec bins |
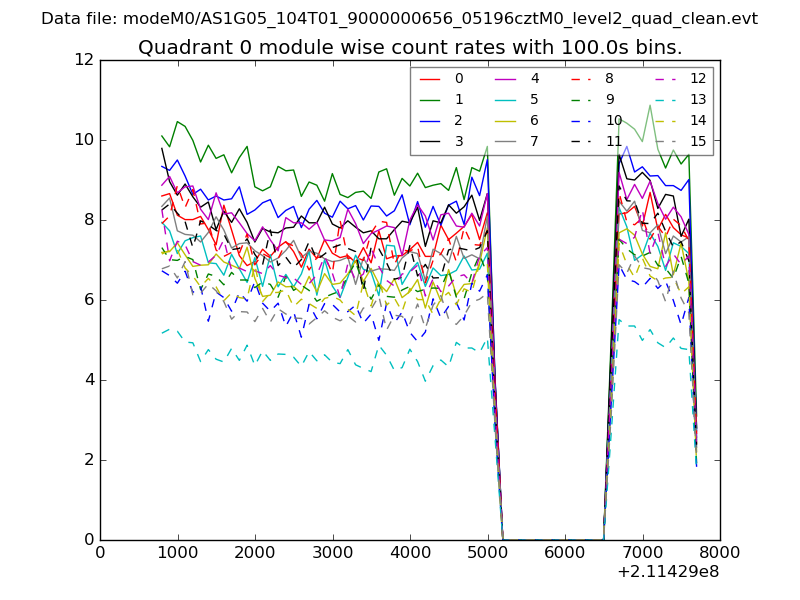 |
 |
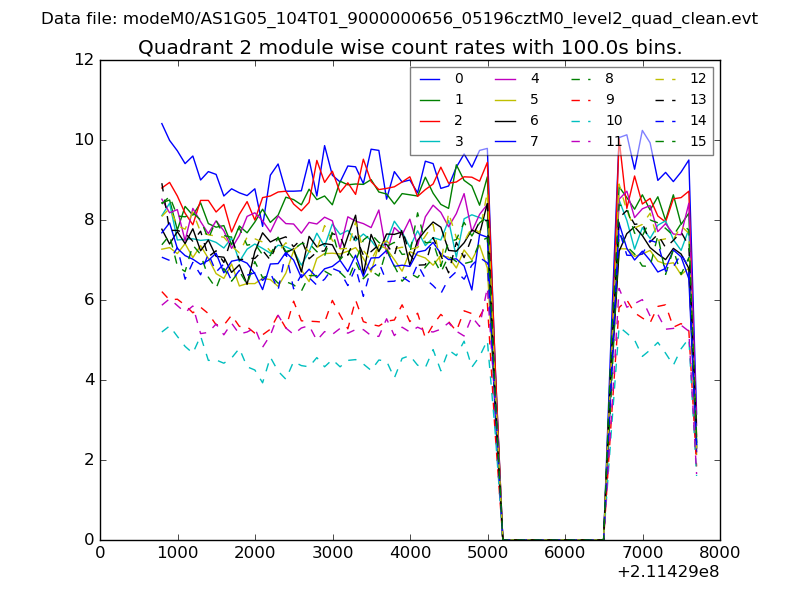
| Module-wise count rates for Quadrant B Data is divided into 100 sec bins |
 |
 |
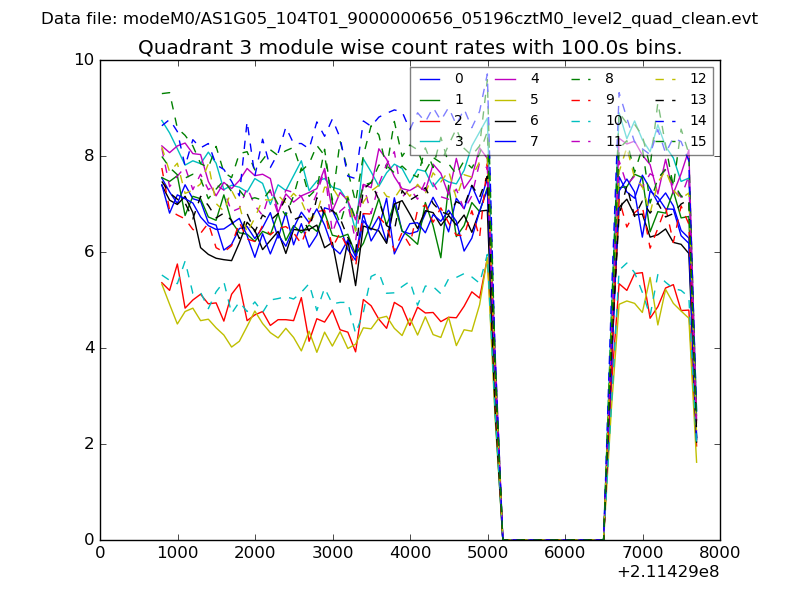
| Module-wise count rates for Quadrant C Data is divided into 100 sec bins |
 |
 |
| Module-wise count rates for Quadrant D Data is divided into 100 sec bins |
 |
 |
| Parameter | Plot |
|---|---|
| CZT HV Monitor | 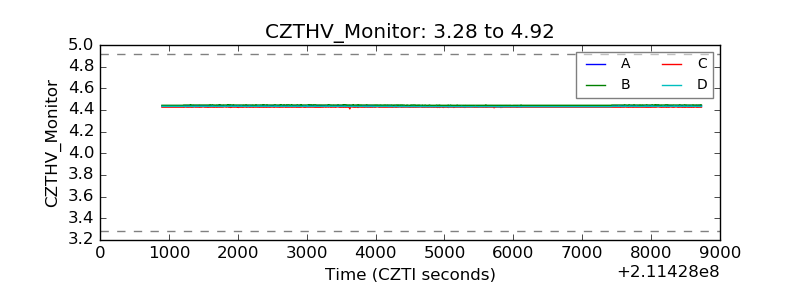 |
| D_VDD | 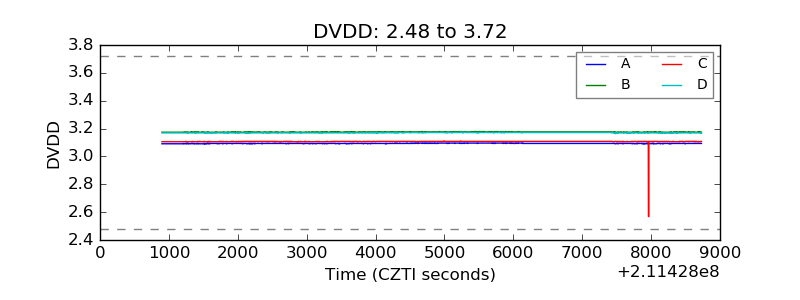 |
| Temperature 1 | 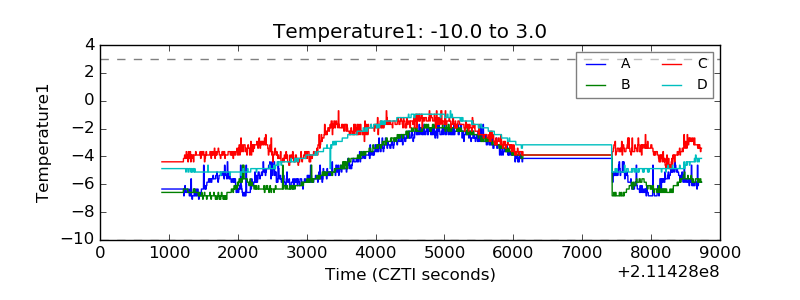 |
| Veto HV Monitor | 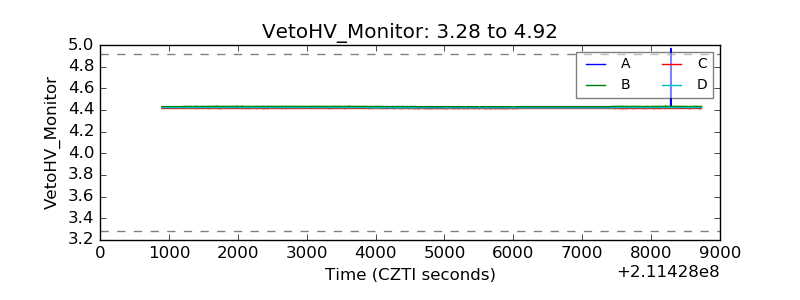 |
| Veto LLD | 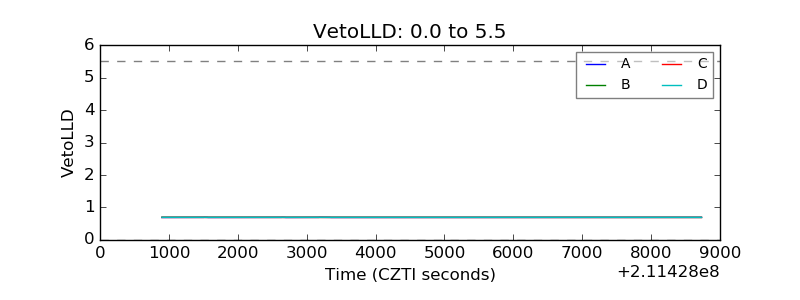 |
| Alpha Counter |  |
| _CPM_Rate | 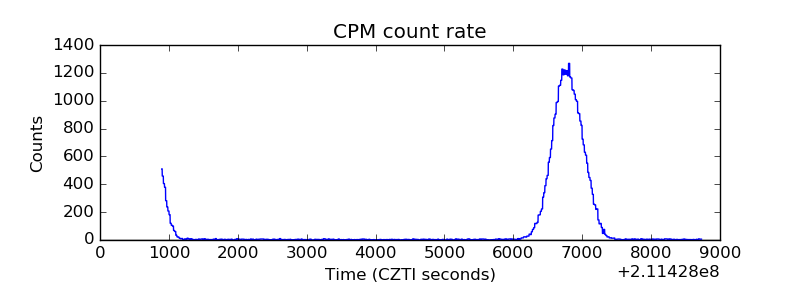 |
| CZT Counter | 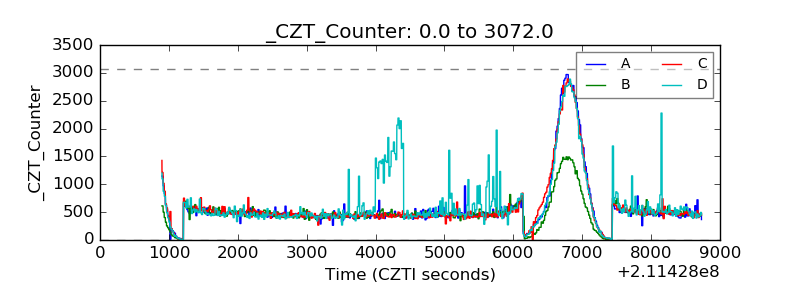 |
| +2.5 Volts monitor |  |
| +5 Volts monitor |  |
| _ROLL_ROT | 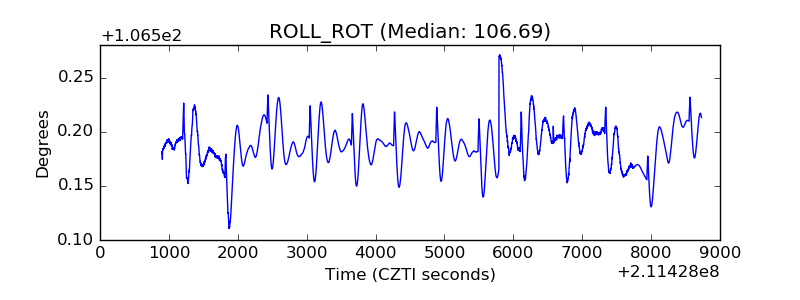 |
| _Roll_DEC | 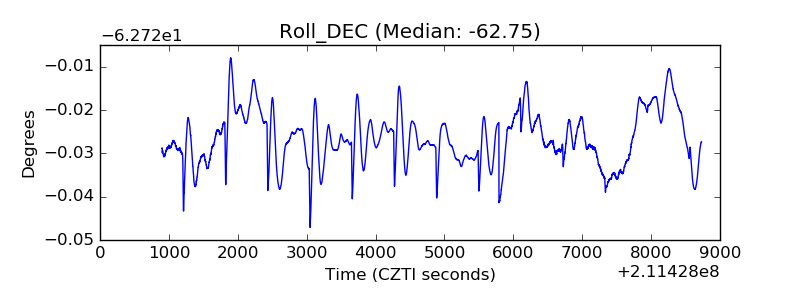 |
| _Roll_RA | 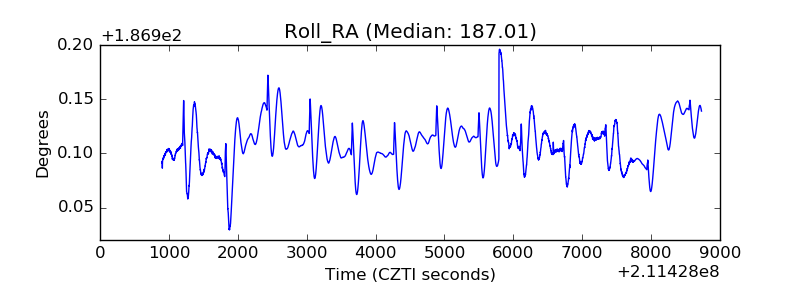 |
| Veto Counter | 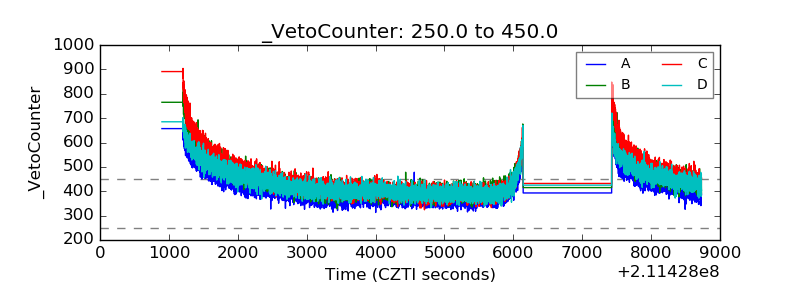 |