| Param | Original file | Final file |
|---|---|---|
| Filename | modeM0/AS1G05_104T01_9000000656_05197cztM0_level2.evt | modeM0/AS1G05_104T01_9000000656_05197cztM0_level2_quad_clean.evt |
| Size (bytes) | 436,613,760 | 105,785,280 |
| Size | 416.4 MB | 100.9 MB |
| Events in quadrant A | 3,118,051 | 694,284 |
| Events in quadrant B | 3,018,447 | 705,051 |
| Events in quadrant C | 2,892,568 | 705,435 |
| Events in quadrant D | 3,767,971 | 661,874 |
| Mode M9 | |||
|---|---|---|---|
| Quadrant | BADHDUFLAG | Total packets | Discarded packets |
| A | 0 | 12 | 0 |
| B | 0 | 12 | 0 |
| C | 0 | 12 | 0 |
| D | 0 | 12 | 0 |
| Mode SS | |||
|---|---|---|---|
| Quadrant | BADHDUFLAG | Total packets | Discarded packets |
| A | 0 | 126 | 0 |
| B | 0 | 126 | 0 |
| C | 0 | 126 | 0 |
| D | 0 | 126 | 0 |
| Mode M0 | |||
|---|---|---|---|
| Quadrant | BADHDUFLAG | Total packets | Discarded packets |
| A | 0 | 13452 | 2 |
| B | 0 | 13005 | 1 |
| C | 0 | 12759 | 1 |
| D | 0 | 15451 | 1 |
| Quadrant | Total seconds | Saturated seconds | Saturation percentage |
|---|---|---|---|
| A | 6269 | 84 | 1.339927% |
| B | 6269 | 68 | 1.084703% |
| C | 6269 | 46 | 0.733769% |
| D | 6269 | 215 | 3.429574% |
Noise dominated data is calculated using 1-second bins in cleaned event files. If a bin has >2000 counts, and if more than 50% of those come from <1% of pixels, then it is considered to be noise-dominated and hence unusable.
| Quadrant | # 1 sec bins | Bins with >0 counts | Bins with >2000 counts | High rate bins dominated by noise | Noise dominated (total time) | Noise dominated (detector-on time) | Marked lightcurve |
|---|---|---|---|---|---|---|---|
| A | 7450 | 6270 | 9 | 9 | 0.12% | 0.14% | 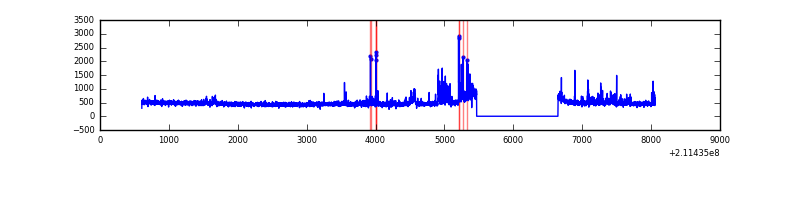 |
| B | 7450 | 6270 | 4 | 4 | 0.05% | 0.06% | 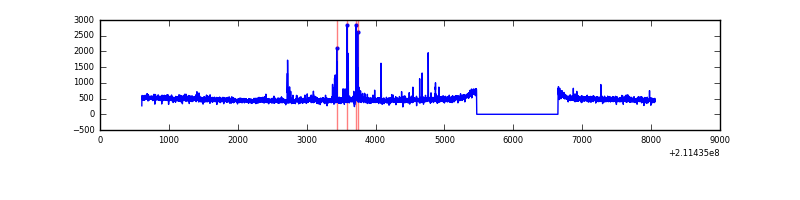 |
| C | 7450 | 6270 | 0 | 0 | 0.00% | 0.00% | 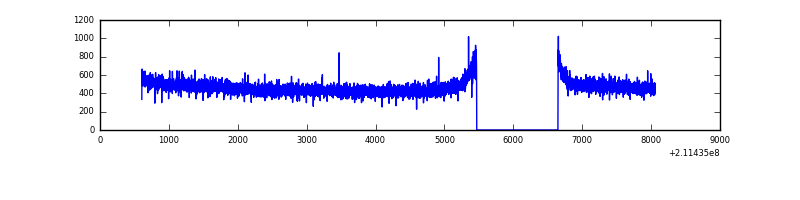 |
| D | 7450 | 6270 | 126 | 126 | 1.69% | 2.01% | 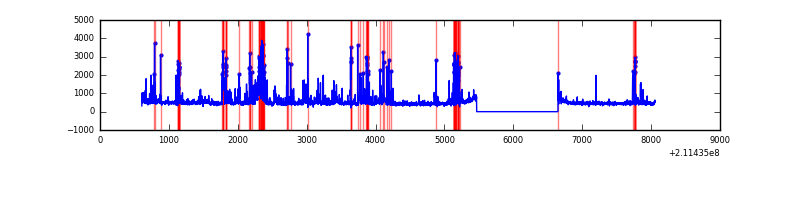 |
Top three noisy pixels from each quadrant. If the there are fewer than three noisy pixels in the level2.evt file, extra rows are filled as -1
| Pixel properties | Quadrant properties | ||||||
|---|---|---|---|---|---|---|---|
| Quadrant | DetID | PixID | Counts | Sigma | Mean | Median | Sigma |
| A | 4 | 2 | 202213 | 1337.5 | 746 | 732 | 150.6 |
| A | 0 | 50 | 30182 | 195.5 | 746 | 732 | 150.6 |
| A | 0 | 247 | 14437 | 90.98 | 746 | 732 | 150.6 |
| B | 15 | 54 | 58846 | 415.58 | 751 | 735 | 139.8 |
| B | 5 | 70 | 17160 | 117.46 | 751 | 735 | 139.8 |
| B | 4 | 80 | 14719 | 100.01 | 751 | 735 | 139.8 |
| C | 1 | 16 | 16273 | 92.11 | 736 | 740 | 168.6 |
| C | 13 | 61 | 5881 | 30.49 | 736 | 740 | 168.6 |
| C | 14 | 67 | 5811 | 30.07 | 736 | 740 | 168.6 |
| D | 2 | 63 | 184827 | 1040.25 | 726 | 705 | 177.0 |
| D | 1 | 31 | 176970 | 995.86 | 726 | 705 | 177.0 |
| D | 2 | 33 | 157004 | 883.06 | 726 | 705 | 177.0 |
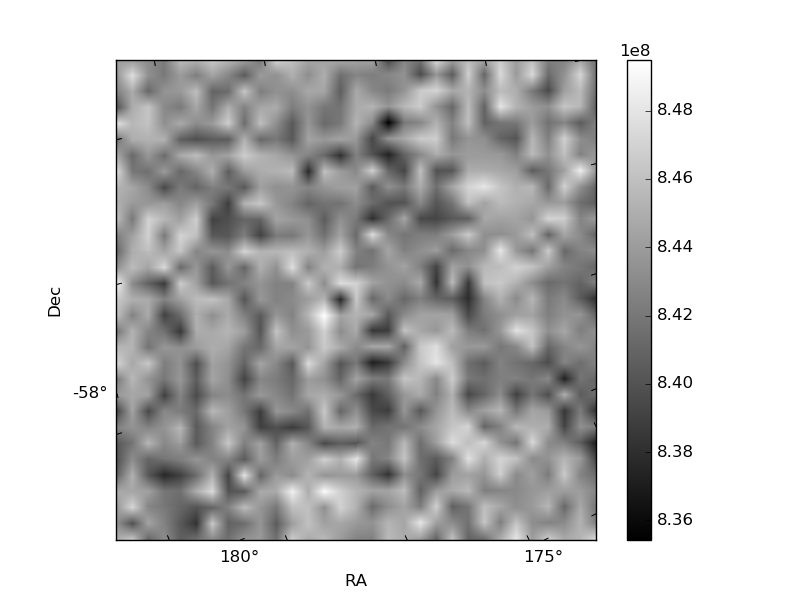
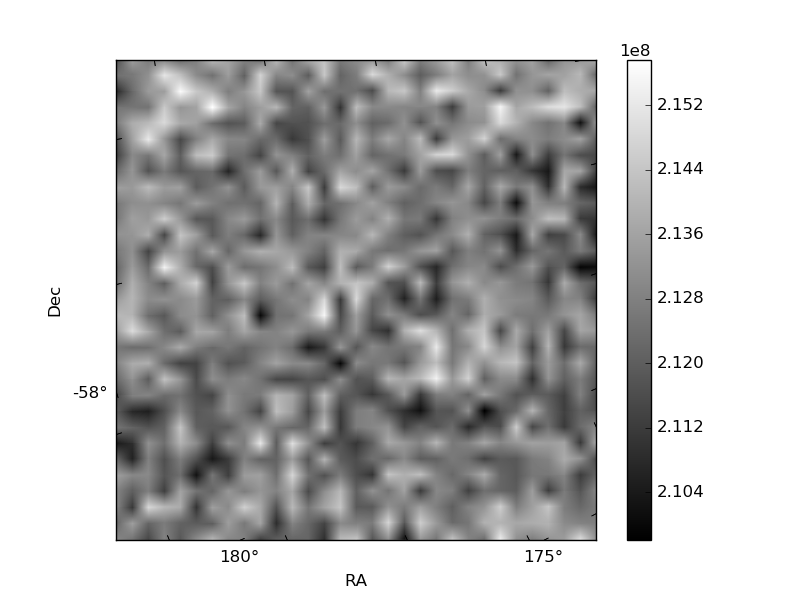
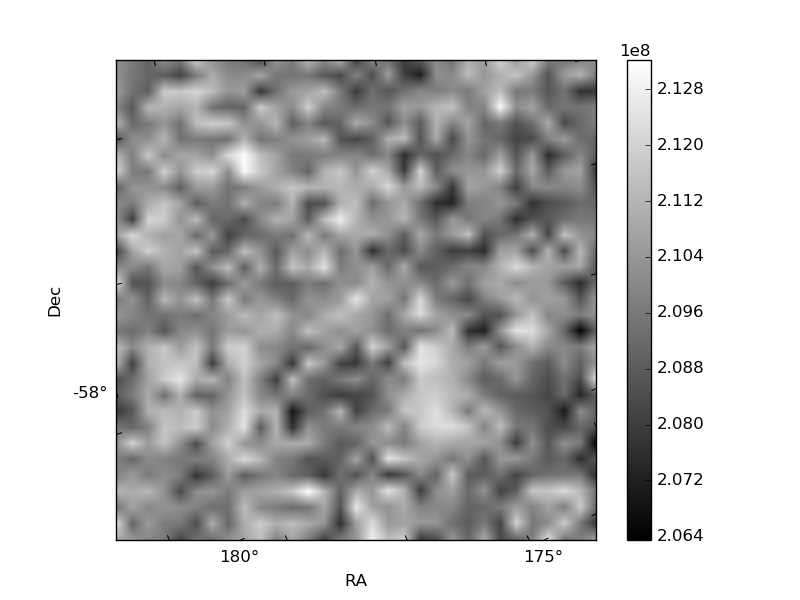
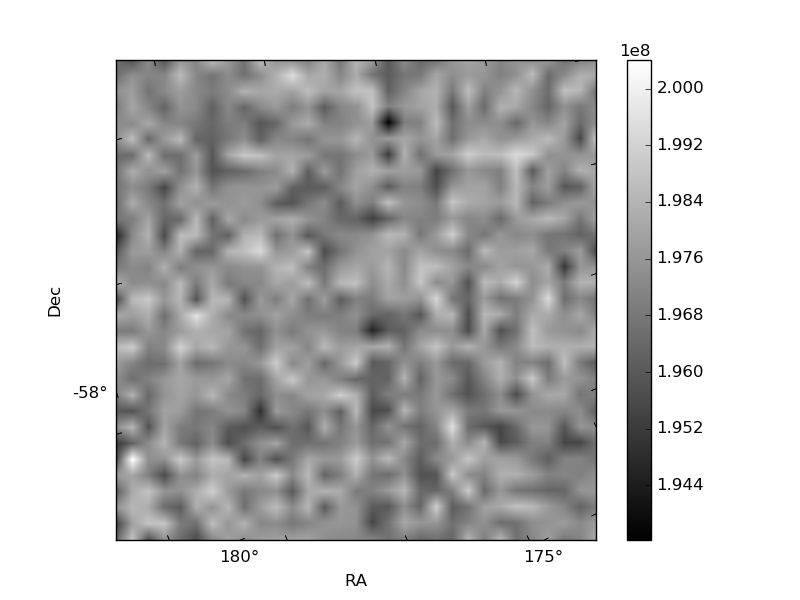
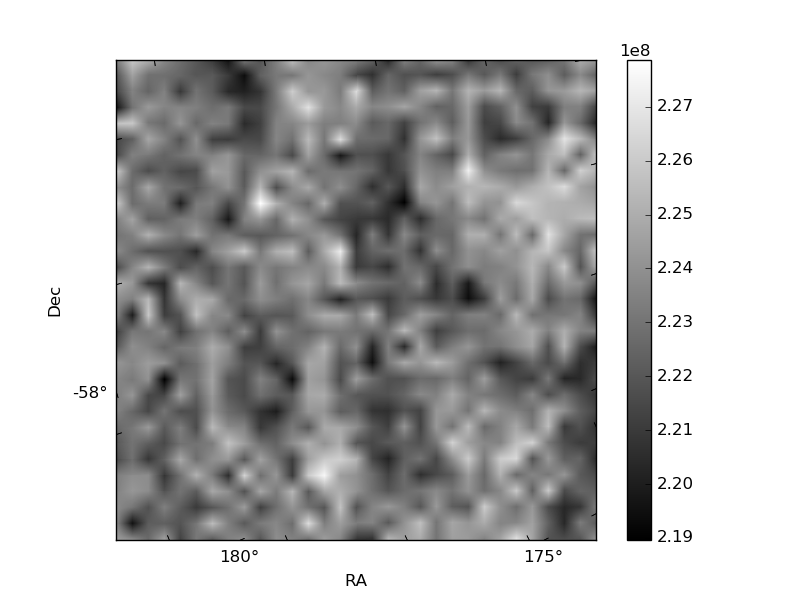
Histogram calculated using DETX and DETY for each event in the final _common_clean file
| Quadrant A | 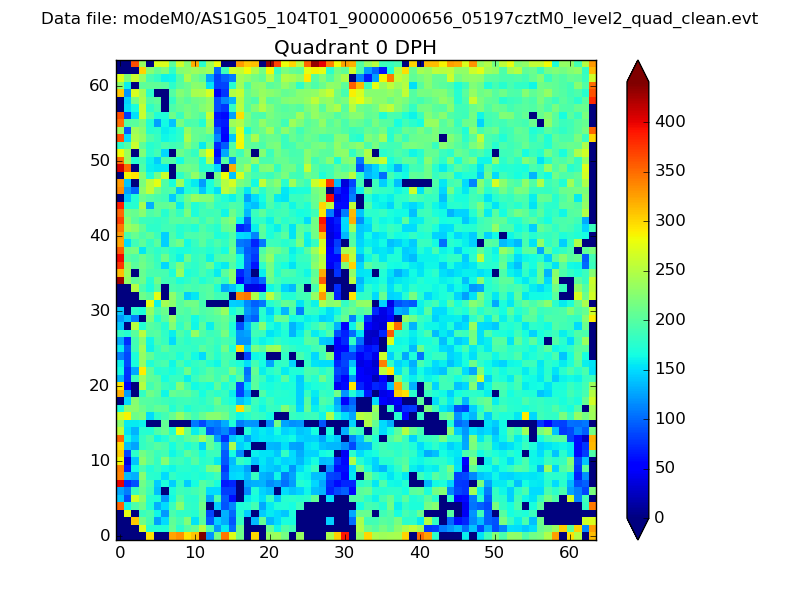 |
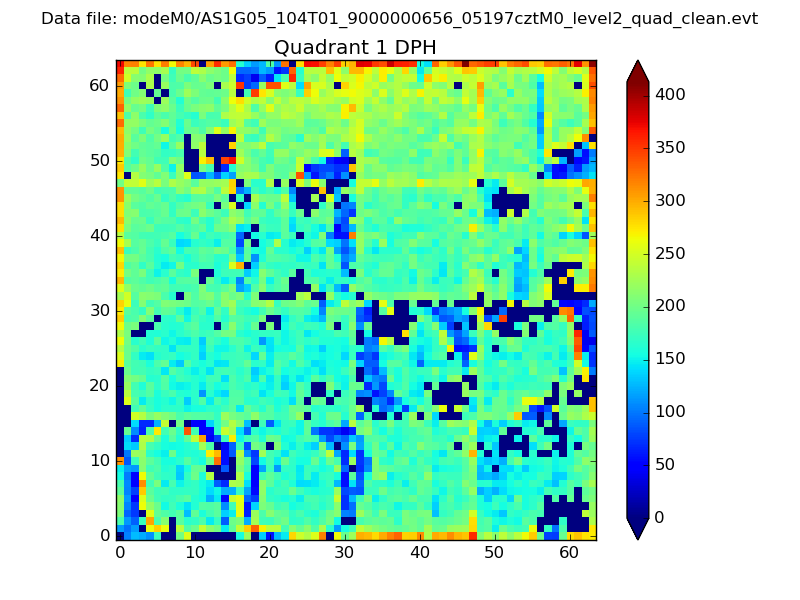 |
Quadrant B |
|---|---|---|---|
| Quadrant D | 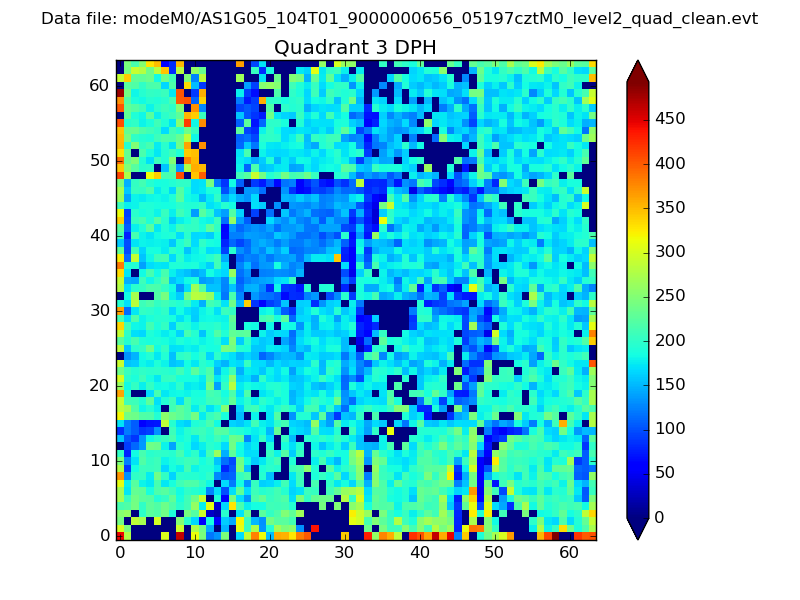 |
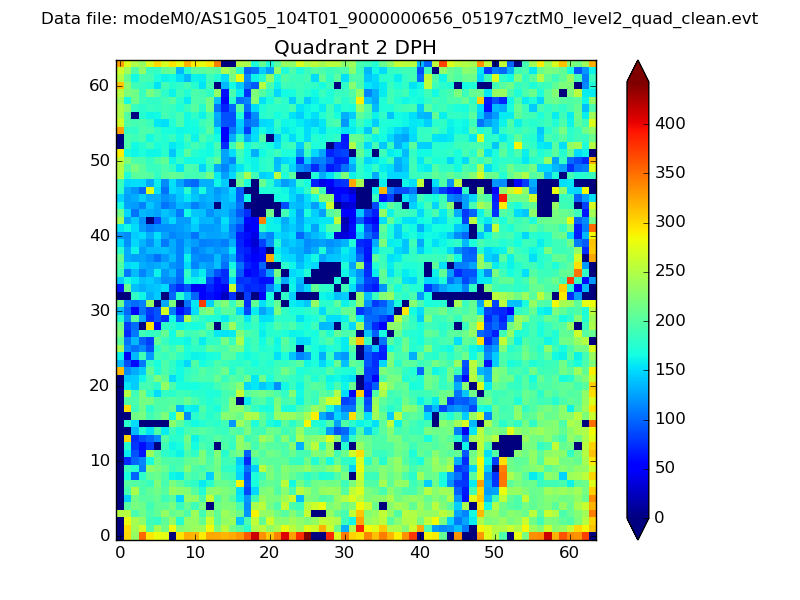 |
Quadrant C |
| Plot type | Count rate plots | Images |
|---|---|---|
| Comparison with Poisson distribution Blue bars denote a histogram of data divided into 1 sec bins. Red curve is a Poisson curve with rate = median count rate of data. |
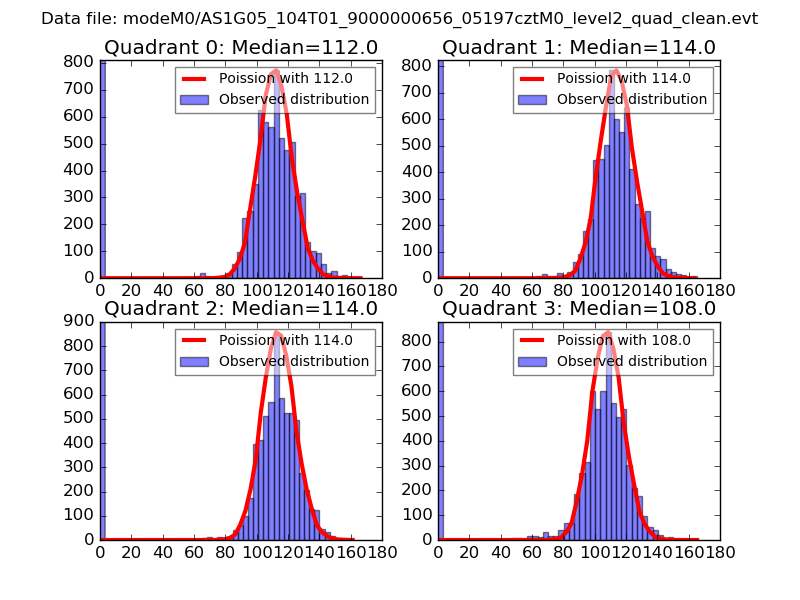 |
 |
| Quadrant-wise count rates Data is divided into 100 sec bins |
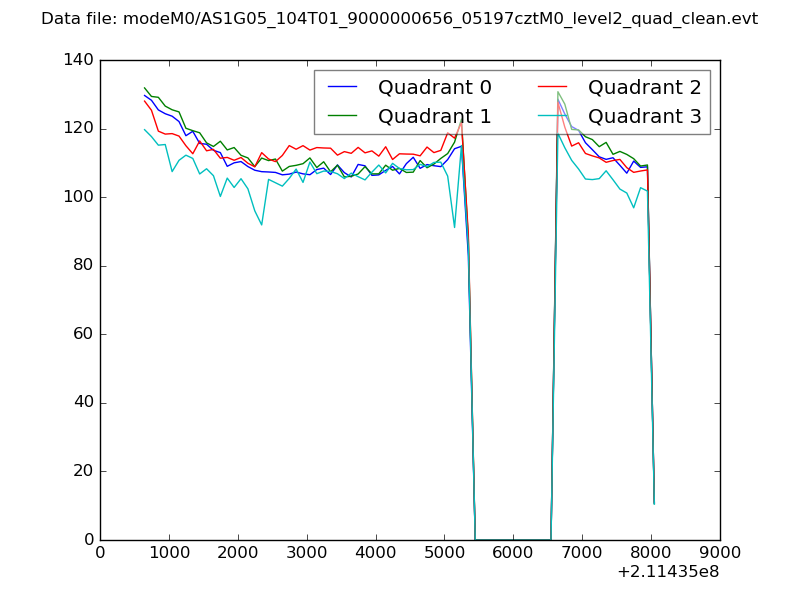 |
|
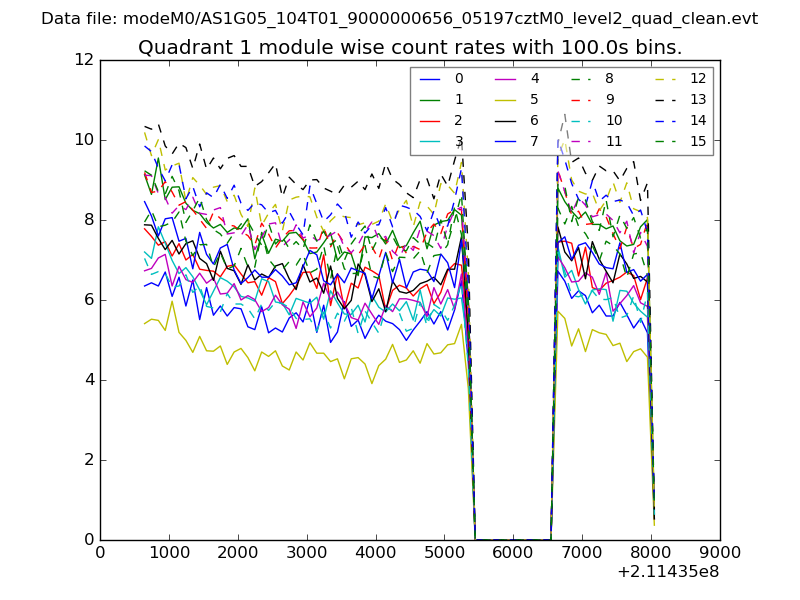
| Module-wise count rates for Quadrant A Data is divided into 100 sec bins |
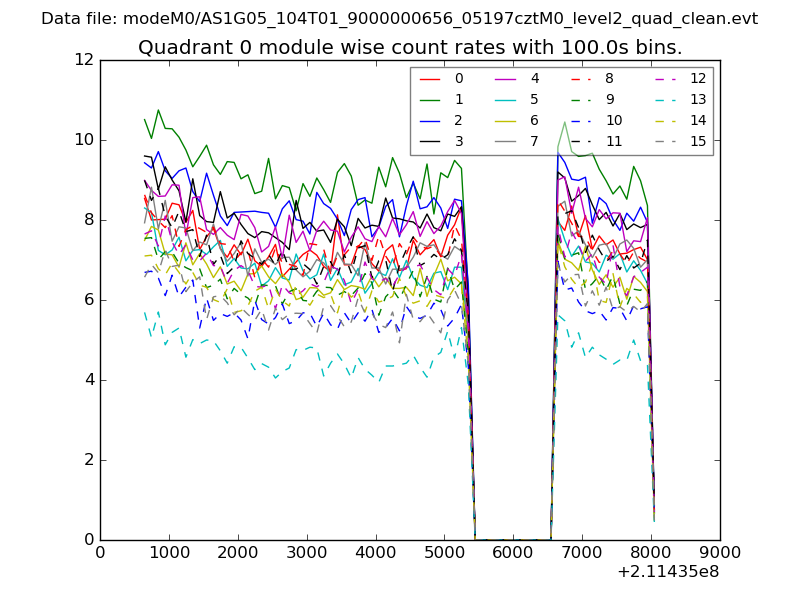 |
 |
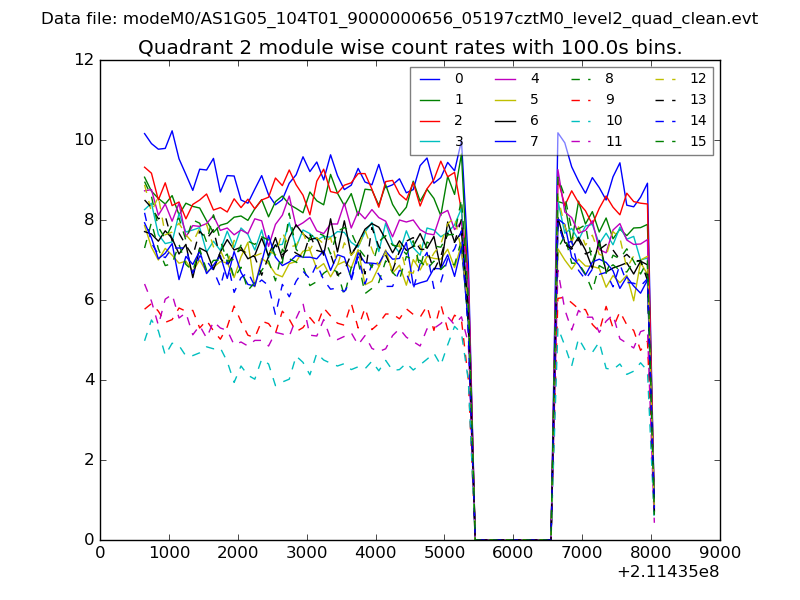
| Module-wise count rates for Quadrant B Data is divided into 100 sec bins |
 |
 |
| Module-wise count rates for Quadrant C Data is divided into 100 sec bins |
 |
 |
| Module-wise count rates for Quadrant D Data is divided into 100 sec bins |
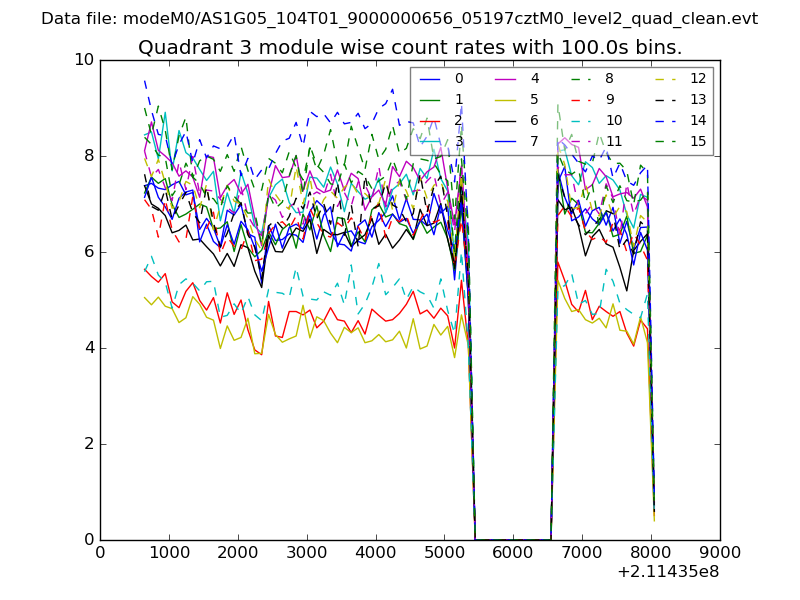 |
 |
| Parameter | Plot |
|---|---|
| CZT HV Monitor | 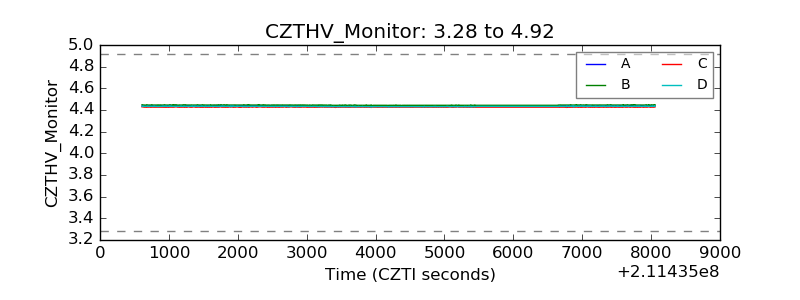 |
| D_VDD | 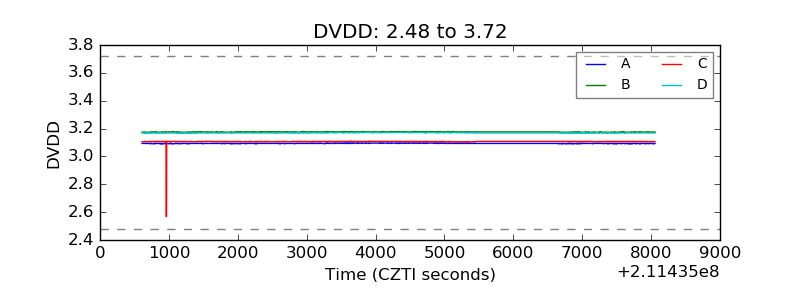 |
| Temperature 1 | 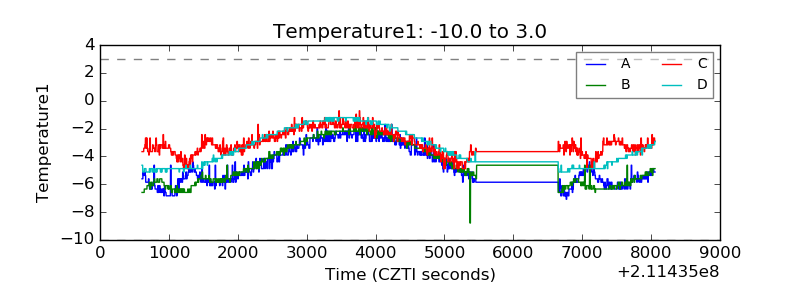 |
| Veto HV Monitor | 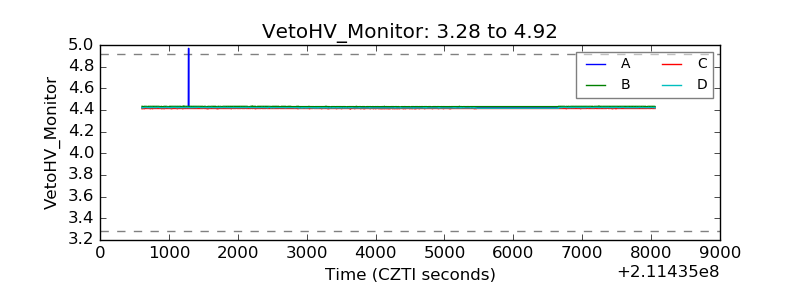 |
| Veto LLD | 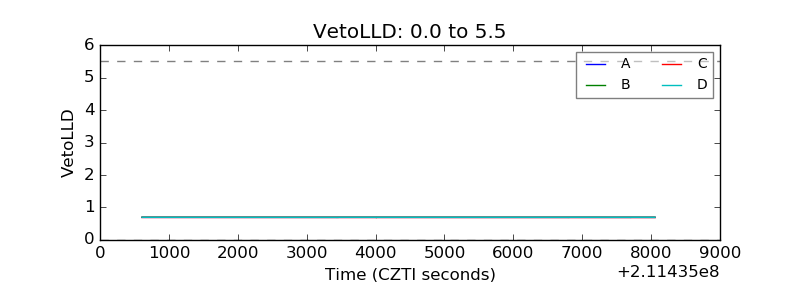 |
| Alpha Counter | 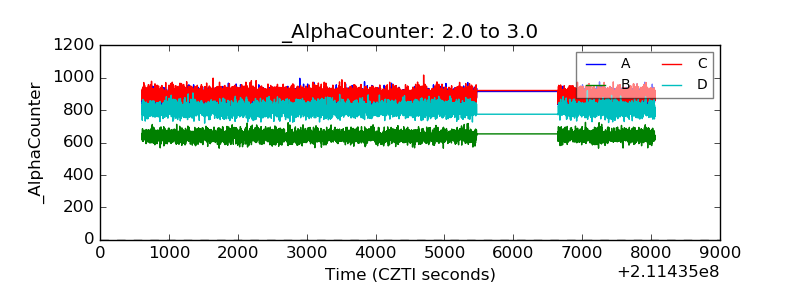 |
| _CPM_Rate | 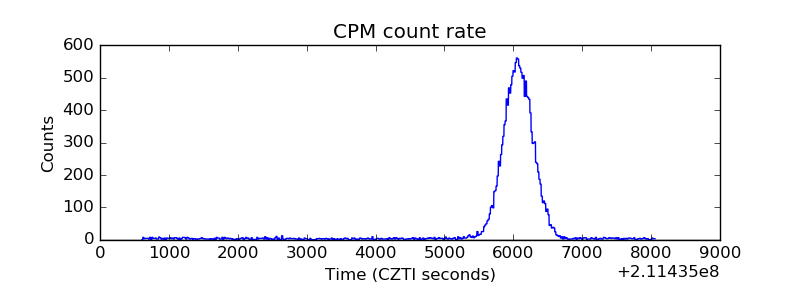 |
| CZT Counter | 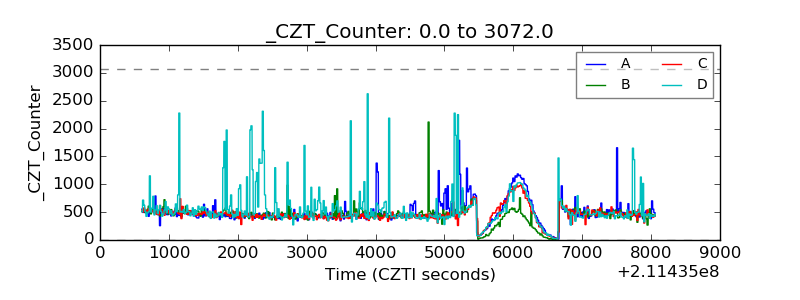 |
| +2.5 Volts monitor |  |
| +5 Volts monitor | 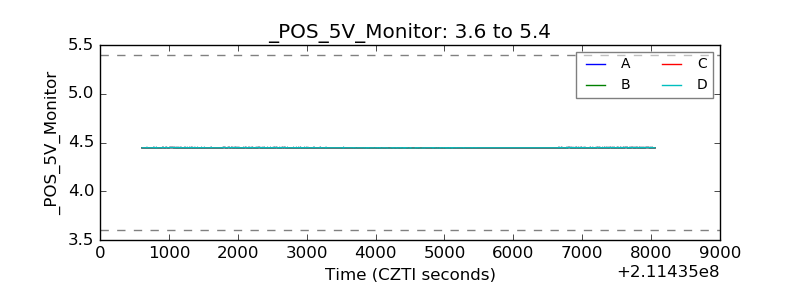 |
| _ROLL_ROT | 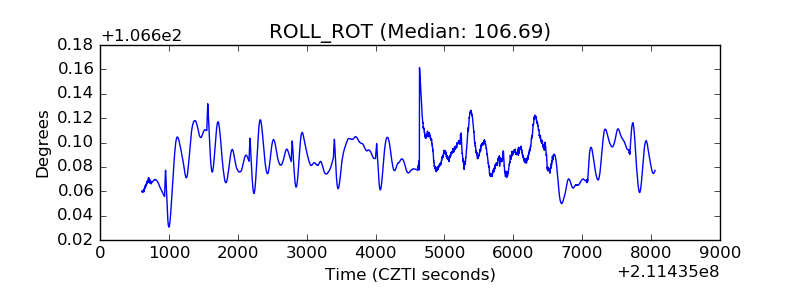 |
| _Roll_DEC | 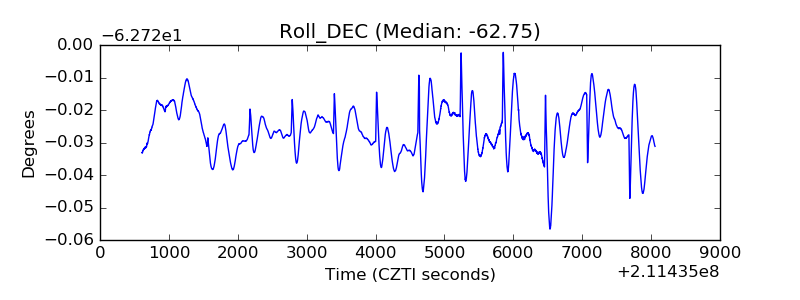 |
| _Roll_RA | 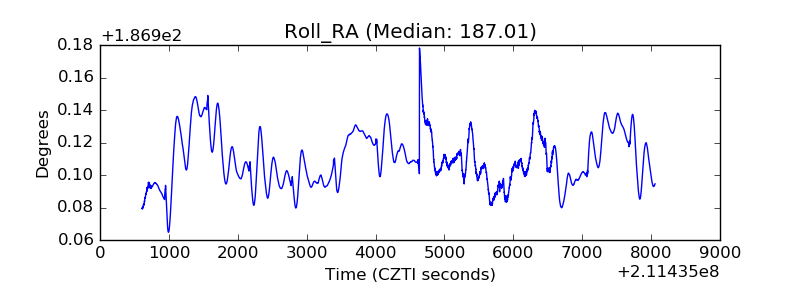 |
| Veto Counter | 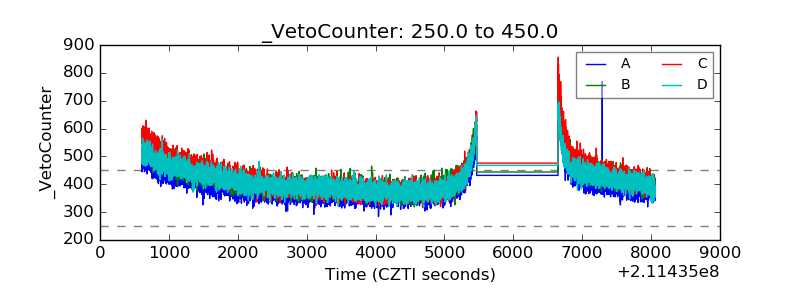 |