| Param | Original file | Final file |
|---|---|---|
| Filename | modeM0/AS1G05_104T01_9000000656_05198cztM0_level2.evt | modeM0/AS1G05_104T01_9000000656_05198cztM0_level2_quad_clean.evt |
| Size (bytes) | 409,593,600 | 92,410,560 |
| Size | 390.6 MB | 88.1 MB |
| Events in quadrant A | 2,884,596 | 590,133 |
| Events in quadrant B | 2,935,103 | 597,411 |
| Events in quadrant C | 2,821,500 | 602,833 |
| Events in quadrant D | 3,337,418 | 571,398 |
| Mode M9 | |||
|---|---|---|---|
| Quadrant | BADHDUFLAG | Total packets | Discarded packets |
| A | 0 | 9 | 0 |
| B | 0 | 9 | 0 |
| C | 0 | 9 | 0 |
| D | 0 | 9 | 0 |
| Mode SS | |||
|---|---|---|---|
| Quadrant | BADHDUFLAG | Total packets | Discarded packets |
| A | 0 | 126 | 0 |
| B | 0 | 126 | 0 |
| C | 0 | 126 | 0 |
| D | 0 | 126 | 0 |
| Mode M0 | |||
|---|---|---|---|
| Quadrant | BADHDUFLAG | Total packets | Discarded packets |
| A | 0 | 12929 | 2 |
| B | 0 | 12934 | 1 |
| C | 0 | 12785 | 1 |
| D | 0 | 14367 | 1 |
| Quadrant | Total seconds | Saturated seconds | Saturation percentage |
|---|---|---|---|
| A | 6263 | 103 | 1.644579% |
| B | 6263 | 77 | 1.229443% |
| C | 6263 | 77 | 1.229443% |
| D | 6263 | 141 | 2.251317% |
Noise dominated data is calculated using 1-second bins in cleaned event files. If a bin has >2000 counts, and if more than 50% of those come from <1% of pixels, then it is considered to be noise-dominated and hence unusable.
| Quadrant | # 1 sec bins | Bins with >0 counts | Bins with >2000 counts | High rate bins dominated by noise | Noise dominated (total time) | Noise dominated (detector-on time) | Marked lightcurve |
|---|---|---|---|---|---|---|---|
| A | 7193 | 6264 | 0 | 0 | 0.00% | 0.00% | 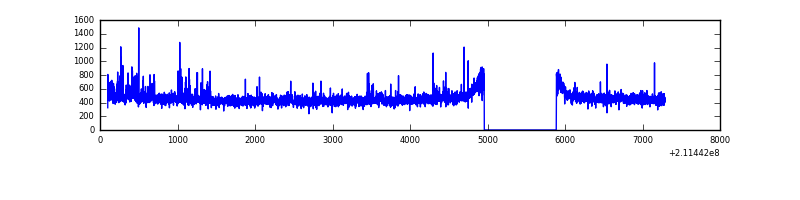 |
| B | 7193 | 6264 | 0 | 0 | 0.00% | 0.00% | 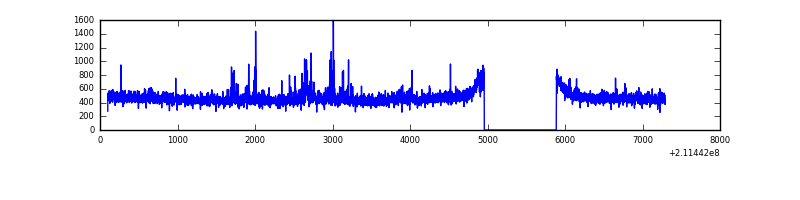 |
| C | 7193 | 6264 | 0 | 0 | 0.00% | 0.00% | 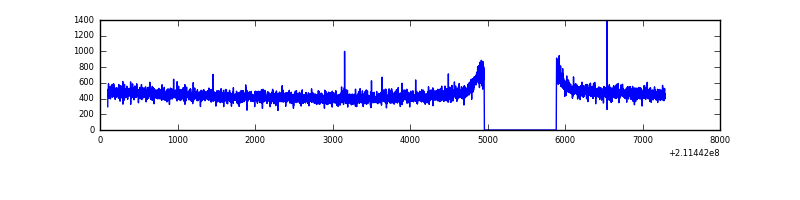 |
| D | 7193 | 6263 | 55 | 55 | 0.76% | 0.88% | 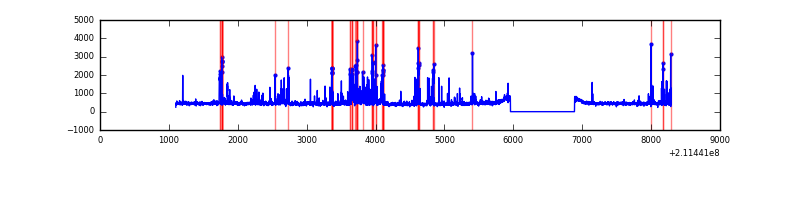 |
Top three noisy pixels from each quadrant. If the there are fewer than three noisy pixels in the level2.evt file, extra rows are filled as -1
| Pixel properties | Quadrant properties | ||||||
|---|---|---|---|---|---|---|---|
| Quadrant | DetID | PixID | Counts | Sigma | Mean | Median | Sigma |
| A | 4 | 2 | 73823 | 499.87 | 725 | 708 | 146.3 |
| A | 0 | 50 | 21674 | 143.34 | 725 | 708 | 146.3 |
| A | 12 | 194 | 7148 | 44.03 | 725 | 708 | 146.3 |
| B | 15 | 204 | 43851 | 311.48 | 729 | 712 | 138.5 |
| B | 15 | 54 | 36833 | 260.81 | 729 | 712 | 138.5 |
| B | 0 | 198 | 15554 | 107.17 | 729 | 712 | 138.5 |
| C | 1 | 16 | 21322 | 125.86 | 712 | 718 | 163.7 |
| C | 14 | 67 | 12472 | 71.8 | 712 | 718 | 163.7 |
| C | 13 | 61 | 5894 | 31.62 | 712 | 718 | 163.7 |
| D | 14 | 34 | 331944 | 1920.3 | 709 | 685 | 172.5 |
| D | 2 | 136 | 135385 | 780.85 | 709 | 685 | 172.5 |
| D | 1 | 31 | 67276 | 386.02 | 709 | 685 | 172.5 |
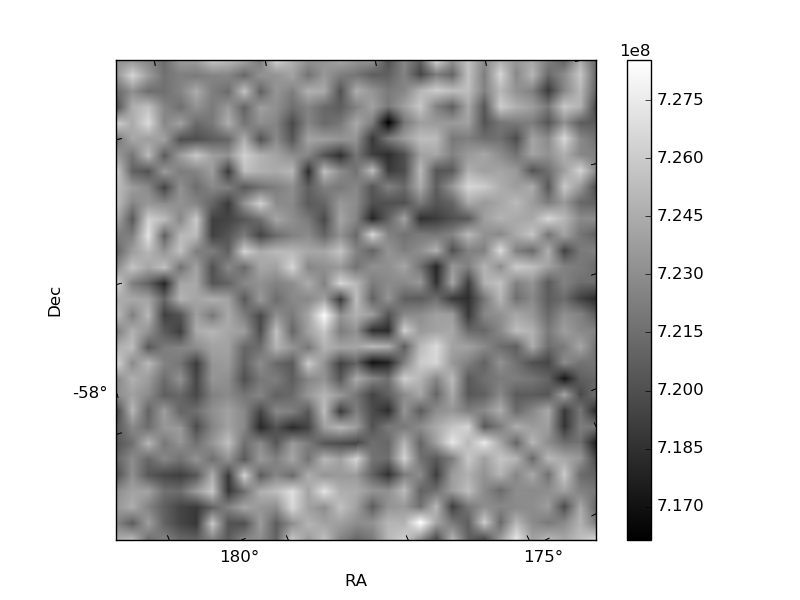
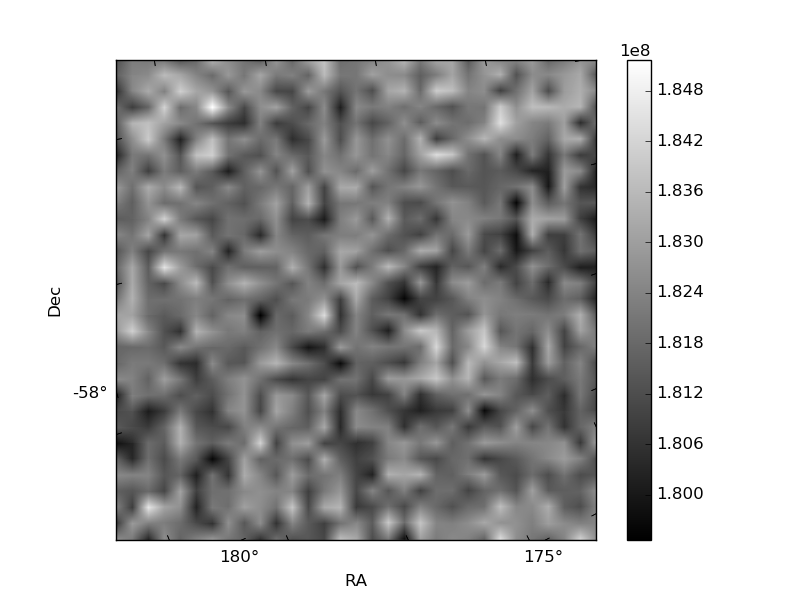
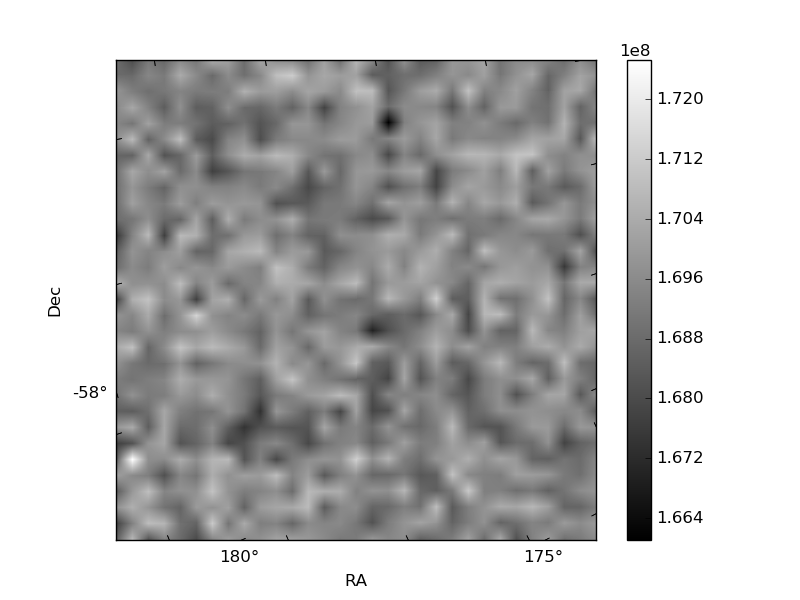
Histogram calculated using DETX and DETY for each event in the final _common_clean file
| Quadrant A | 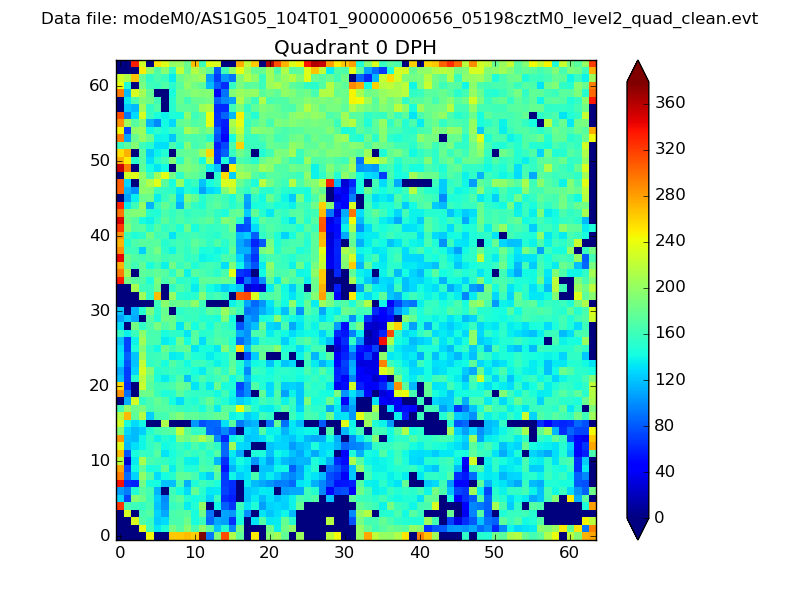 |
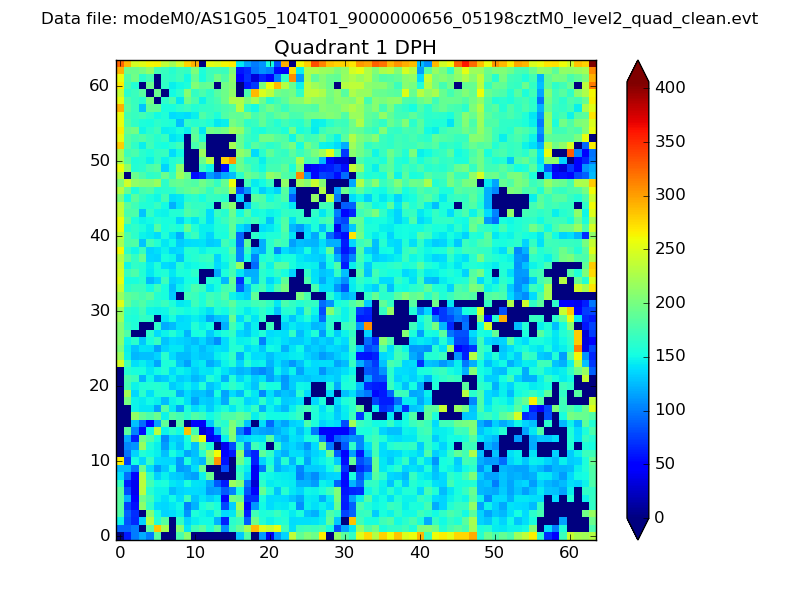 |
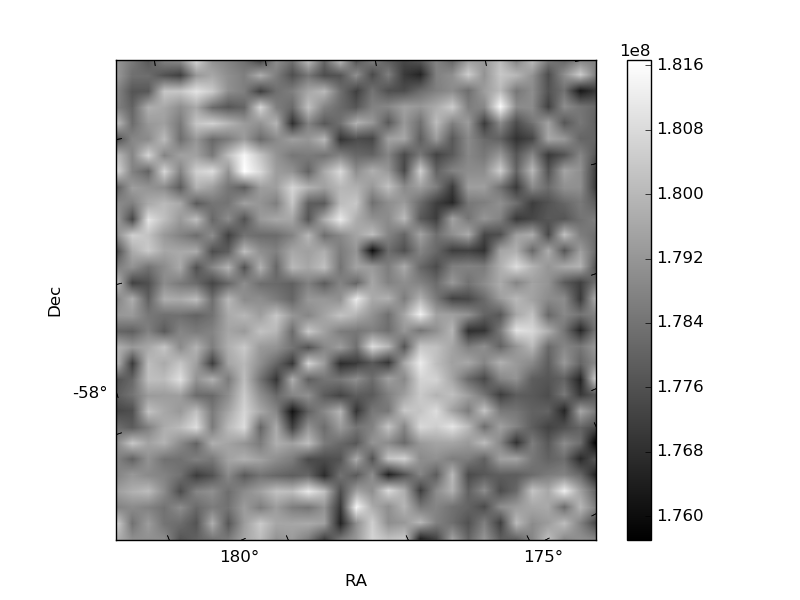
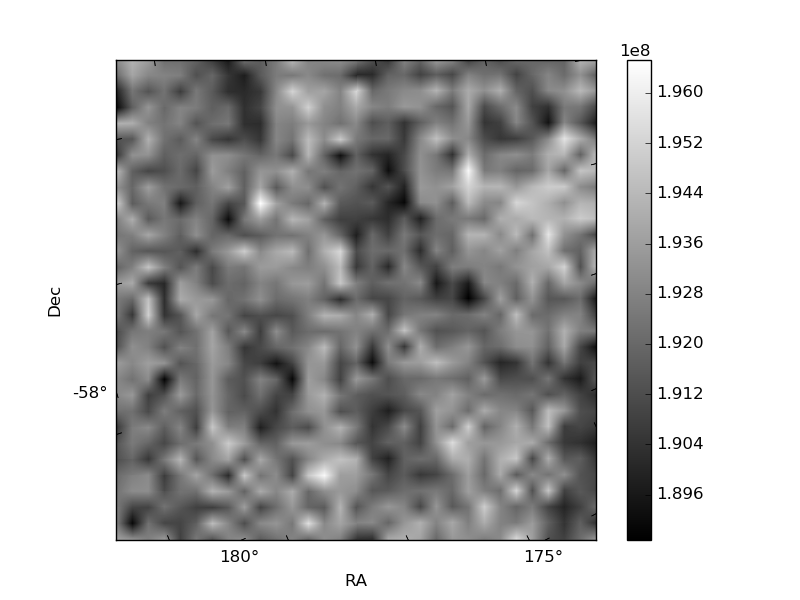
Quadrant B |
|---|---|---|---|
| Quadrant D | 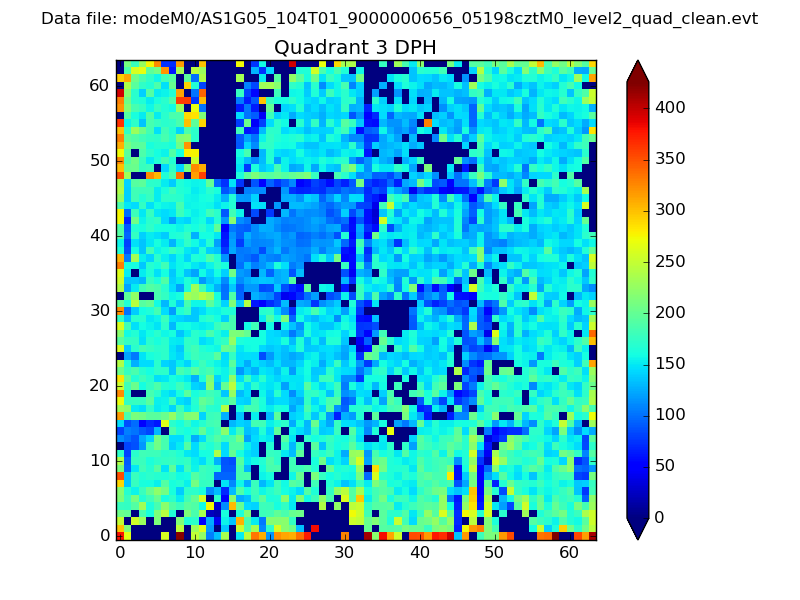 |
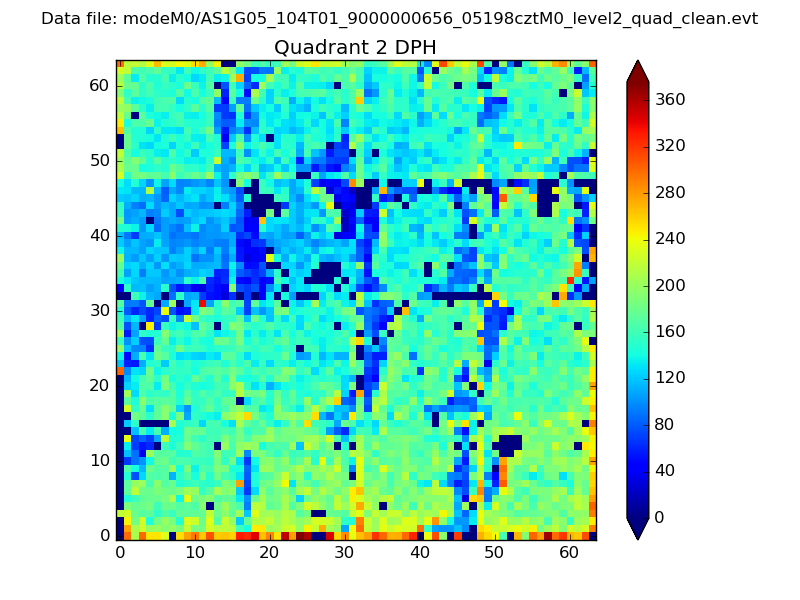 |
Quadrant C |
| Plot type | Count rate plots | Images |
|---|---|---|
| Comparison with Poisson distribution Blue bars denote a histogram of data divided into 1 sec bins. Red curve is a Poisson curve with rate = median count rate of data. |
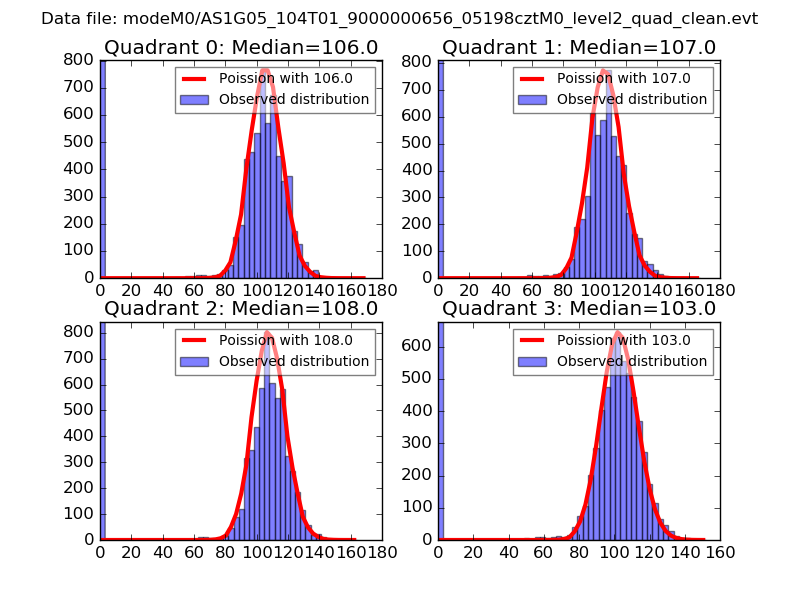 |
 |
| Quadrant-wise count rates Data is divided into 100 sec bins |
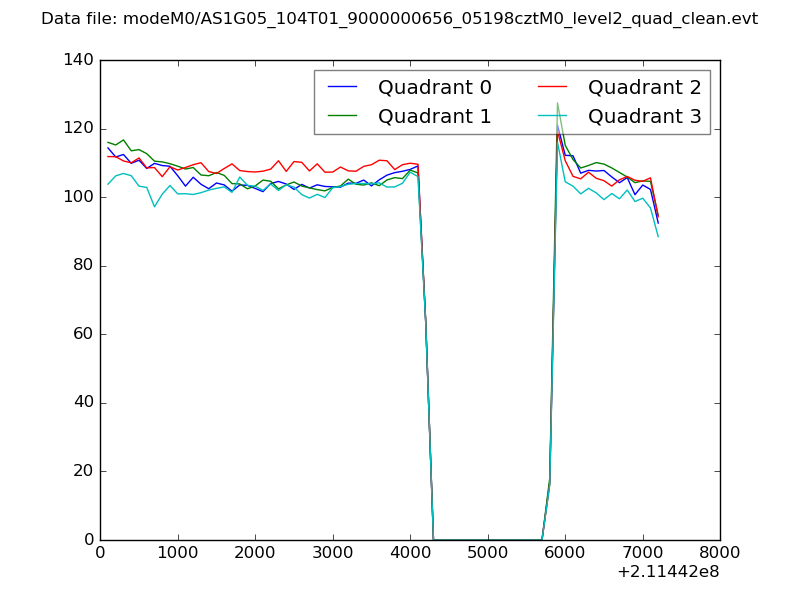 |
|
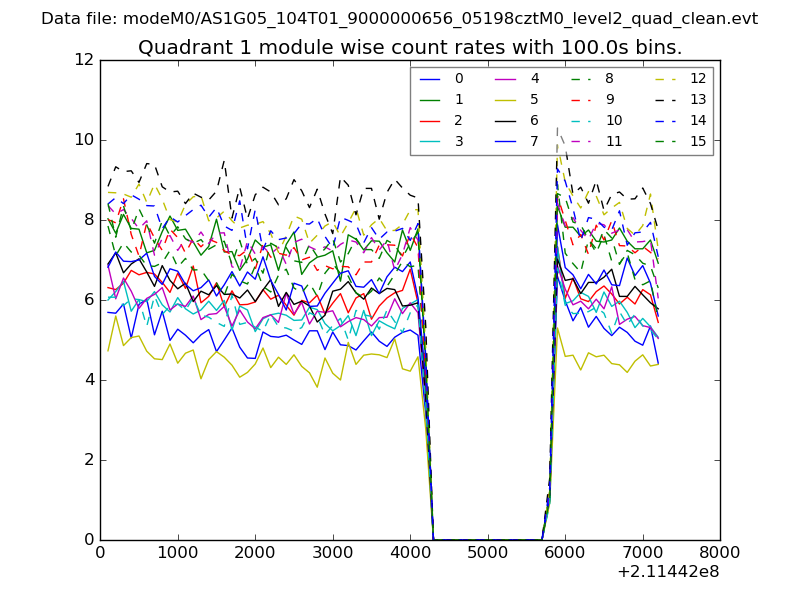
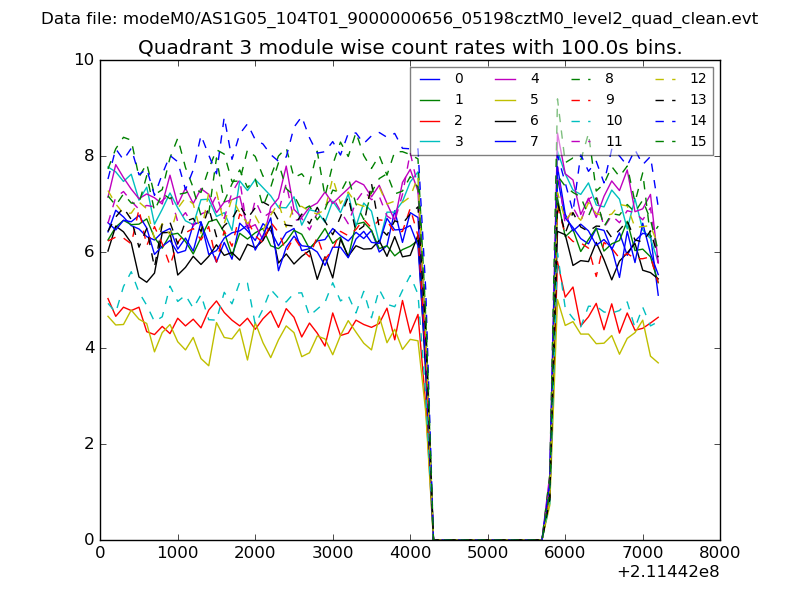
| Module-wise count rates for Quadrant A Data is divided into 100 sec bins |
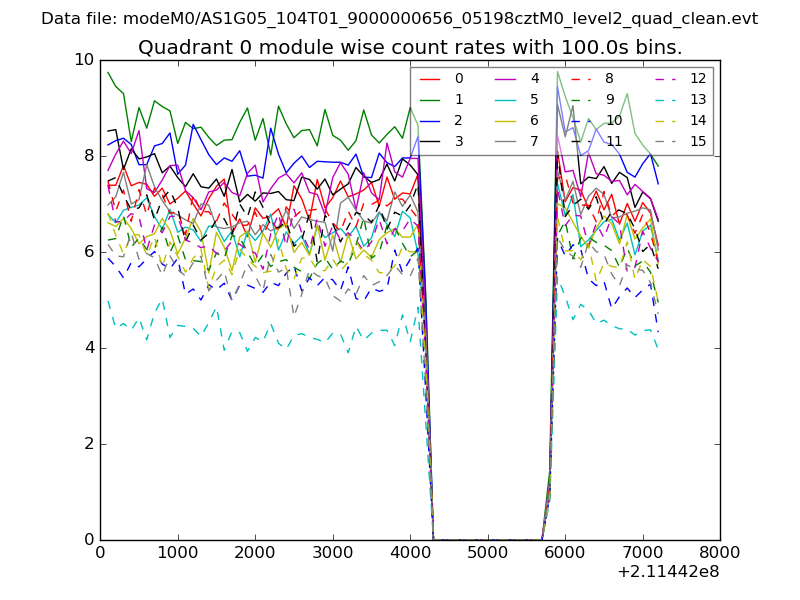 |
 |
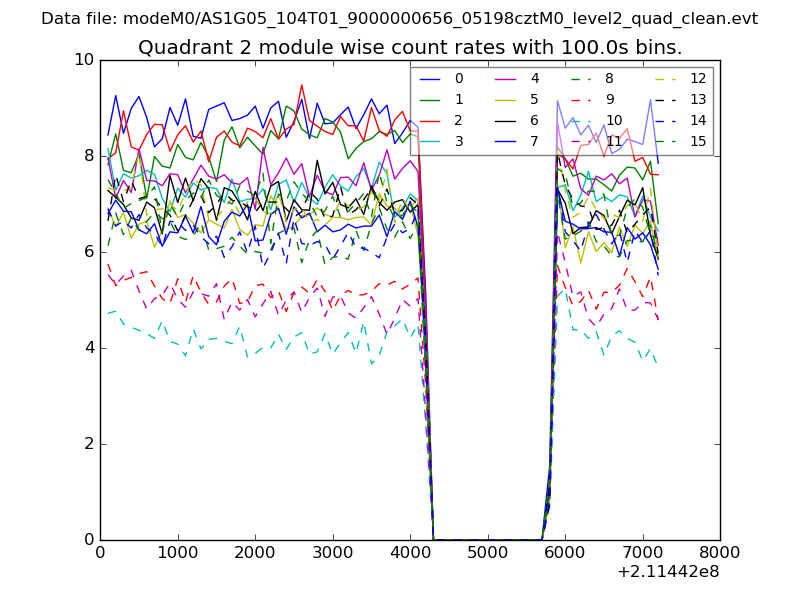
| Module-wise count rates for Quadrant B Data is divided into 100 sec bins |
 |
 |
| Module-wise count rates for Quadrant C Data is divided into 100 sec bins |
 |
 |
| Module-wise count rates for Quadrant D Data is divided into 100 sec bins |
 |
 |
| Parameter | Plot |
|---|---|
| CZT HV Monitor | 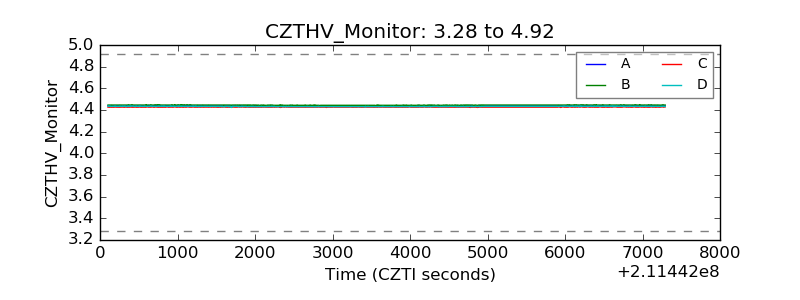 |
| D_VDD | 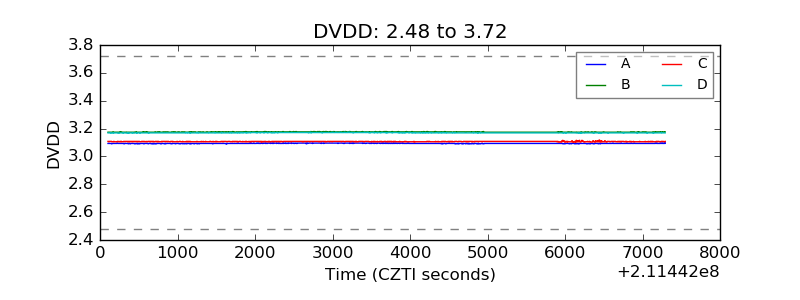 |
| Temperature 1 |  |
| Veto HV Monitor | 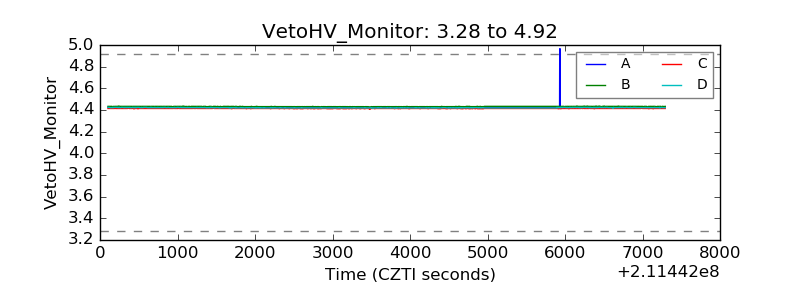 |
| Veto LLD |  |
| Alpha Counter | 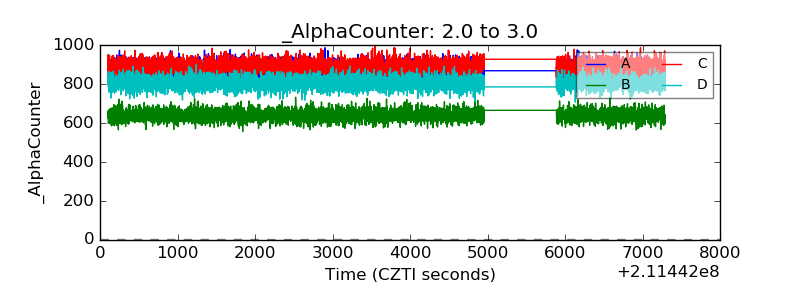 |
| _CPM_Rate | 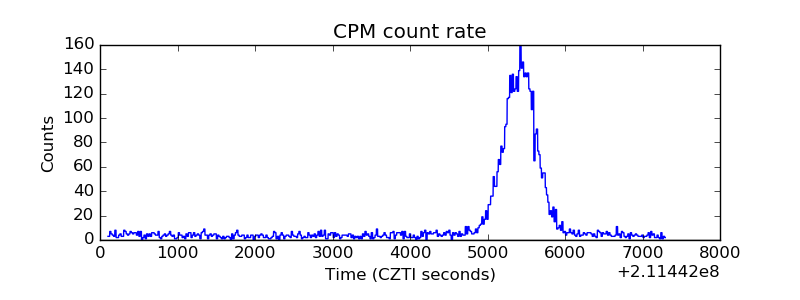 |
| CZT Counter | 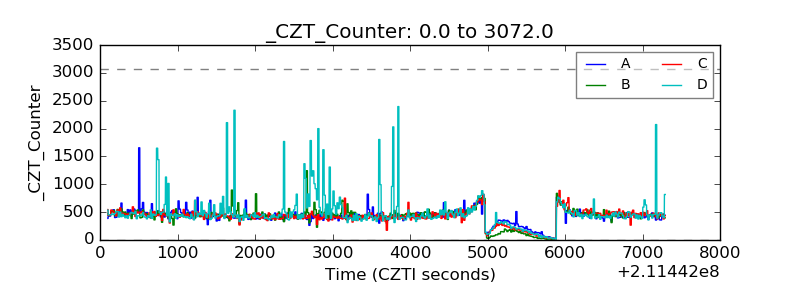 |
| +2.5 Volts monitor |  |
| +5 Volts monitor | 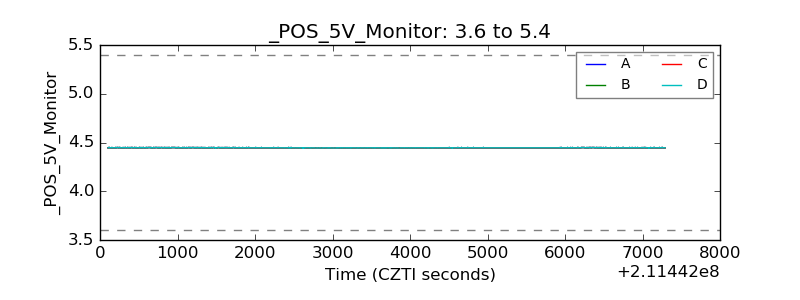 |
| _ROLL_ROT | 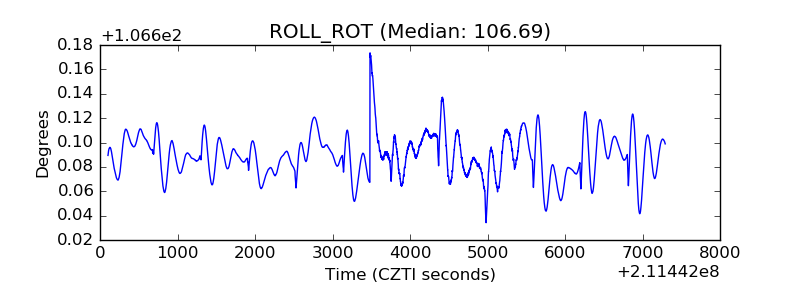 |
| _Roll_DEC | 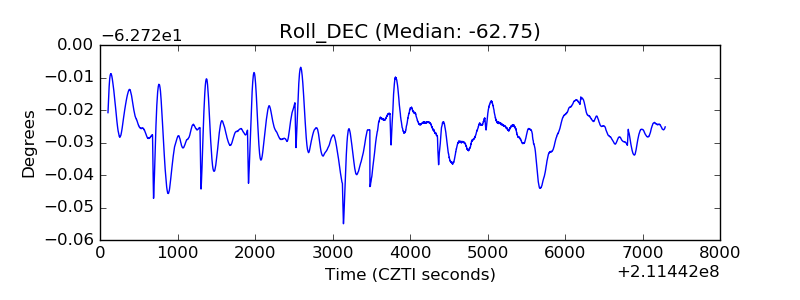 |
| _Roll_RA | 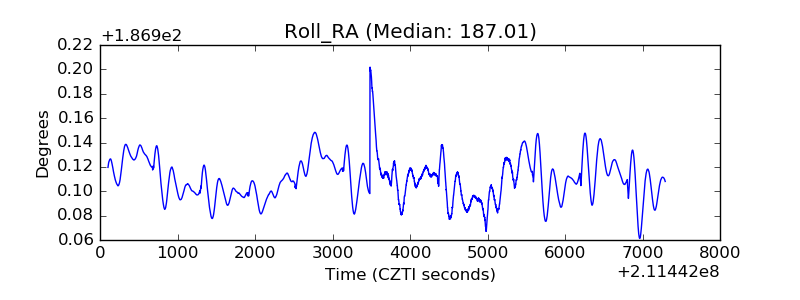 |
| Veto Counter | 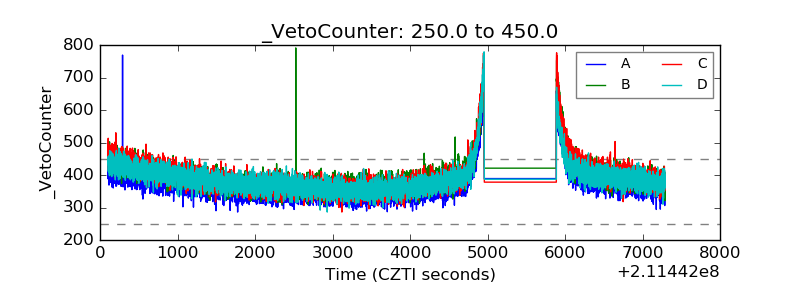 |