| Param | Original file | Final file |
|---|---|---|
| Filename | modeM0/AS1G05_104T01_9000000656_05200cztM0_level2.evt | modeM0/AS1G05_104T01_9000000656_05200cztM0_level2_quad_clean.evt |
| Size (bytes) | 43,009,920 | 7,467,840 |
| Size | 41.0 MB | 7.1 MB |
| Events in quadrant A | 327,710 | 46,337 |
| Events in quadrant B | 315,643 | 44,629 |
| Events in quadrant C | 292,206 | 46,610 |
| Events in quadrant D | 315,875 | 31,708 |
| Mode SS | |||
|---|---|---|---|
| Quadrant | BADHDUFLAG | Total packets | Discarded packets |
| A | 0 | 73 | 53 |
| B | 0 | 71 | 57 |
| C | 0 | 72 | 52 |
| D | 0 | 70 | 48 |
| Mode M0 | |||
|---|---|---|---|
| Quadrant | BADHDUFLAG | Total packets | Discarded packets |
| A | 0 | 7413 | 5923 |
| B | 0 | 7366 | 5940 |
| C | 0 | 7110 | 5679 |
| D | 0 | 10010 | 8729 |
| Quadrant | Total seconds | Saturated seconds | Saturation percentage |
|---|---|---|---|
| A | 730 | 1 | 0.136986% |
| B | 706 | 0 | 0.000000% |
| C | 716 | 0 | 0.000000% |
| D | 535 | 3 | 0.560748% |
Noise dominated data is calculated using 1-second bins in cleaned event files. If a bin has >2000 counts, and if more than 50% of those come from <1% of pixels, then it is considered to be noise-dominated and hence unusable.
| Quadrant | # 1 sec bins | Bins with >0 counts | Bins with >2000 counts | High rate bins dominated by noise | Noise dominated (total time) | Noise dominated (detector-on time) | Marked lightcurve |
|---|---|---|---|---|---|---|---|
| A | 3607 | 1174 | 0 | 0 | 0.00% | 0.00% | 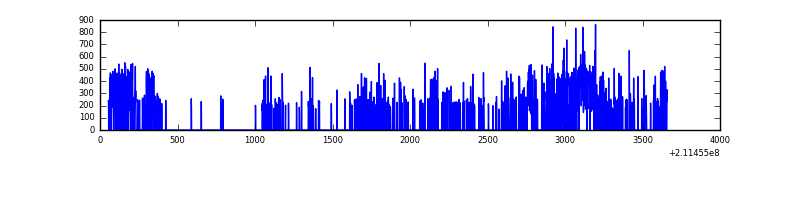 |
| B | 3614 | 1144 | 0 | 0 | 0.00% | 0.00% | 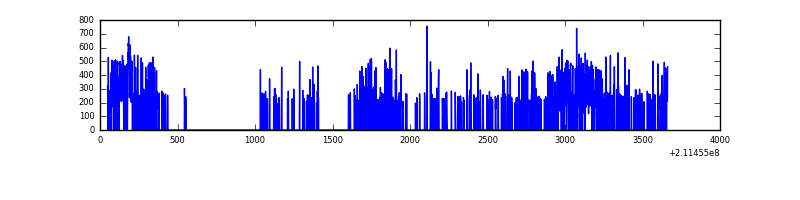 |
| C | 3612 | 1171 | 0 | 0 | 0.00% | 0.00% | 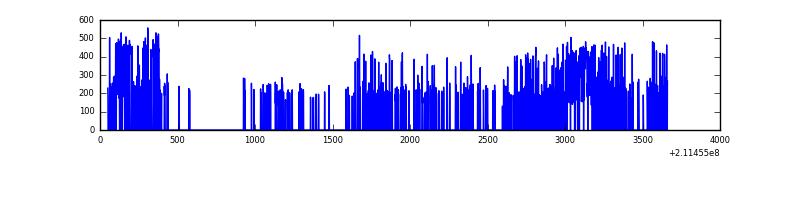 |
| D | 3611 | 889 | 1 | 1 | 0.03% | 0.11% | 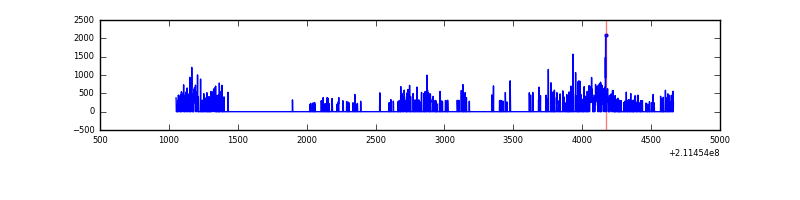 |
Top three noisy pixels from each quadrant. If the there are fewer than three noisy pixels in the level2.evt file, extra rows are filled as -1
| Pixel properties | Quadrant properties | ||||||
|---|---|---|---|---|---|---|---|
| Quadrant | DetID | PixID | Counts | Sigma | Mean | Median | Sigma |
| A | 4 | 2 | 25598 | 1422.91 | 77 | 75 | 17.9 |
| A | 0 | 50 | 3680 | 200.98 | 77 | 75 | 17.9 |
| A | 12 | 194 | 764 | 38.41 | 77 | 75 | 17.9 |
| B | 15 | 204 | 16862 | 990.01 | 76 | 74 | 17.0 |
| B | 0 | 219 | 1879 | 106.44 | 76 | 74 | 17.0 |
| B | 12 | 111 | 1168 | 64.51 | 76 | 74 | 17.0 |
| C | 1 | 16 | 5589 | 287.51 | 73 | 73 | 19.2 |
| C | 13 | 61 | 560 | 25.38 | 73 | 73 | 19.2 |
| C | 12 | 4 | 216 | 7.45 | 73 | 73 | 19.2 |
| D | 2 | 63 | 81105 | 5256.04 | 54 | 52 | 15.4 |
| D | 2 | 33 | 13831 | 893.53 | 54 | 52 | 15.4 |
| D | 2 | 136 | 7370 | 474.55 | 54 | 52 | 15.4 |
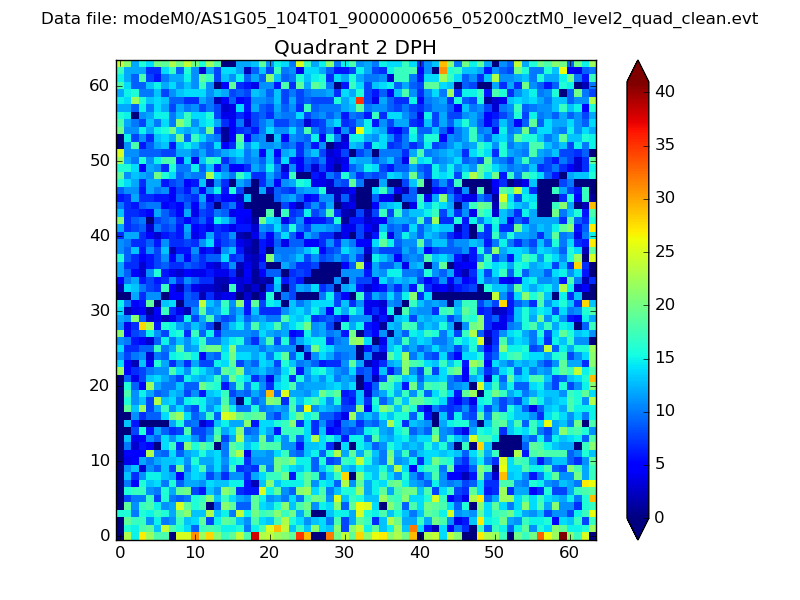
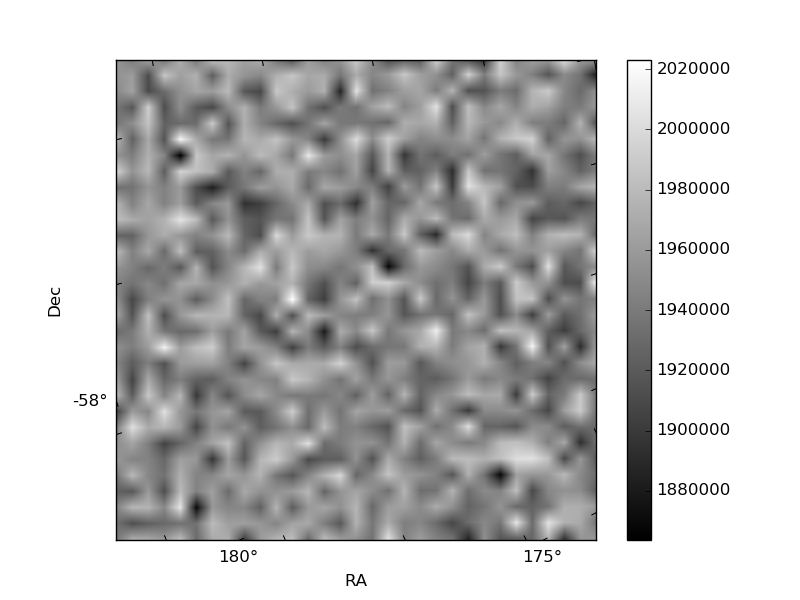
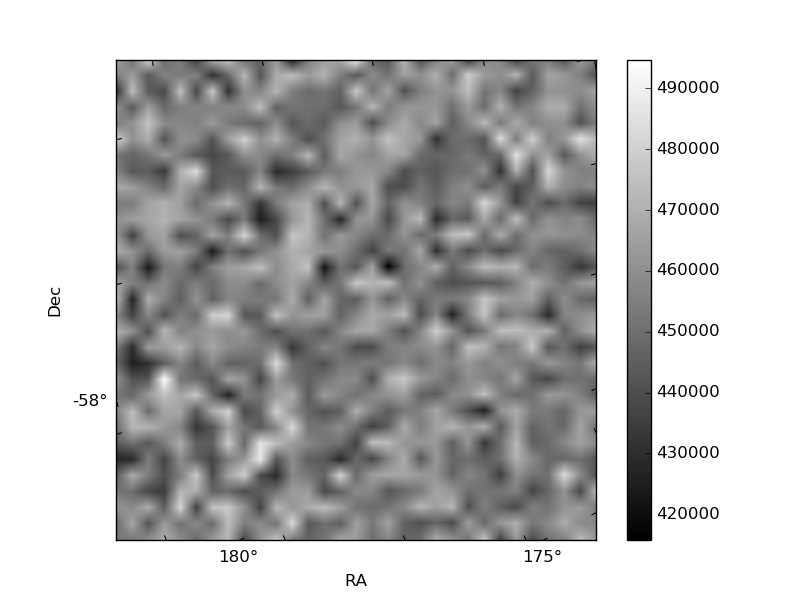
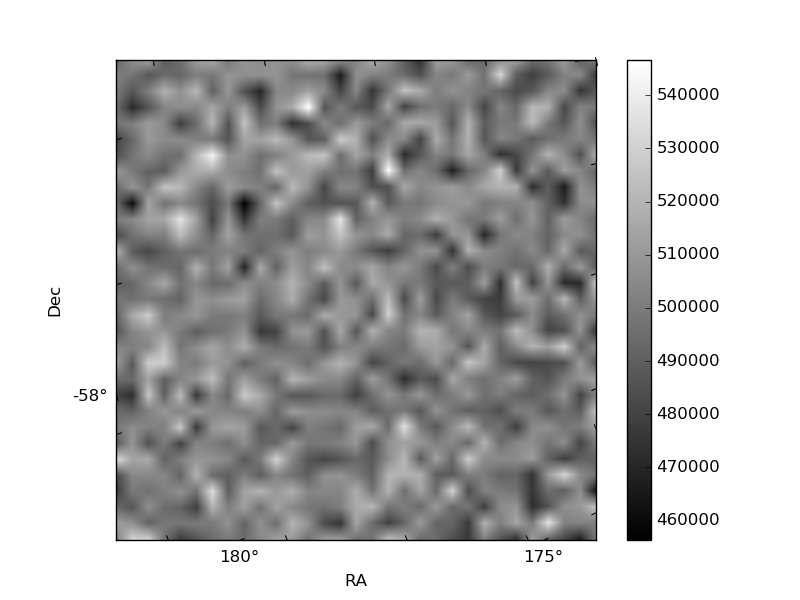
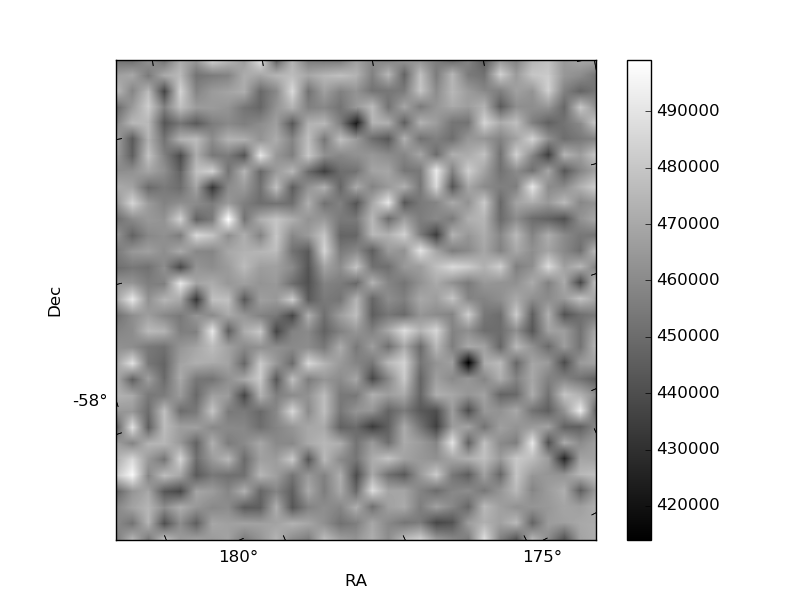
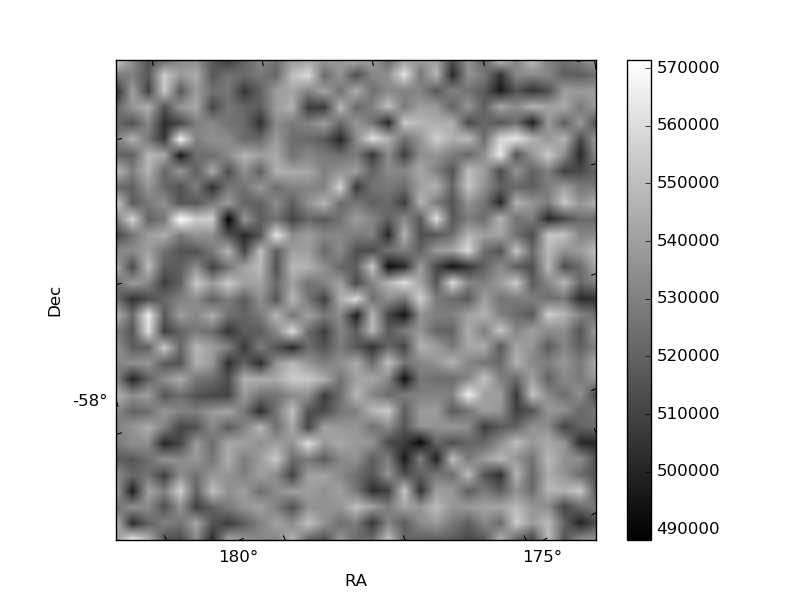
Histogram calculated using DETX and DETY for each event in the final _common_clean file
| Quadrant A | 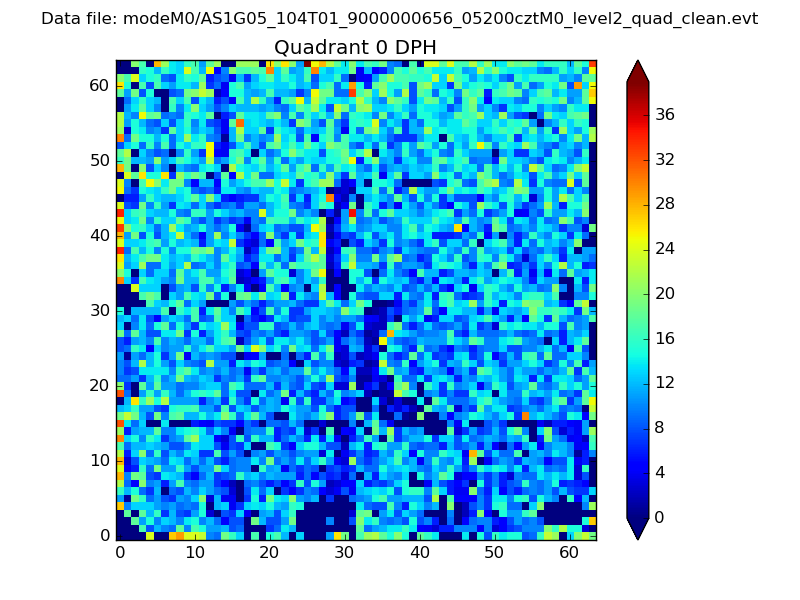 |
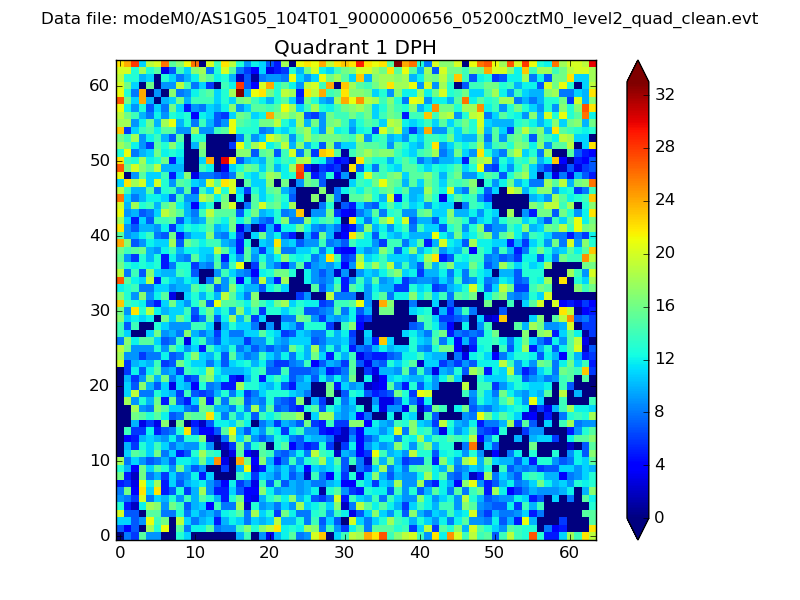 |
Quadrant B |
|---|---|---|---|
| Quadrant D | 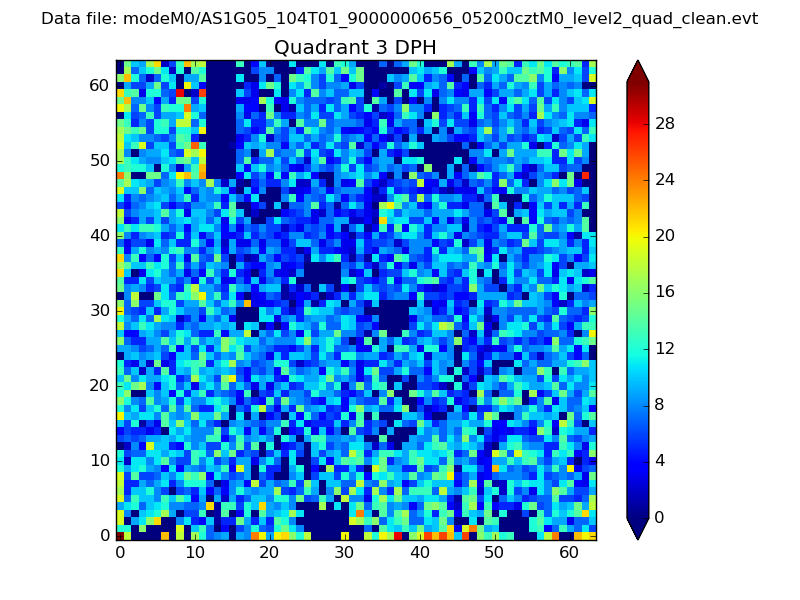 |
 |
Quadrant C |
| Plot type | Count rate plots | Images |
|---|---|---|
| Comparison with Poisson distribution Blue bars denote a histogram of data divided into 1 sec bins. Red curve is a Poisson curve with rate = median count rate of data. |
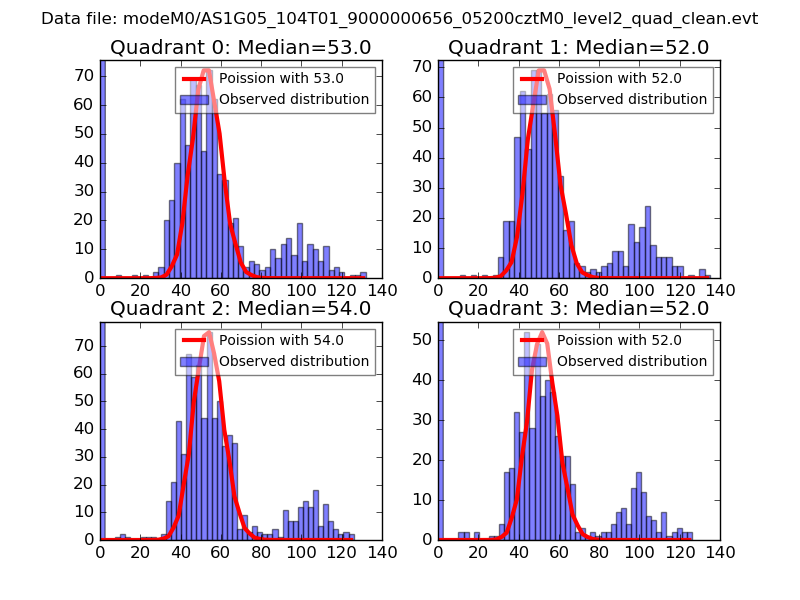 |
 |
| Quadrant-wise count rates Data is divided into 100 sec bins |
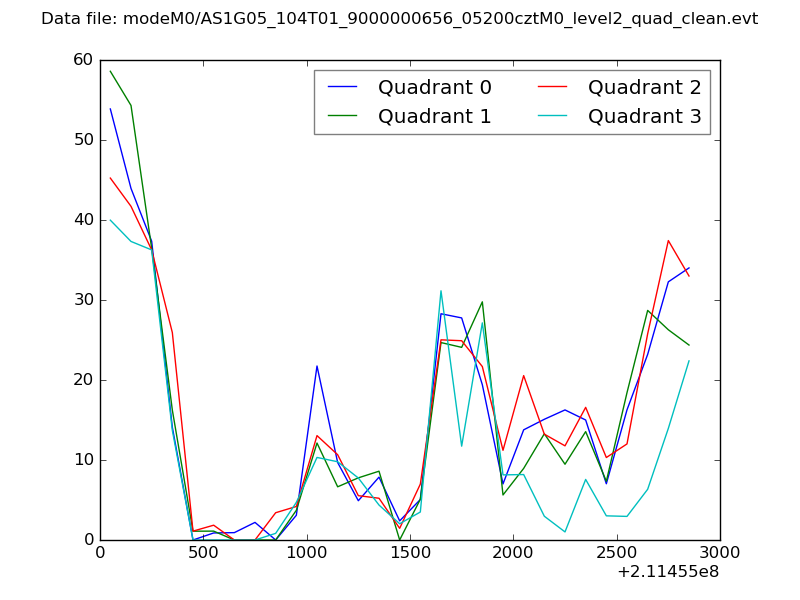 |
|
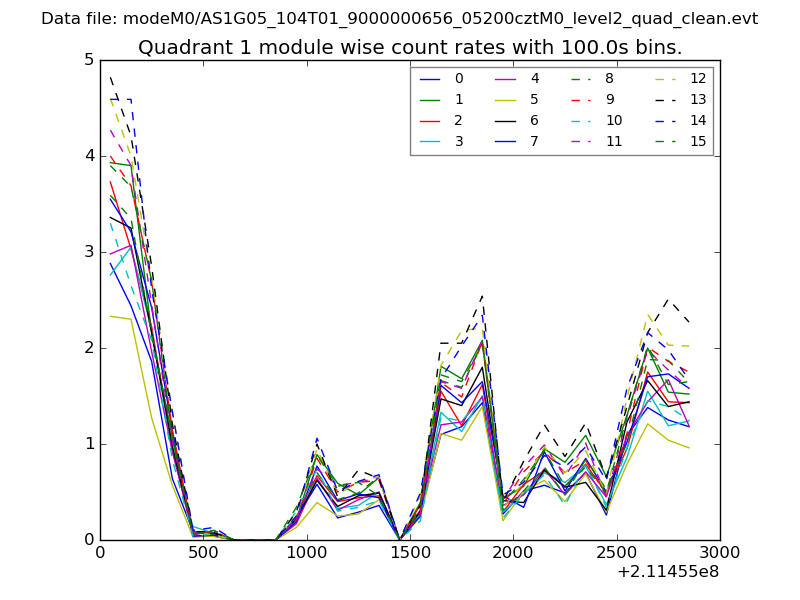
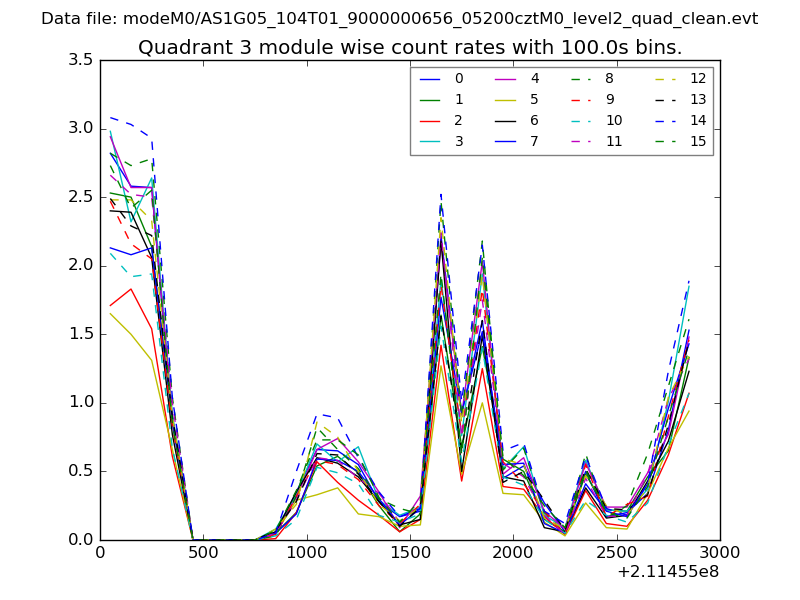
| Module-wise count rates for Quadrant A Data is divided into 100 sec bins |
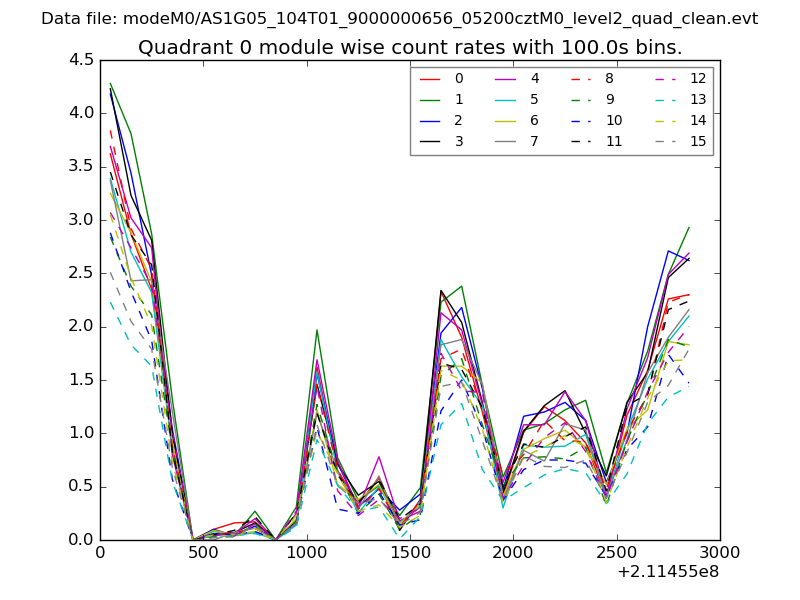 |
 |
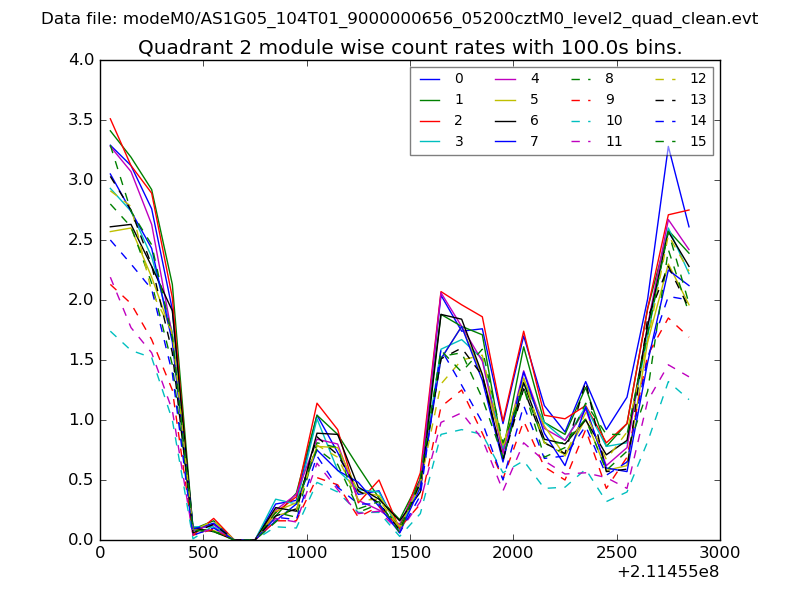
| Module-wise count rates for Quadrant B Data is divided into 100 sec bins |
 |
 |
| Module-wise count rates for Quadrant C Data is divided into 100 sec bins |
 |
 |
| Module-wise count rates for Quadrant D Data is divided into 100 sec bins |
 |
 |
| Parameter | Plot |
|---|---|
| CZT HV Monitor | 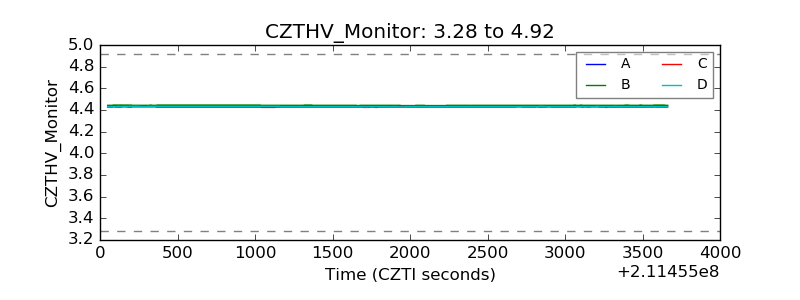 |
| D_VDD | 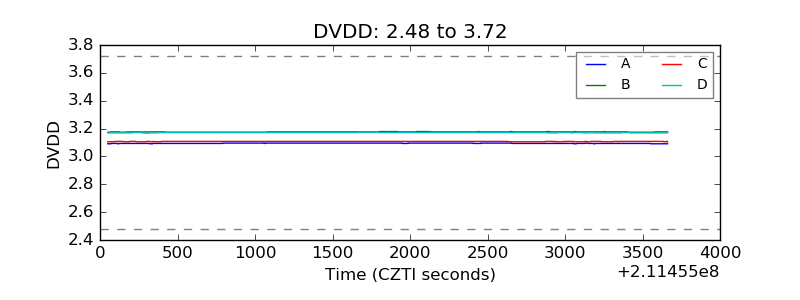 |
| Temperature 1 |  |
| Veto HV Monitor | 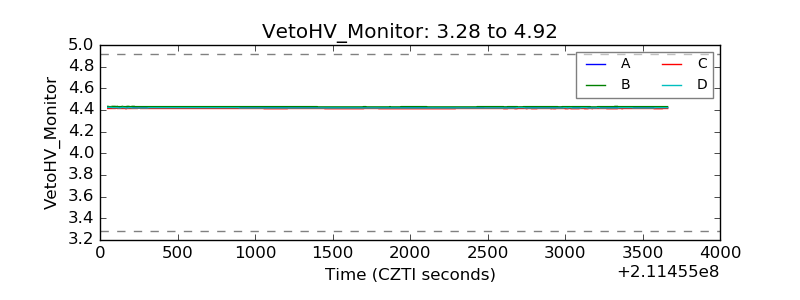 |
| Veto LLD | 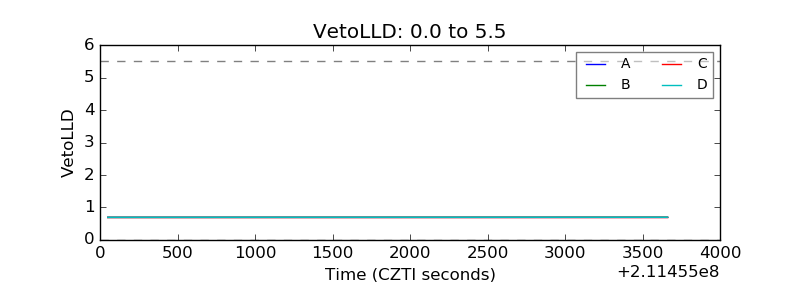 |
| Alpha Counter | 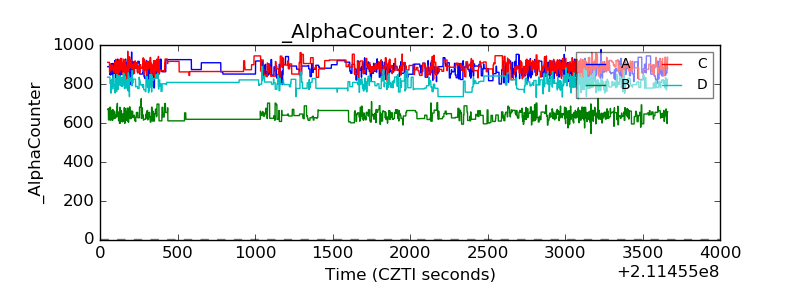 |
| _CPM_Rate | 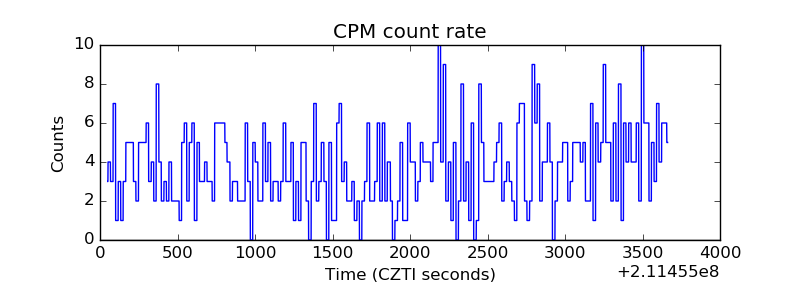 |
| CZT Counter | 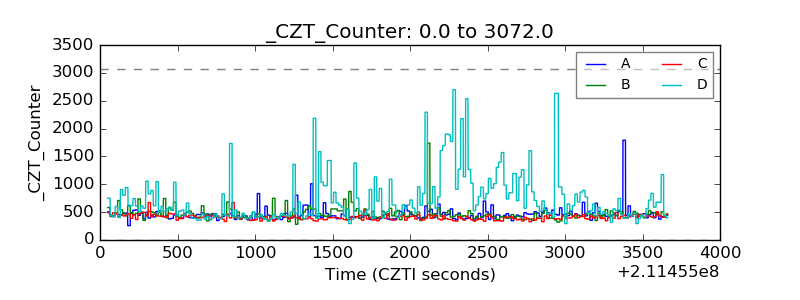 |
| +2.5 Volts monitor |  |
| +5 Volts monitor |  |
| _ROLL_ROT | 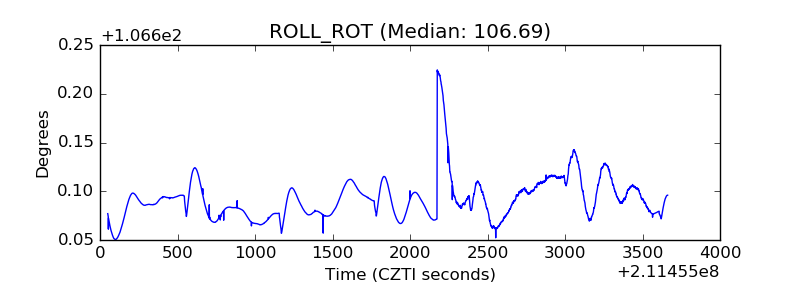 |
| _Roll_DEC | 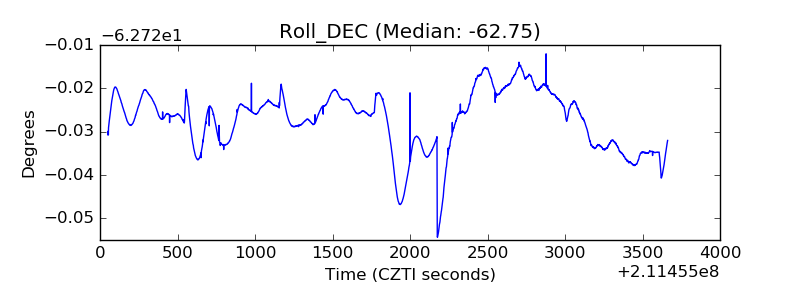 |
| _Roll_RA | 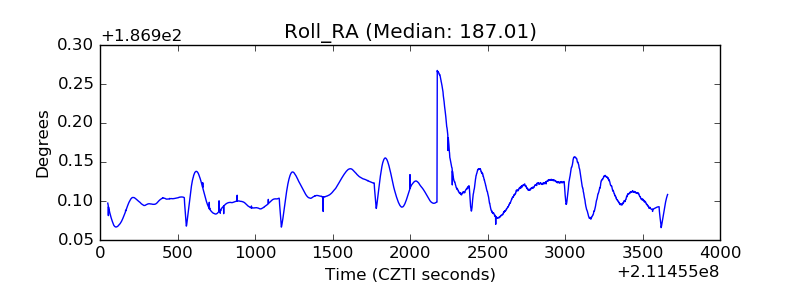 |
| Veto Counter | 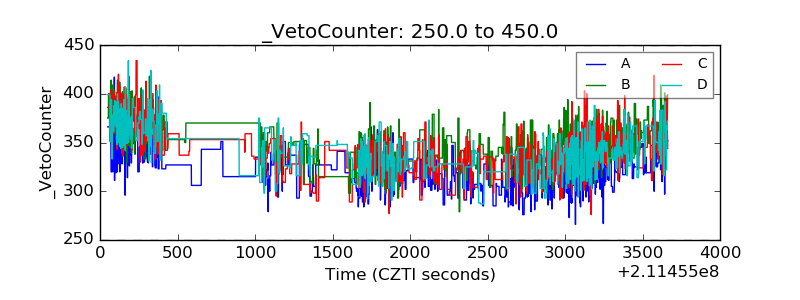 |