| Param | Original file | Final file |
|---|---|---|
| Filename | modeM0/AS1G05_243T01_9000000654cztM0_level2.fits | modeM0/AS1G05_243T01_9000000654cztM0_level2_quad_clean.evt |
| Size (bytes) | 89,357,760 | 89,959,680 |
| Size | 85.2 MB | 85.8 MB |
| Events in quadrant A | 531,020 | 534,992 |
| Events in quadrant B | 519,276 | 535,902 |
| Events in quadrant C | 530,734 | 525,538 |
| Events in quadrant D | 451,392 | 454,116 |
| Mode M0 | |||
|---|---|---|---|
| Quadrant | BADHDUFLAG | Total packets | Discarded packets |
| A | 0 | 20569 | 0 |
| B | 0 | 21087 | 0 |
| C | 0 | 20338 | 0 |
| D | 0 | 25594 | 0 |
| Mode M9 | |||
|---|---|---|---|
| Quadrant | BADHDUFLAG | Total packets | Discarded packets |
| A | 0 | 4 | 0 |
| B | 0 | 4 | 0 |
| C | 0 | 4 | 0 |
| D | 0 | 4 | 0 |
| Mode SS | |||
|---|---|---|---|
| Quadrant | BADHDUFLAG | Total packets | Discarded packets |
| A | 0 | 198 | 0 |
| B | 0 | 198 | 0 |
| C | 0 | 198 | 0 |
| D | 0 | 198 | 0 |
| Quadrant | Total seconds | Saturated seconds | Saturation percentage |
|---|---|---|---|
| A | 9710 | 493 | 5.077240% |
| B | 9711 | 505 | 5.200288% |
| C | 9711 | 273 | 2.811245% |
| D | 9711 | 693 | 7.136237% |
Noise dominated data is calculated using 1-second bins in cleaned event files. If a bin has >2000 counts, and if more than 50% of those come from <1% of pixels, then it is considered to be noise-dominated and hence unusable.
| Quadrant | # 1 sec bins | Bins with >0 counts | Bins with >2000 counts | High rate bins dominated by noise | Noise dominated (total time) | Noise dominated (detector-on time) | Marked lightcurve |
|---|---|---|---|---|---|---|---|
| A | 10076 | 9711 | 0 | 0 | 0.00% | 0.00% |  |
| B | 10076 | 9711 | 0 | 0 | 0.00% | 0.00% |  |
| C | 10076 | 9711 | 0 | 0 | 0.00% | 0.00% |  |
| D | 10076 | 9708 | 0 | 0 | 0.00% | 0.00% |  |
Top three noisy pixels from each quadrant. If the there are fewer than three noisy pixels in the level2.evt file, extra rows are filled as -1
| Pixel properties | Quadrant properties | ||||||
|---|---|---|---|---|---|---|---|
| Quadrant | DetID | PixID | Counts | Sigma | Mean | Median | Sigma |
| A | 0 | 29 | 516 | 10.22 | 137 | 128 | 38.0 |
| A | 14 | 188 | 511 | 10.09 | 137 | 128 | 38.0 |
| A | 14 | 204 | 474 | 9.12 | 137 | 128 | 38.0 |
| B | 2 | 9 | 488 | 11.66 | 137 | 129 | 30.8 |
| B | 2 | 8 | 369 | 7.79 | 137 | 129 | 30.8 |
| B | 5 | 128 | 367 | 7.73 | 137 | 129 | 30.8 |
| C | 1 | 81 | 395 | 6.97 | 140 | 129 | 38.1 |
| C | 1 | 80 | 394 | 6.95 | 140 | 129 | 38.1 |
| C | 2 | 191 | 389 | 6.82 | 140 | 129 | 38.1 |
| D | 11 | 82 | 361 | 6.72 | 128 | 116 | 36.4 |
| D | 1 | 19 | 346 | 6.31 | 128 | 116 | 36.4 |
| D | 6 | 83 | 339 | 6.12 | 128 | 116 | 36.4 |
Histogram calculated using DETX and DETY for each event in the final _common_clean file
| Quadrant A |  |
 |
Quadrant B |
|---|---|---|---|
| Quadrant D |  |
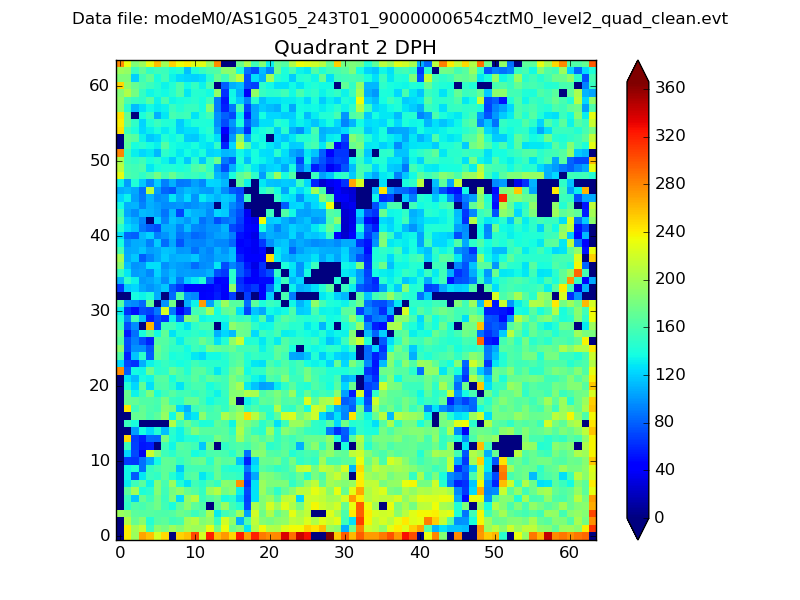 |
Quadrant C |
| Plot type | Count rate plots | Images |
|---|---|---|
| Comparison with Poisson distribution Blue bars denote a histogram of data divided into 1 sec bins. Red curve is a Poisson curve with rate = median count rate of data. |
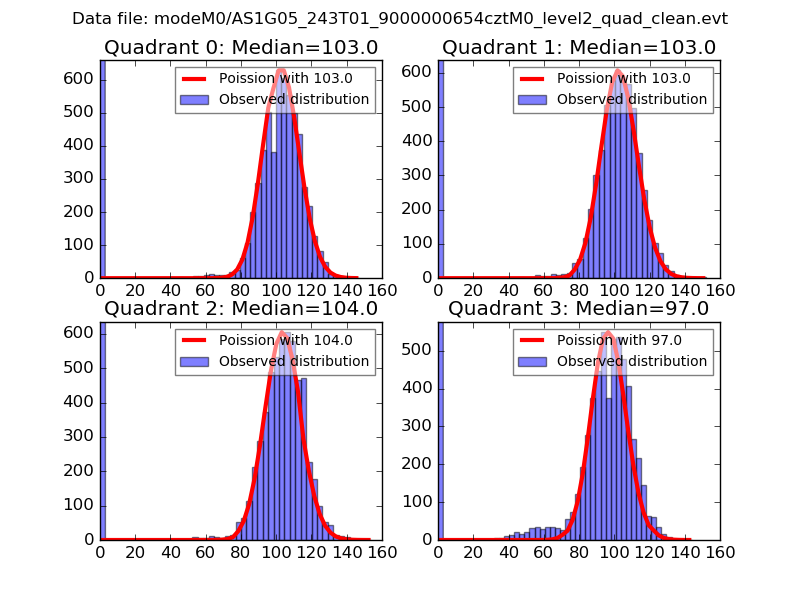 |
 |
| Quadrant-wise count rates Data is divided into 100 sec bins |
 |
|
| Module-wise count rates for Quadrant A Data is divided into 100 sec bins |
 |
 |
| Module-wise count rates for Quadrant B Data is divided into 100 sec bins |
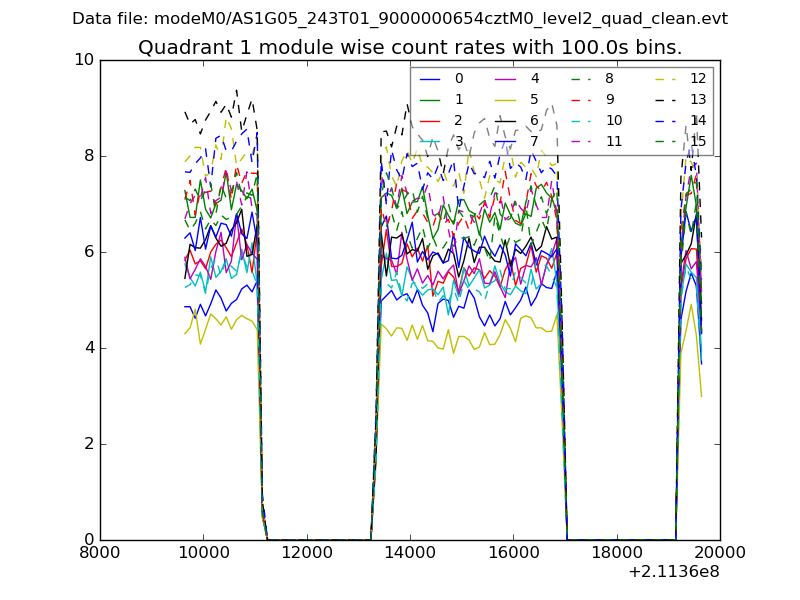 |
 |
| Module-wise count rates for Quadrant C Data is divided into 100 sec bins |
 |
 |
| Module-wise count rates for Quadrant D Data is divided into 100 sec bins |
 |
 |
| Parameter | Plot |
|---|---|
| CZT HV Monitor |  |
| D_VDD |  |
| Temperature 1 |  |
| Veto HV Monitor |  |
| Veto LLD |  |
| Alpha Counter |  |
| _CPM_Rate |  |
| CZT Counter |  |
| +2.5 Volts monitor |  |
| +5 Volts monitor |  |
| _ROLL_ROT | 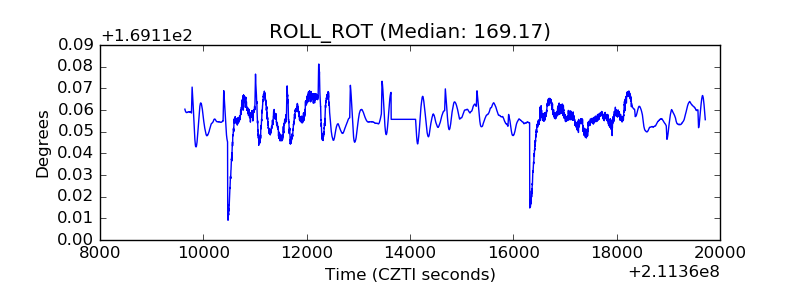 |
| _Roll_DEC |  |
| _Roll_RA |  |
| Veto Counter |  |