| Param | Original file | Final file |
|---|---|---|
| Filename | modeM0/AS1G05_243T01_9000000654_05187cztM0_level2.evt | modeM0/AS1G05_243T01_9000000654_05187cztM0_level2_quad_clean.evt |
| Size (bytes) | 444,150,720 | 64,595,520 |
| Size | 423.6 MB | 61.6 MB |
| Events in quadrant A | 2,889,830 | 388,734 |
| Events in quadrant B | 3,067,557 | 388,558 |
| Events in quadrant C | 2,829,665 | 393,221 |
| Events in quadrant D | 4,249,910 | 360,258 |
| Mode M0 | |||
|---|---|---|---|
| Quadrant | BADHDUFLAG | Total packets | Discarded packets |
| A | 0 | 12854 | 2 |
| B | 0 | 13077 | 2 |
| C | 0 | 12743 | 0 |
| D | 0 | 16819 | 0 |
| Mode SS | |||
|---|---|---|---|
| Quadrant | BADHDUFLAG | Total packets | Discarded packets |
| A | 0 | 122 | 0 |
| B | 0 | 122 | 0 |
| C | 0 | 122 | 0 |
| D | 0 | 122 | 0 |
| Quadrant | Total seconds | Saturated seconds | Saturation percentage |
|---|---|---|---|
| A | 6083 | 312 | 5.129048% |
| B | 6083 | 298 | 4.898899% |
| C | 6084 | 166 | 2.728468% |
| D | 6084 | 513 | 8.431953% |
Noise dominated data is calculated using 1-second bins in cleaned event files. If a bin has >2000 counts, and if more than 50% of those come from <1% of pixels, then it is considered to be noise-dominated and hence unusable.
| Quadrant | # 1 sec bins | Bins with >0 counts | Bins with >2000 counts | High rate bins dominated by noise | Noise dominated (total time) | Noise dominated (detector-on time) | Marked lightcurve |
|---|---|---|---|---|---|---|---|
| A | 6084 | 6084 | 6 | 6 | 0.10% | 0.10% | 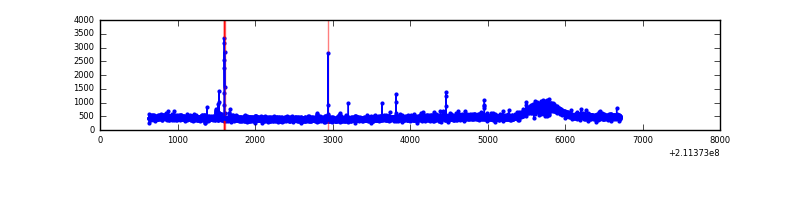 |
| B | 6084 | 6084 | 2 | 2 | 0.03% | 0.03% | 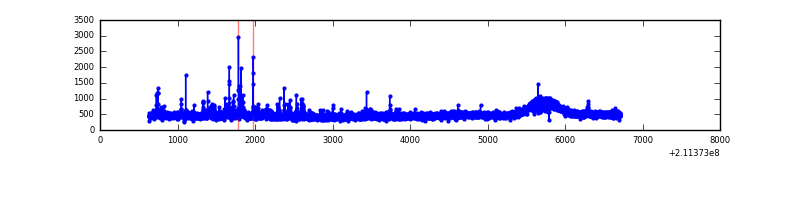 |
| C | 6084 | 6084 | 0 | 0 | 0.00% | 0.00% | 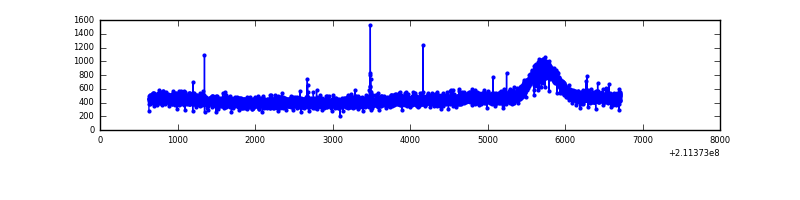 |
| D | 6084 | 6084 | 303 | 303 | 4.98% | 4.98% | 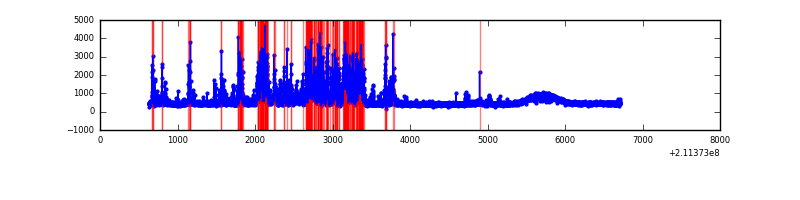 |
Top three noisy pixels from each quadrant. If the there are fewer than three noisy pixels in the level2.evt file, extra rows are filled as -1
| Pixel properties | Quadrant properties | ||||||
|---|---|---|---|---|---|---|---|
| Quadrant | DetID | PixID | Counts | Sigma | Mean | Median | Sigma |
| A | 0 | 50 | 35072 | 223.68 | 734 | 716 | 153.6 |
| A | 0 | 247 | 25659 | 162.4 | 734 | 716 | 153.6 |
| A | 0 | 226 | 9370 | 56.34 | 734 | 716 | 153.6 |
| B | 4 | 80 | 71360 | 486.61 | 742 | 722 | 145.2 |
| B | 15 | 204 | 69047 | 470.68 | 742 | 722 | 145.2 |
| B | 15 | 54 | 16545 | 109.0 | 742 | 722 | 145.2 |
| C | 1 | 16 | 10423 | 57.62 | 720 | 725 | 168.3 |
| C | 12 | 4 | 5907 | 30.79 | 720 | 725 | 168.3 |
| C | 13 | 61 | 5814 | 30.24 | 720 | 725 | 168.3 |
| D | 14 | 34 | 752064 | 4240.89 | 711 | 687 | 177.2 |
| D | 2 | 136 | 482395 | 2718.84 | 711 | 687 | 177.2 |
| D | 2 | 33 | 135523 | 761.04 | 711 | 687 | 177.2 |
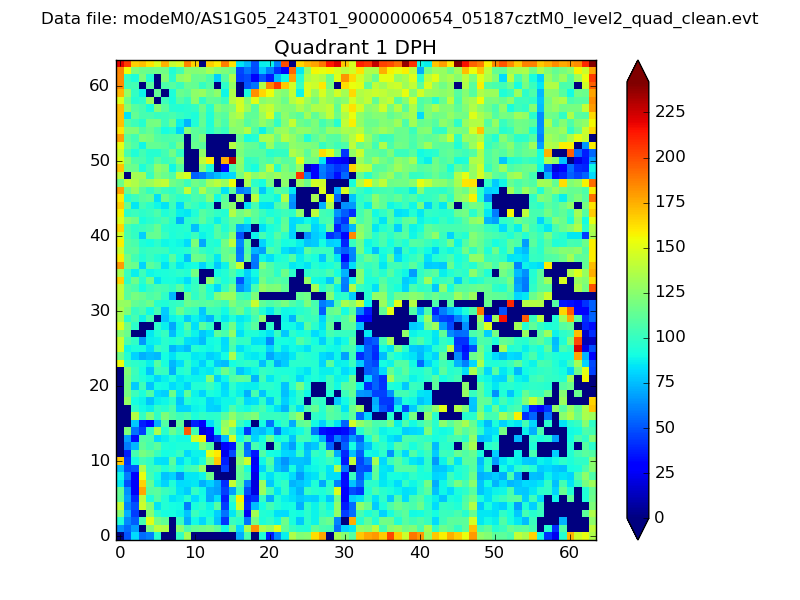
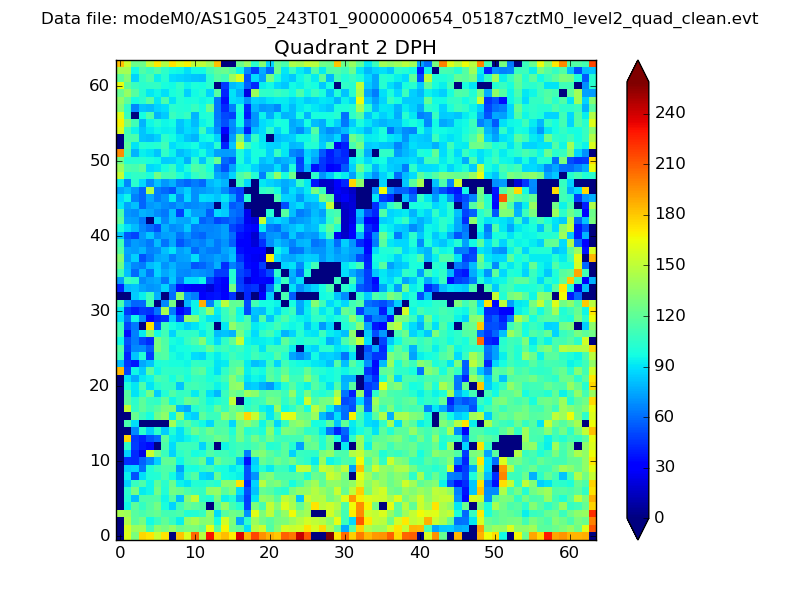
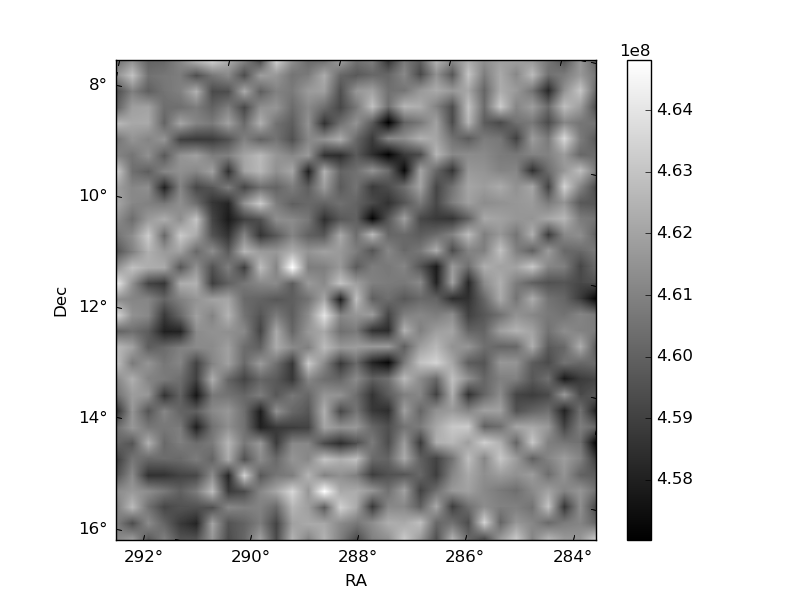
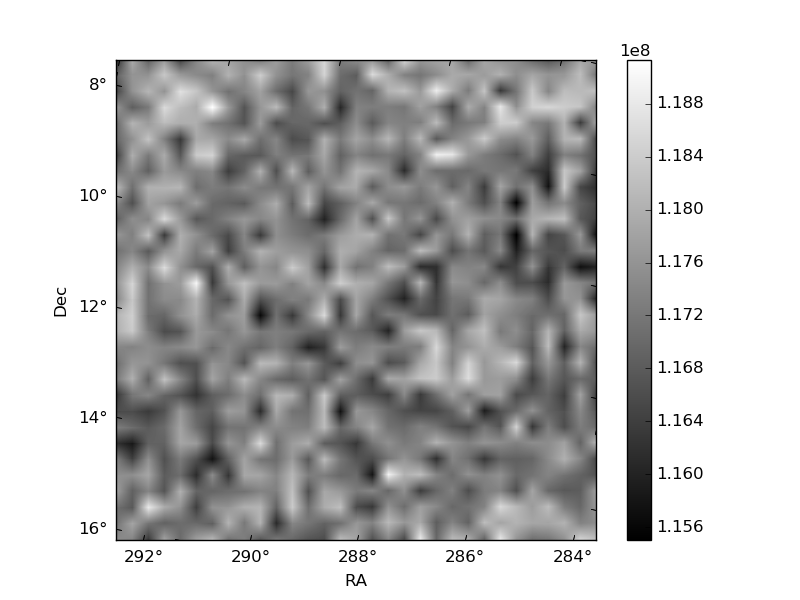
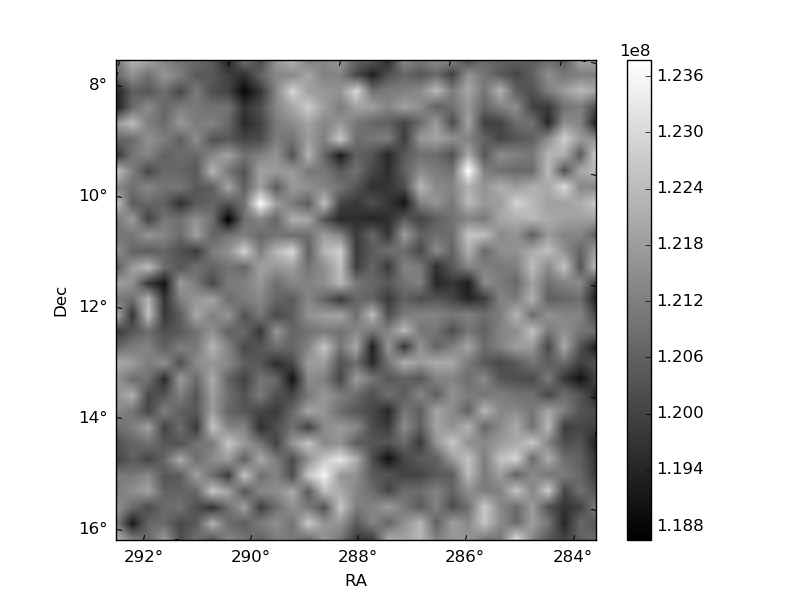
Histogram calculated using DETX and DETY for each event in the final _common_clean file
| Quadrant A |  |
 |
Quadrant B |
|---|---|---|---|
| Quadrant D | 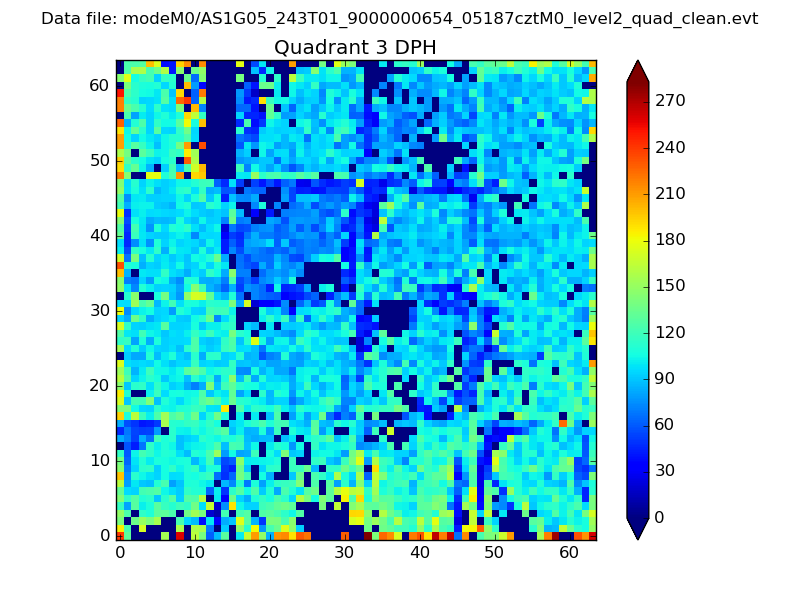 |
 |
Quadrant C |
| Plot type | Count rate plots | Images |
|---|---|---|
| Comparison with Poisson distribution Blue bars denote a histogram of data divided into 1 sec bins. Red curve is a Poisson curve with rate = median count rate of data. |
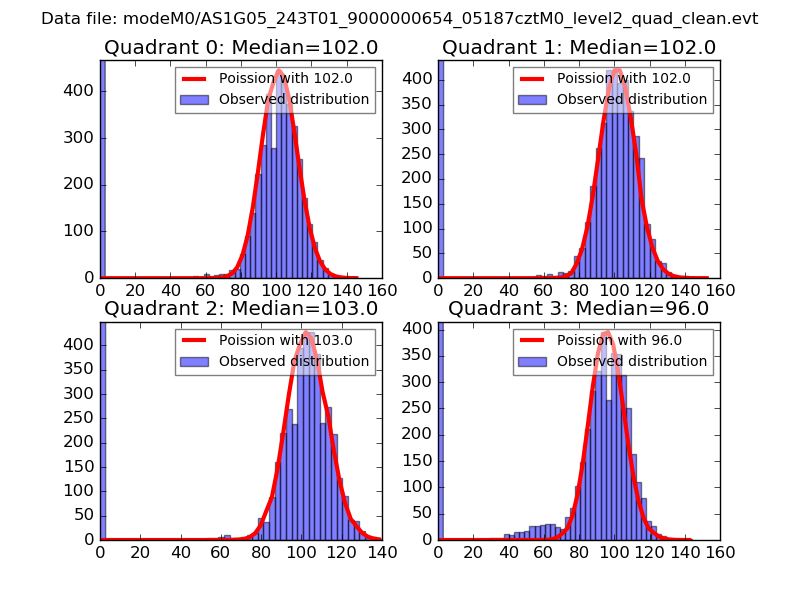 |
 |
| Quadrant-wise count rates Data is divided into 100 sec bins |
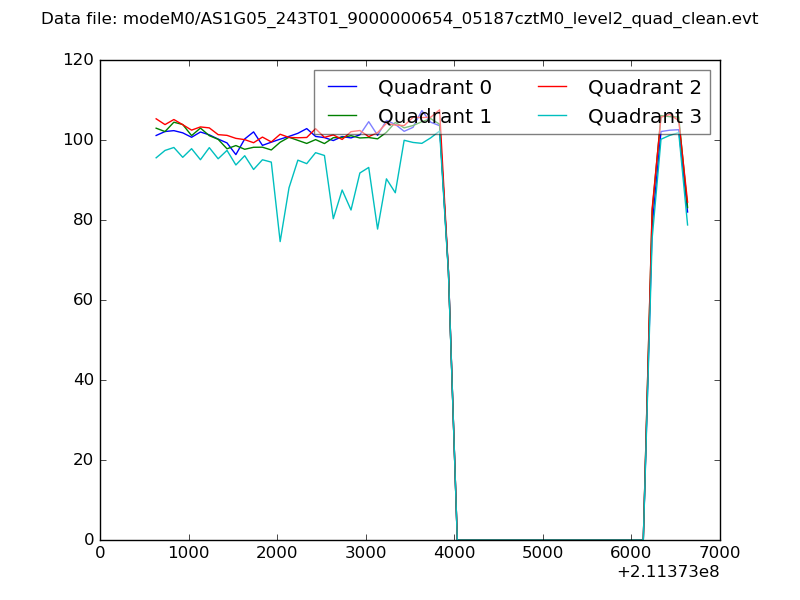 |
|
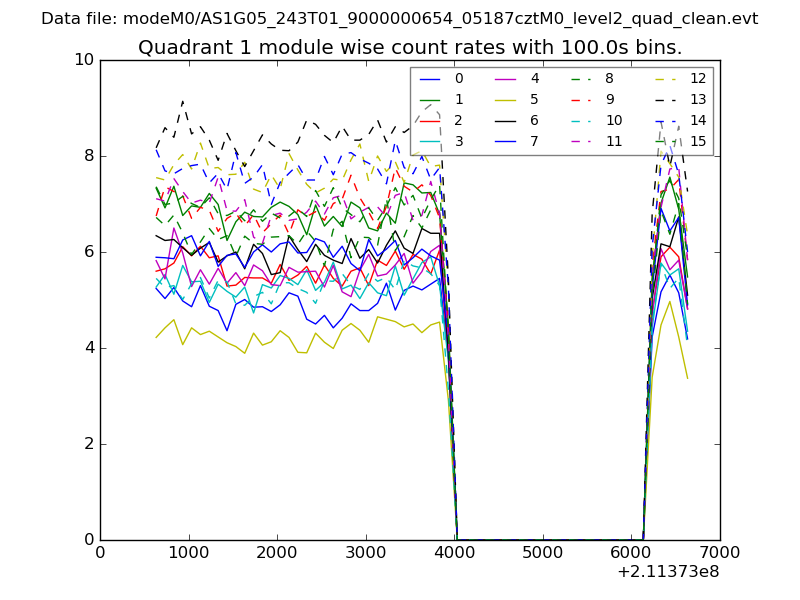
| Module-wise count rates for Quadrant A Data is divided into 100 sec bins |
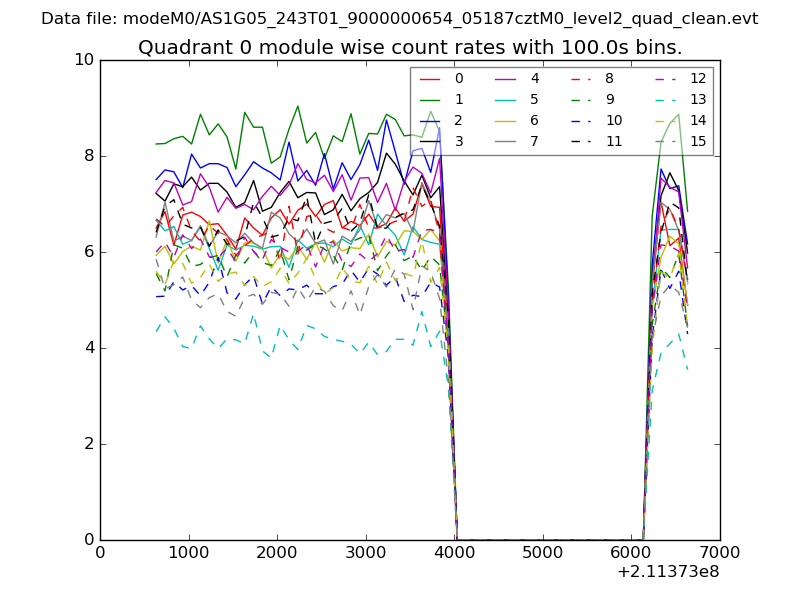 |
 |
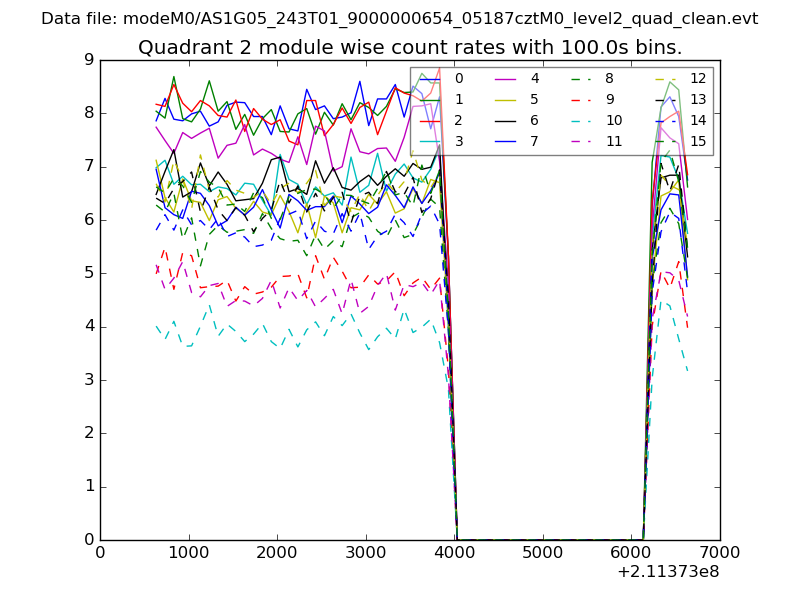
| Module-wise count rates for Quadrant B Data is divided into 100 sec bins |
 |
 |
| Module-wise count rates for Quadrant C Data is divided into 100 sec bins |
 |
 |
| Module-wise count rates for Quadrant D Data is divided into 100 sec bins |
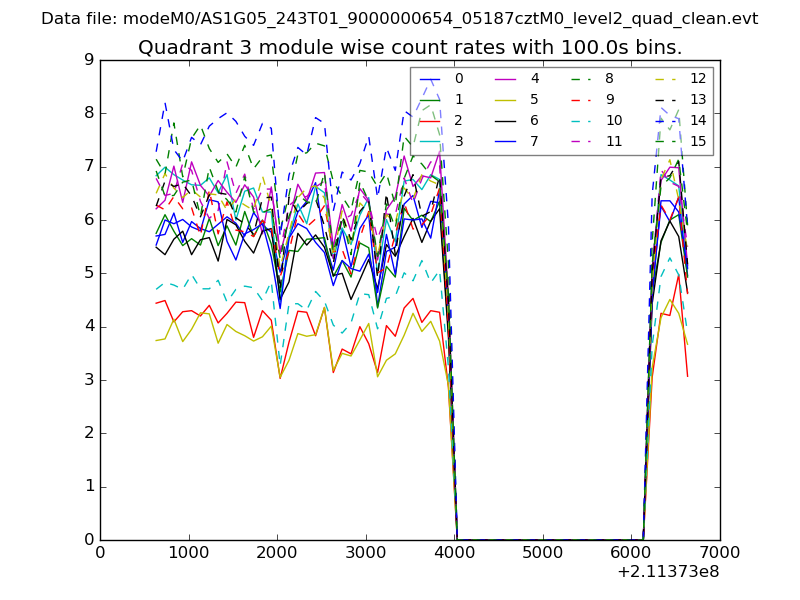 |
 |
| Parameter | Plot |
|---|---|
| CZT HV Monitor | 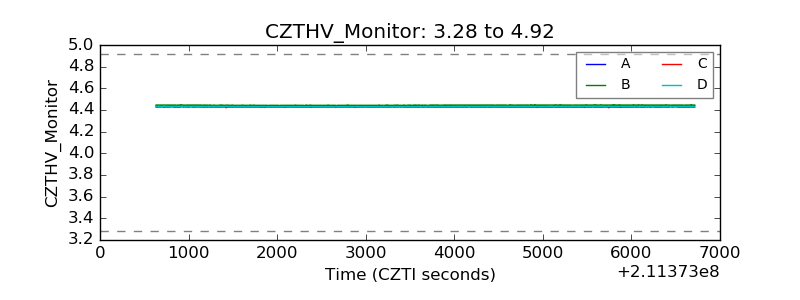 |
| D_VDD | 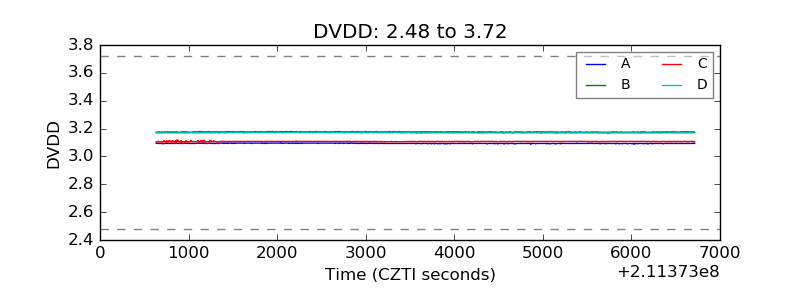 |
| Temperature 1 | 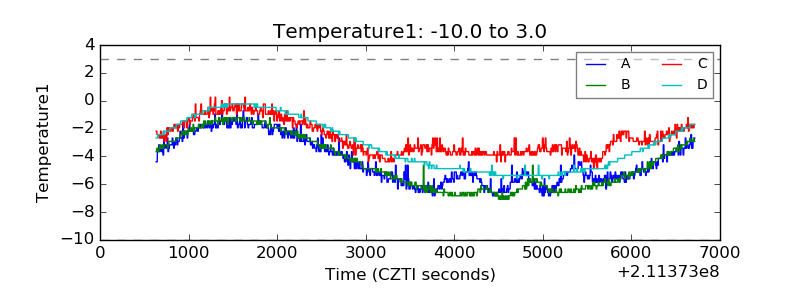 |
| Veto HV Monitor | 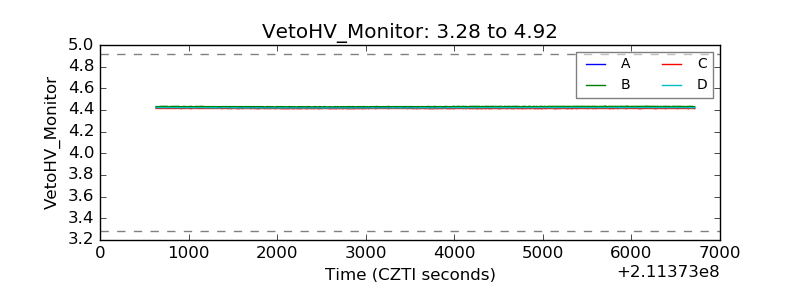 |
| Veto LLD | 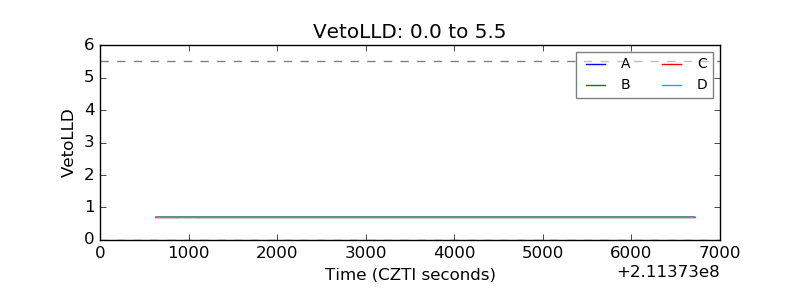 |
| Alpha Counter | 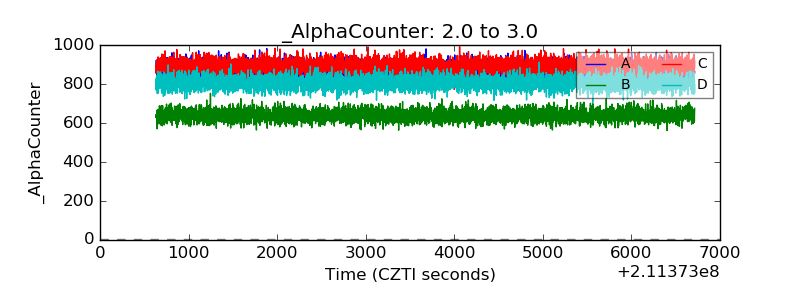 |
| _CPM_Rate | 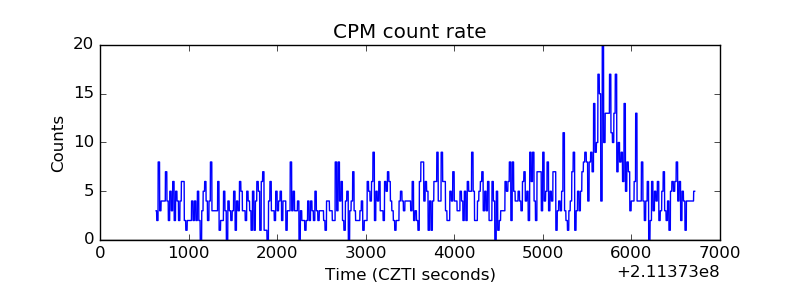 |
| CZT Counter | 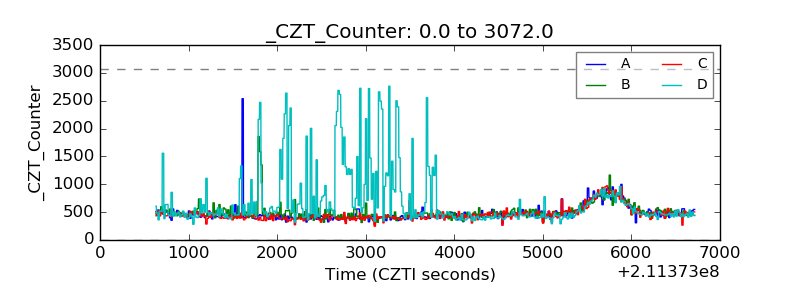 |
| +2.5 Volts monitor |  |
| +5 Volts monitor |  |
| _ROLL_ROT | 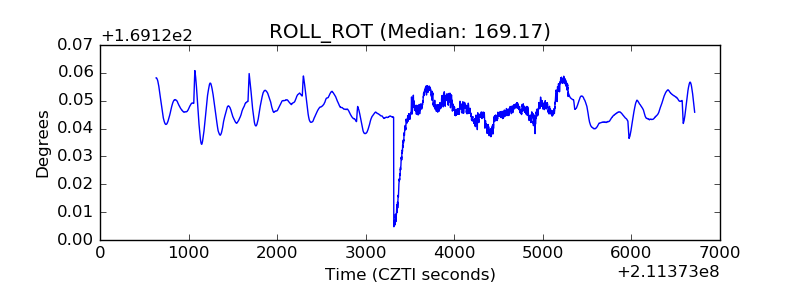 |
| _Roll_DEC | 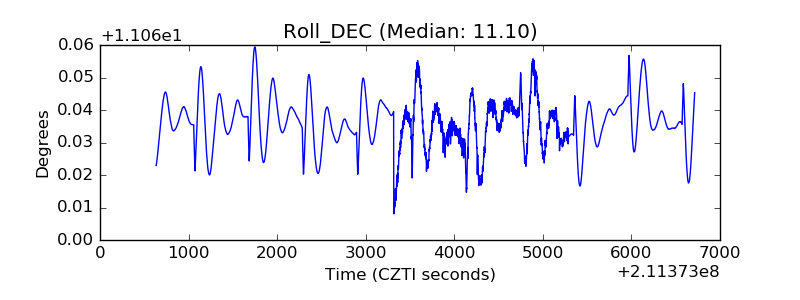 |
| _Roll_RA | 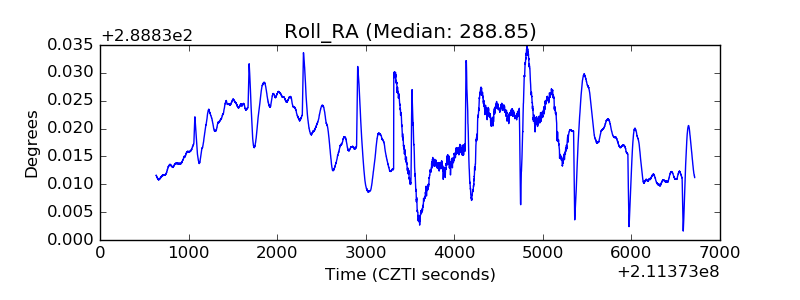 |
| Veto Counter | 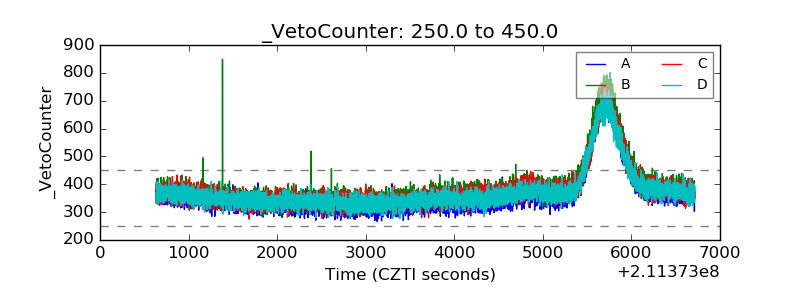 |