| Param | Original file | Final file |
|---|---|---|
| Filename | modeM0/AS1G05_152T02_9000000658cztM0_level2.fits | modeM0/AS1G05_152T02_9000000658cztM0_level2_quad_clean.evt |
| Size (bytes) | 180,469,440 | 208,442,880 |
| Size | 172.1 MB | 198.8 MB |
| Events in quadrant A | 1,059,818 | 1,266,546 |
| Events in quadrant B | 1,037,766 | 1,276,412 |
| Events in quadrant C | 1,050,004 | 1,228,448 |
| Events in quadrant D | 912,836 | 1,137,676 |
| Mode M0 | |||
|---|---|---|---|
| Quadrant | BADHDUFLAG | Total packets | Discarded packets |
| A | 0 | 42281 | 0 |
| B | 0 | 41898 | 0 |
| C | 0 | 41428 | 0 |
| D | 0 | 42833 | 0 |
| Mode M9 | |||
|---|---|---|---|
| Quadrant | BADHDUFLAG | Total packets | Discarded packets |
| A | 1 | 139927986231336 | 139925739536430 |
| B | 1 | 139927986231336 | 139925739536430 |
| C | 1 | 139927986231336 | 139925739536430 |
| D | 1 | 139927986231336 | 139925739536430 |
| Mode SS | |||
|---|---|---|---|
| Quadrant | BADHDUFLAG | Total packets | Discarded packets |
| A | 0 | 454 | 0 |
| B | 0 | 448 | 0 |
| C | 0 | 459 | 0 |
| D | 0 | 426 | 0 |
| Quadrant | Total seconds | Saturated seconds | Saturation percentage |
|---|---|---|---|
| A | 20283 | 327 | 1.612188% |
| B | 20287 | 295 | 1.454133% |
| C | 20254 | 209 | 1.031895% |
| D | 20254 | 318 | 1.570060% |
Noise dominated data is calculated using 1-second bins in cleaned event files. If a bin has >2000 counts, and if more than 50% of those come from <1% of pixels, then it is considered to be noise-dominated and hence unusable.
| Quadrant | # 1 sec bins | Bins with >0 counts | Bins with >2000 counts | High rate bins dominated by noise | Noise dominated (total time) | Noise dominated (detector-on time) | Marked lightcurve |
|---|---|---|---|---|---|---|---|
| A | 28090 | 21152 | 0 | 0 | 0.00% | 0.00% |  |
| B | 28090 | 21137 | 0 | 0 | 0.00% | 0.00% |  |
| C | 28088 | 21110 | 0 | 0 | 0.00% | 0.00% |  |
| D | 28090 | 21121 | 0 | 0 | 0.00% | 0.00% |  |
Top three noisy pixels from each quadrant. If the there are fewer than three noisy pixels in the level2.evt file, extra rows are filled as -1
| Pixel properties | Quadrant properties | ||||||
|---|---|---|---|---|---|---|---|
| Quadrant | DetID | PixID | Counts | Sigma | Mean | Median | Sigma |
| A | 14 | 188 | 994 | 10.16 | 274 | 254 | 72.8 |
| A | 0 | 29 | 964 | 9.75 | 274 | 254 | 72.8 |
| A | 14 | 204 | 924 | 9.2 | 274 | 254 | 72.8 |
| B | 2 | 9 | 879 | 10.57 | 272 | 257 | 58.9 |
| B | 14 | 254 | 760 | 8.55 | 272 | 257 | 58.9 |
| B | 3 | 17 | 723 | 7.92 | 272 | 257 | 58.9 |
| C | 12 | 241 | 789 | 7.03 | 276 | 254 | 76.1 |
| C | 2 | 191 | 765 | 6.72 | 276 | 254 | 76.1 |
| C | 7 | 111 | 746 | 6.47 | 276 | 254 | 76.1 |
| D | 11 | 82 | 730 | 7.03 | 259 | 235 | 70.5 |
| D | 6 | 231 | 711 | 6.76 | 259 | 235 | 70.5 |
| D | 3 | 14 | 695 | 6.53 | 259 | 235 | 70.5 |
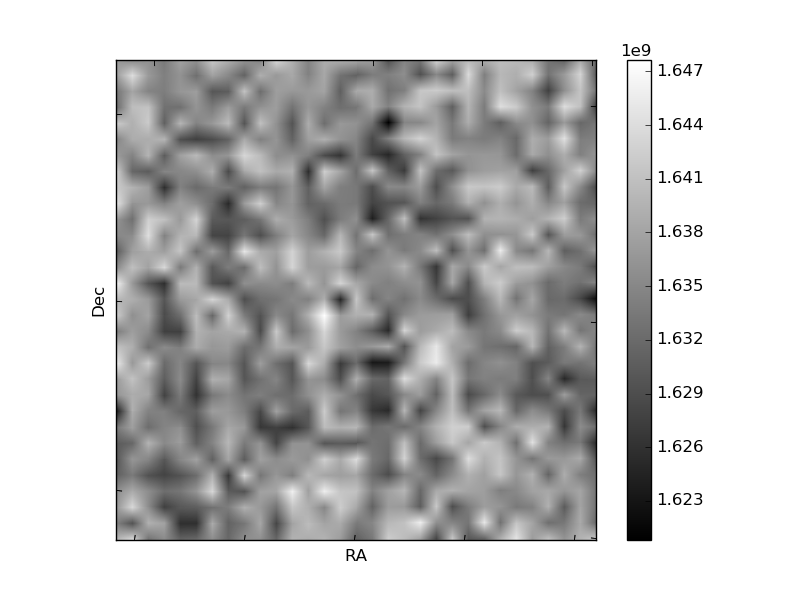
Histogram calculated using DETX and DETY for each event in the final _common_clean file
| Quadrant A |  |
 |
Quadrant B |
|---|---|---|---|
| Quadrant D |  |
 |
Quadrant C |
| Plot type | Count rate plots | Images |
|---|---|---|
| Comparison with Poisson distribution Blue bars denote a histogram of data divided into 1 sec bins. Red curve is a Poisson curve with rate = median count rate of data. |
 |
 |
| Quadrant-wise count rates Data is divided into 100 sec bins |
 |
|
| Module-wise count rates for Quadrant A Data is divided into 100 sec bins |
 |
 |
| Module-wise count rates for Quadrant B Data is divided into 100 sec bins |
 |
 |
| Module-wise count rates for Quadrant C Data is divided into 100 sec bins |
 |
 |
| Module-wise count rates for Quadrant D Data is divided into 100 sec bins |
 |
 |
| Parameter | Plot |
|---|---|
| CZT HV Monitor |  |
| D_VDD |  |
| Temperature 1 |  |
| Veto HV Monitor |  |
| Veto LLD |  |
| Alpha Counter |  |
| _CPM_Rate |  |
| CZT Counter |  |
| +2.5 Volts monitor |  |
| +5 Volts monitor |  |
| _ROLL_ROT |  |
| _Roll_DEC |  |
| _Roll_RA |  |
| Veto Counter | 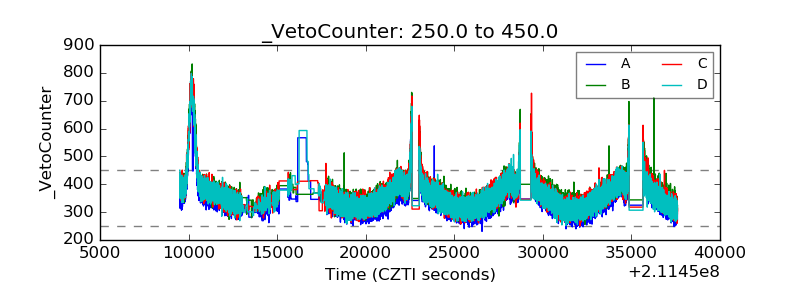 |