| Param | Original file | Final file |
|---|---|---|
| Filename | modeM0/AS1G05_152T02_9000000658_05200cztM0_level2.evt | modeM0/AS1G05_152T02_9000000658_05200cztM0_level2_quad_clean.evt |
| Size (bytes) | 87,258,240 | 4,970,880 |
| Size | 83.2 MB | 4.7 MB |
| Events in quadrant A | 655,603 | 15,683 |
| Events in quadrant B | 649,394 | 16,202 |
| Events in quadrant C | 641,268 | 15,906 |
| Events in quadrant D | 614,860 | 15,373 |
| Mode M0 | |||
|---|---|---|---|
| Quadrant | BADHDUFLAG | Total packets | Discarded packets |
| A | 0 | 5331 | 2651 |
| B | 0 | 5290 | 2653 |
| C | 0 | 5342 | 2727 |
| D | 0 | 5369 | 2809 |
| Mode SS | |||
|---|---|---|---|
| Quadrant | BADHDUFLAG | Total packets | Discarded packets |
| A | 0 | 46 | 24 |
| B | 0 | 46 | 28 |
| C | 0 | 46 | 16 |
| D | 0 | 45 | 23 |
| Quadrant | Total seconds | Saturated seconds | Saturation percentage |
|---|---|---|---|
| A | 1158 | 169 | 14.594128% |
| B | 1146 | 153 | 13.350785% |
| C | 1134 | 122 | 10.758377% |
| D | 1118 | 114 | 10.196780% |
Noise dominated data is calculated using 1-second bins in cleaned event files. If a bin has >2000 counts, and if more than 50% of those come from <1% of pixels, then it is considered to be noise-dominated and hence unusable.
| Quadrant | # 1 sec bins | Bins with >0 counts | Bins with >2000 counts | High rate bins dominated by noise | Noise dominated (total time) | Noise dominated (detector-on time) | Marked lightcurve |
|---|---|---|---|---|---|---|---|
| A | 2339 | 1700 | 0 | 0 | 0.00% | 0.00% | 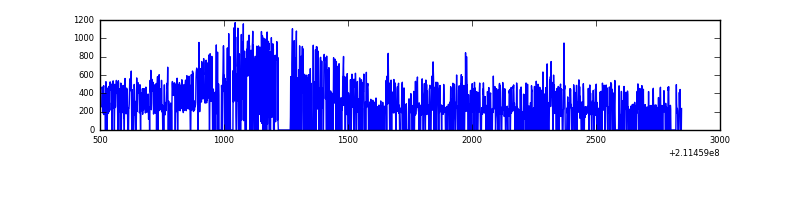 |
| B | 2341 | 1683 | 0 | 0 | 0.00% | 0.00% | 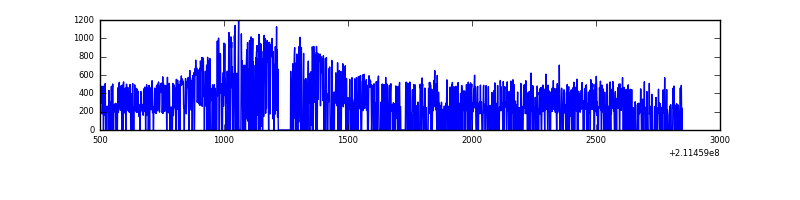 |
| C | 2339 | 1676 | 0 | 0 | 0.00% | 0.00% | 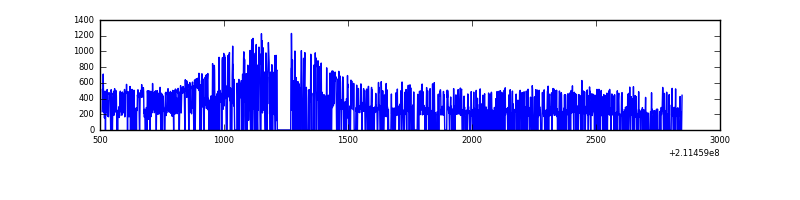 |
| D | 2342 | 1652 | 0 | 0 | 0.00% | 0.00% | 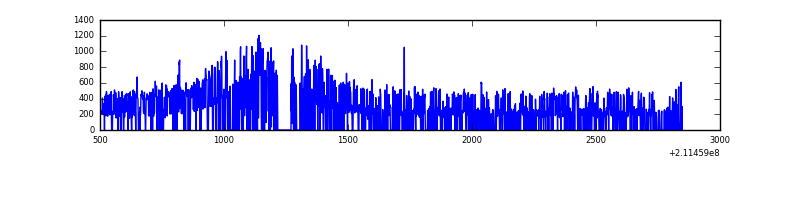 |
Top three noisy pixels from each quadrant. If the there are fewer than three noisy pixels in the level2.evt file, extra rows are filled as -1
| Pixel properties | Quadrant properties | ||||||
|---|---|---|---|---|---|---|---|
| Quadrant | DetID | PixID | Counts | Sigma | Mean | Median | Sigma |
| A | 4 | 2 | 21702 | 588.03 | 164 | 160 | 36.6 |
| A | 12 | 194 | 1656 | 40.84 | 164 | 160 | 36.6 |
| A | 0 | 226 | 1587 | 38.95 | 164 | 160 | 36.6 |
| B | 15 | 204 | 14673 | 409.21 | 164 | 159 | 35.5 |
| B | 12 | 111 | 3247 | 87.06 | 164 | 159 | 35.5 |
| B | 11 | 111 | 2665 | 70.65 | 164 | 159 | 35.5 |
| C | 1 | 16 | 7184 | 172.78 | 161 | 161 | 40.6 |
| C | 8 | 128 | 2273 | 51.96 | 161 | 161 | 40.6 |
| C | 13 | 61 | 1297 | 27.95 | 161 | 161 | 40.6 |
| D | 2 | 136 | 7870 | 183.51 | 158 | 152 | 42.1 |
| D | 2 | 63 | 7628 | 177.76 | 158 | 152 | 42.1 |
| D | 10 | 15 | 3816 | 87.12 | 158 | 152 | 42.1 |
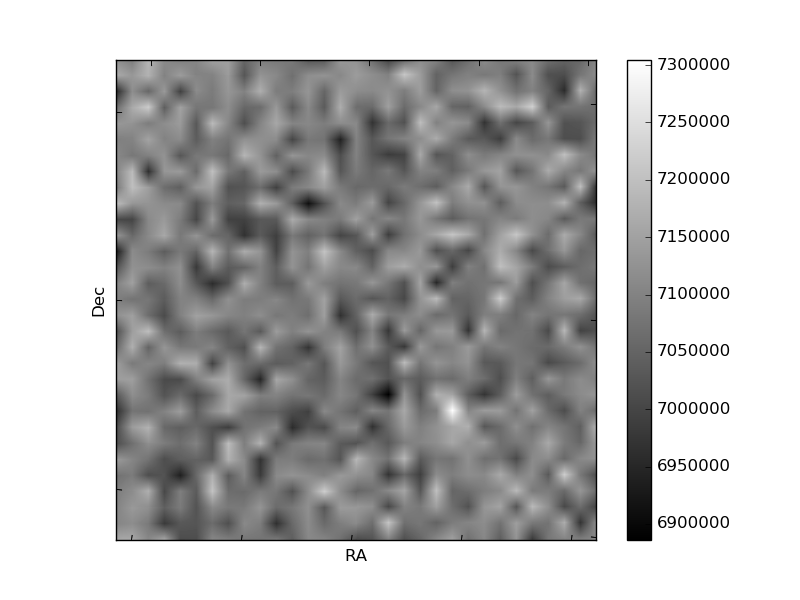
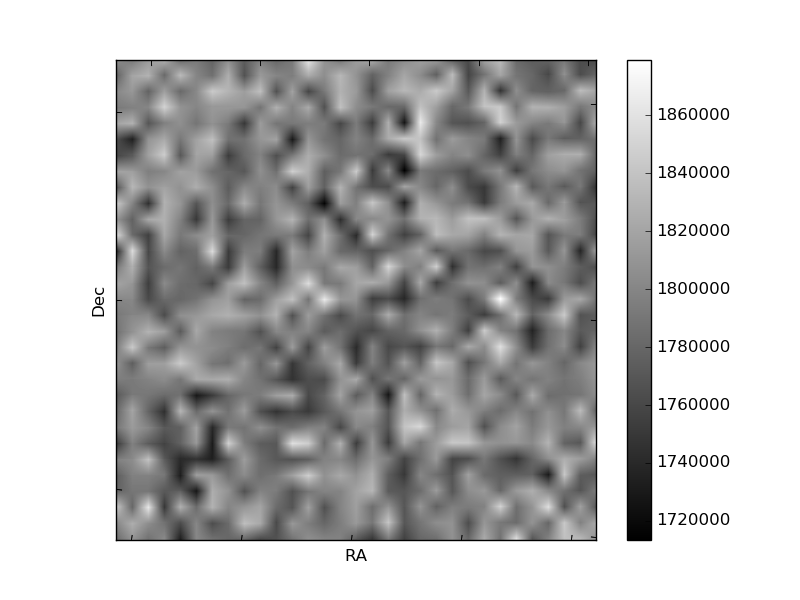
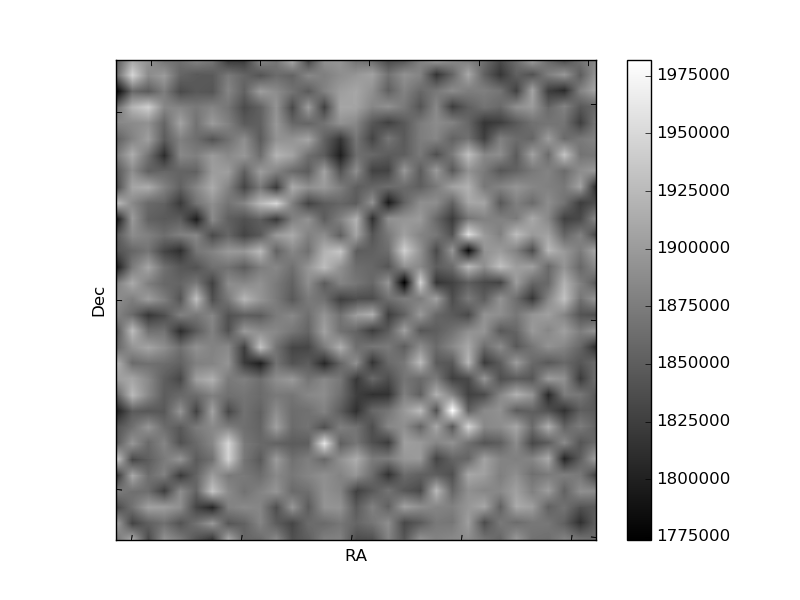
Histogram calculated using DETX and DETY for each event in the final _common_clean file
| Quadrant A | 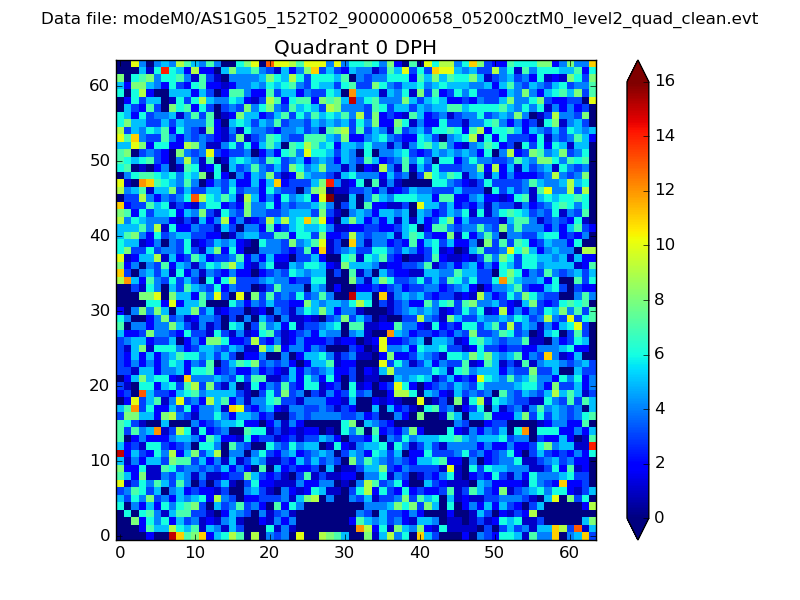 |
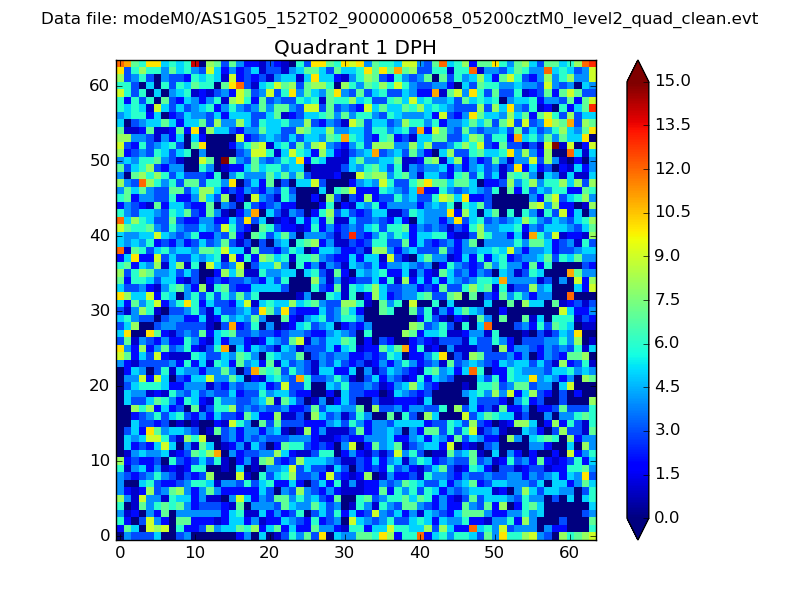 |
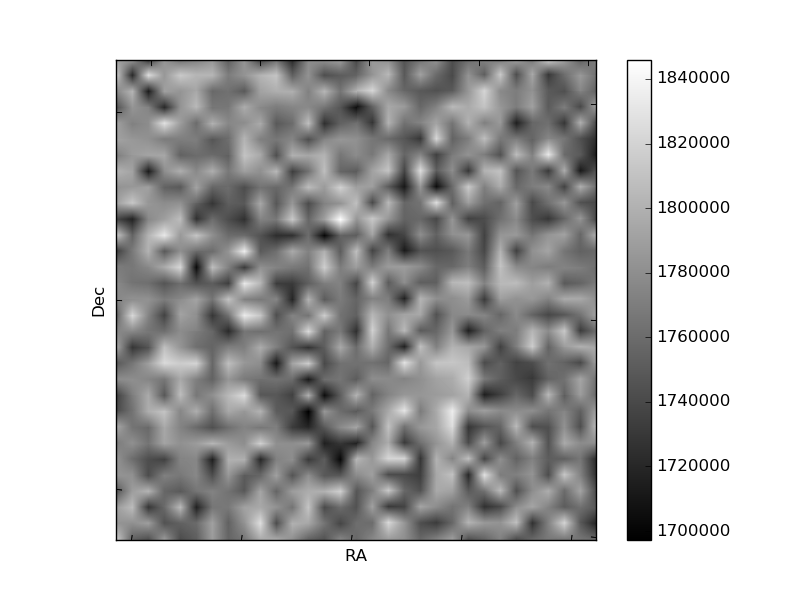
Quadrant B |
|---|---|---|---|
| Quadrant D | 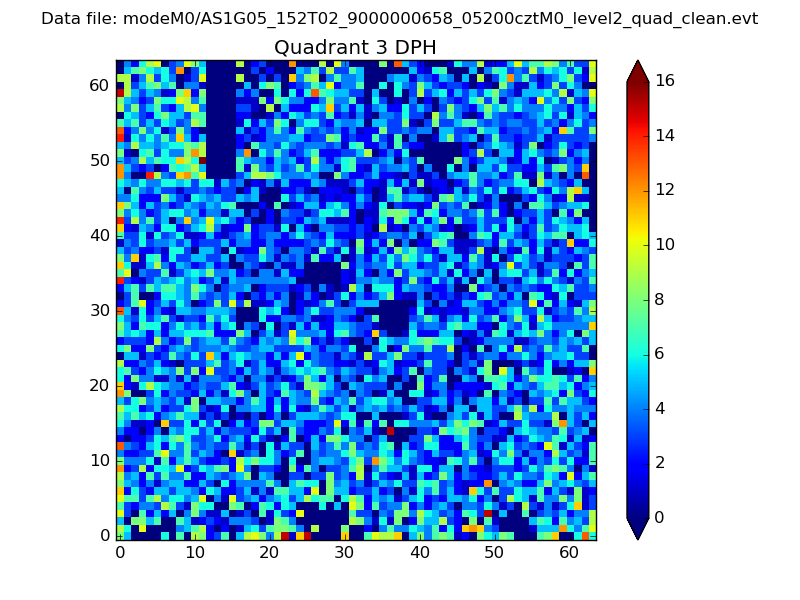 |
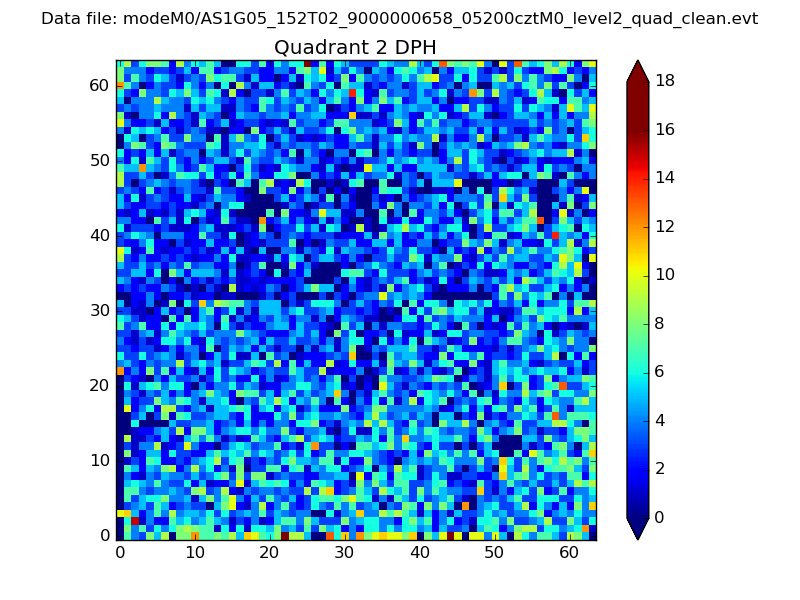 |
Quadrant C |
| Plot type | Count rate plots | Images |
|---|---|---|
| Comparison with Poisson distribution Blue bars denote a histogram of data divided into 1 sec bins. Red curve is a Poisson curve with rate = median count rate of data. |
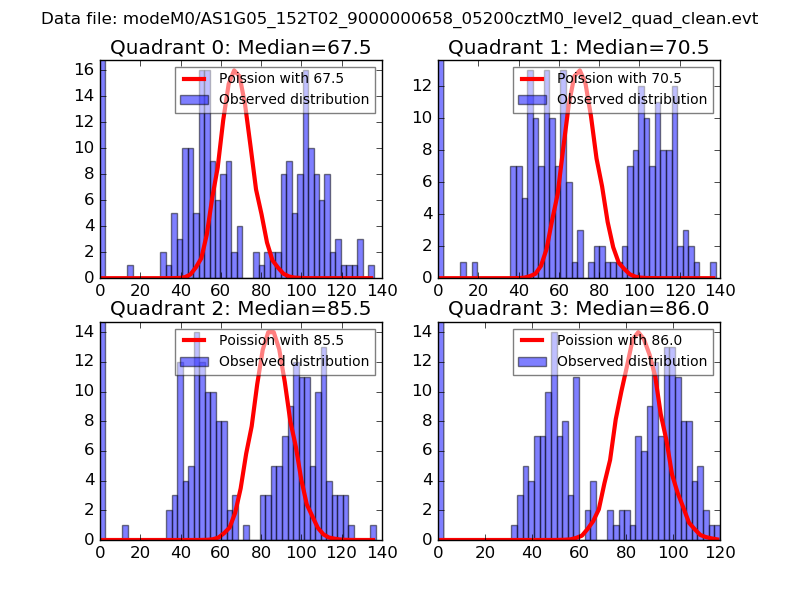 |
 |
| Quadrant-wise count rates Data is divided into 100 sec bins |
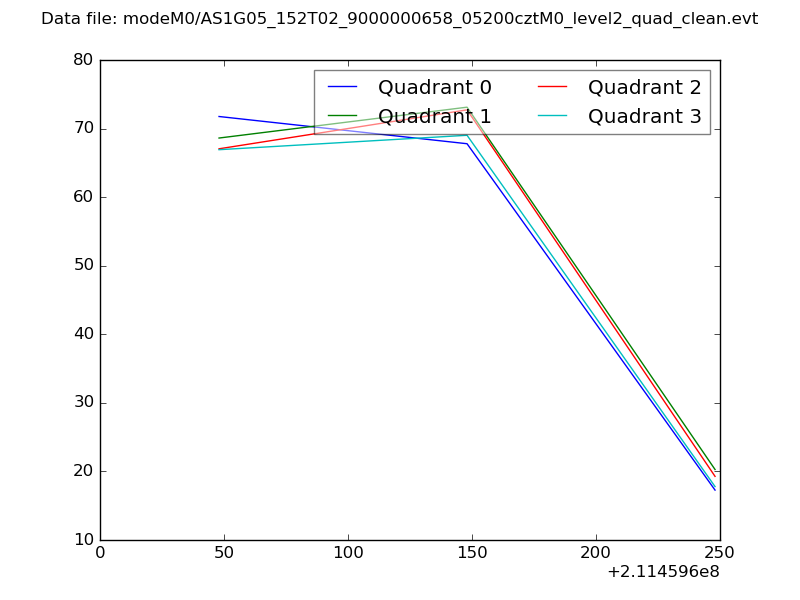 |
|
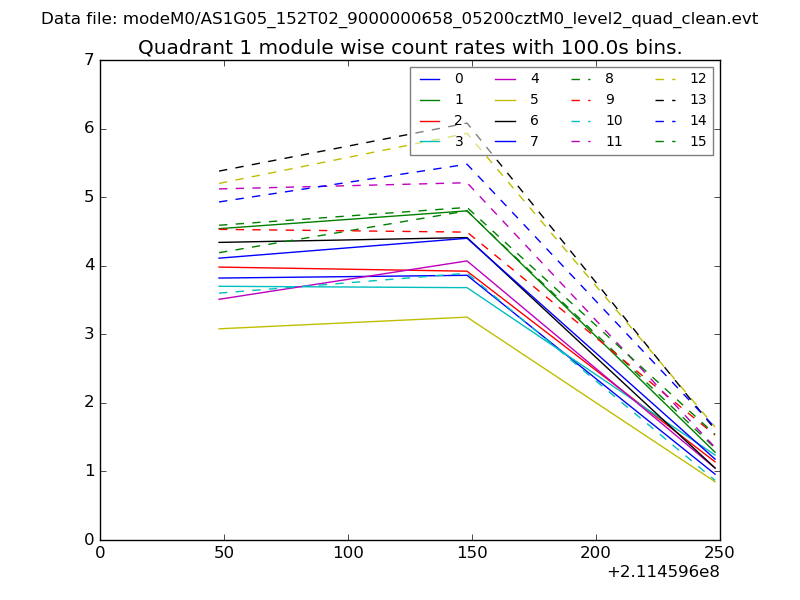
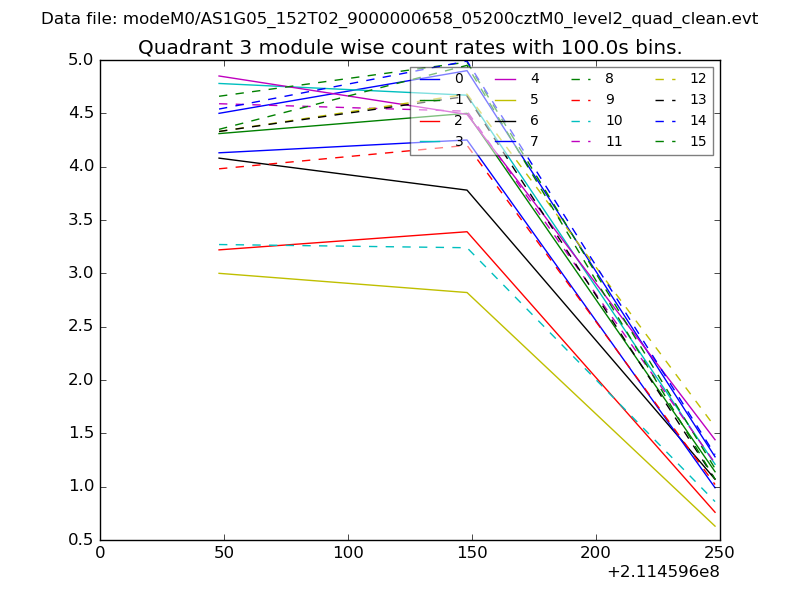
| Module-wise count rates for Quadrant A Data is divided into 100 sec bins |
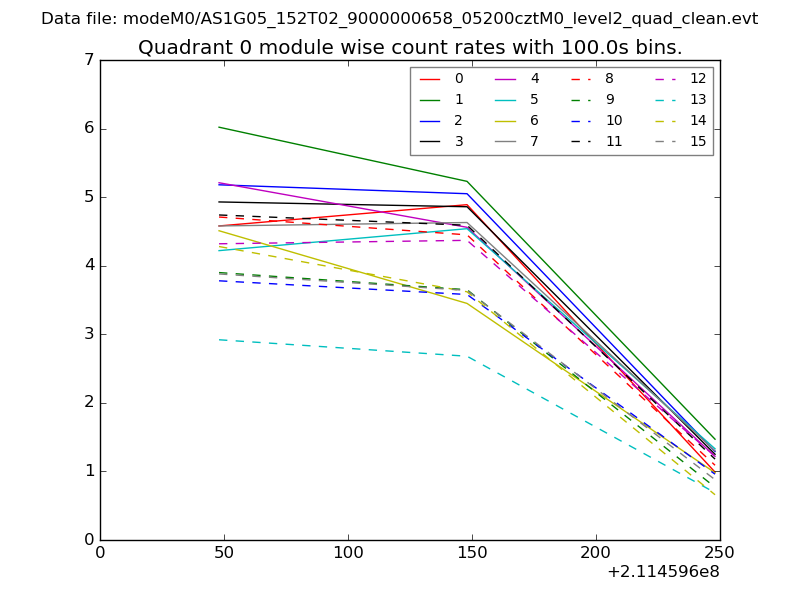 |
 |
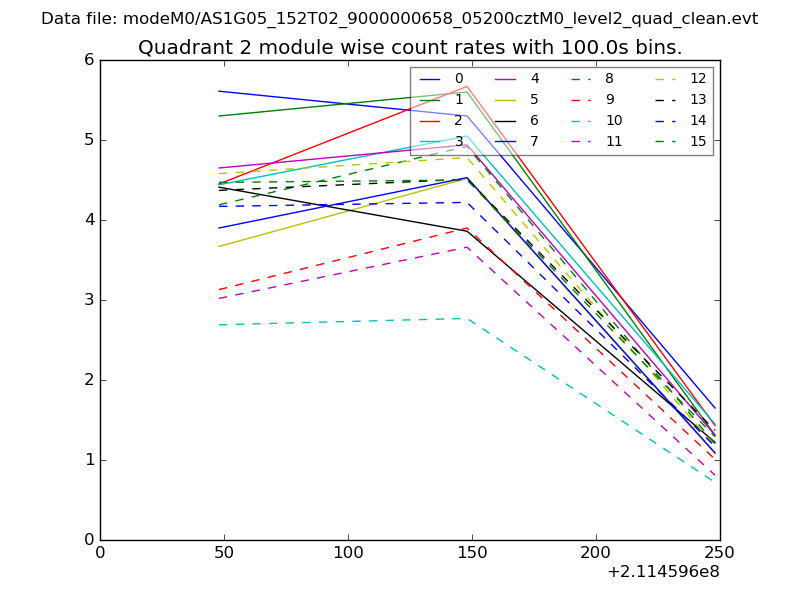
| Module-wise count rates for Quadrant B Data is divided into 100 sec bins |
 |
 |
| Module-wise count rates for Quadrant C Data is divided into 100 sec bins |
 |
 |
| Module-wise count rates for Quadrant D Data is divided into 100 sec bins |
 |
 |
| Parameter | Plot |
|---|---|
| CZT HV Monitor | 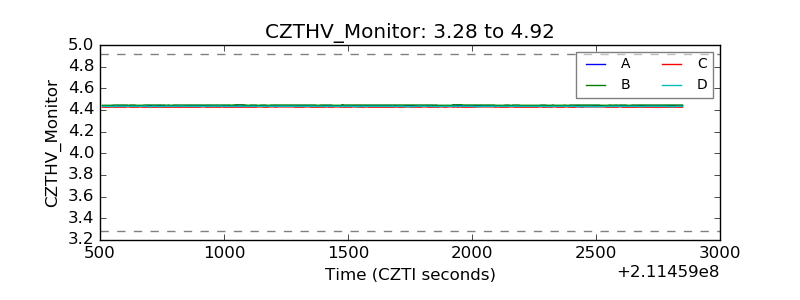 |
| D_VDD | 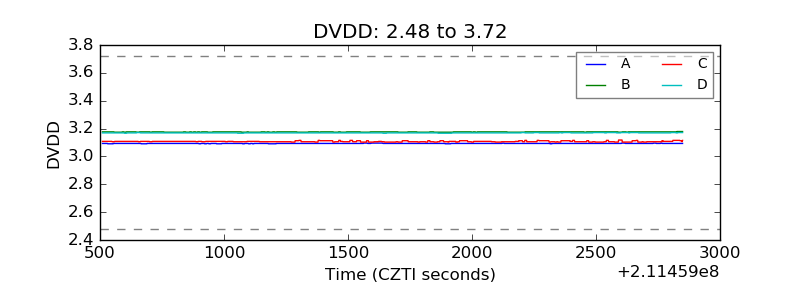 |
| Temperature 1 | 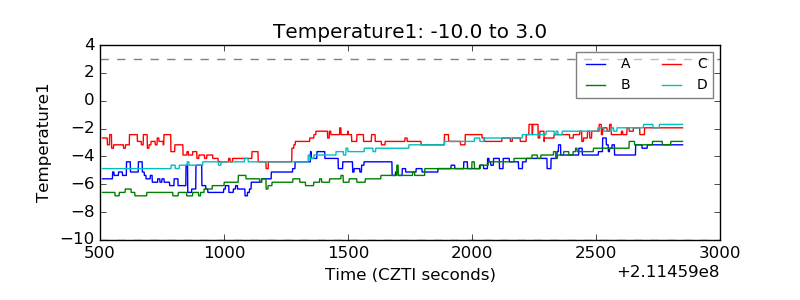 |
| Veto HV Monitor | 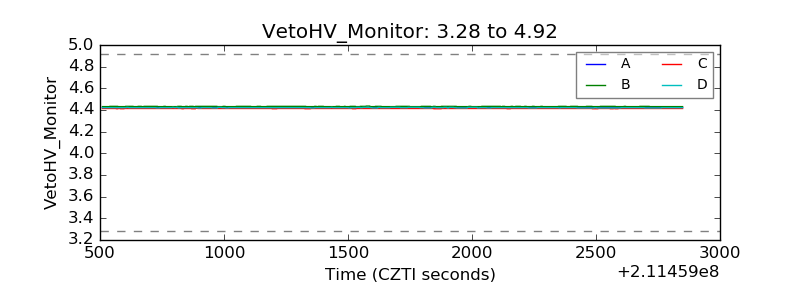 |
| Veto LLD | 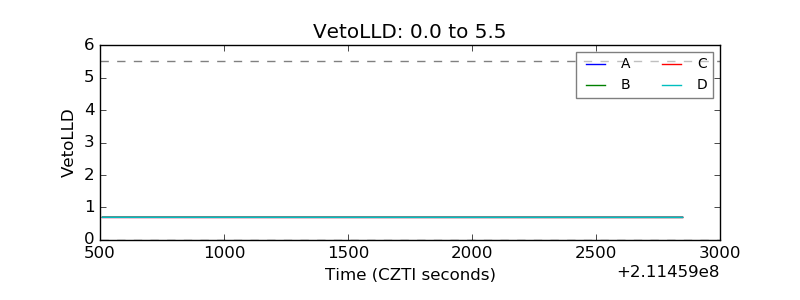 |
| Alpha Counter | 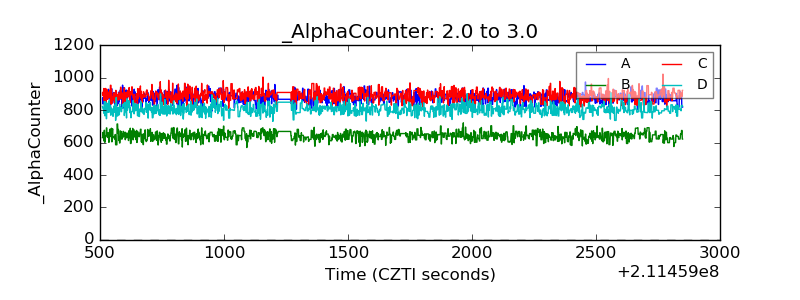 |
| _CPM_Rate | 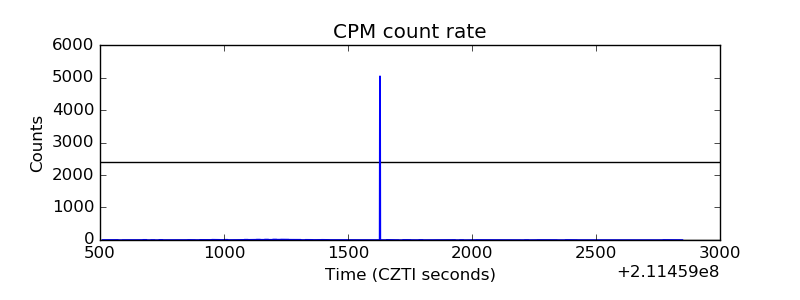 |
| CZT Counter | 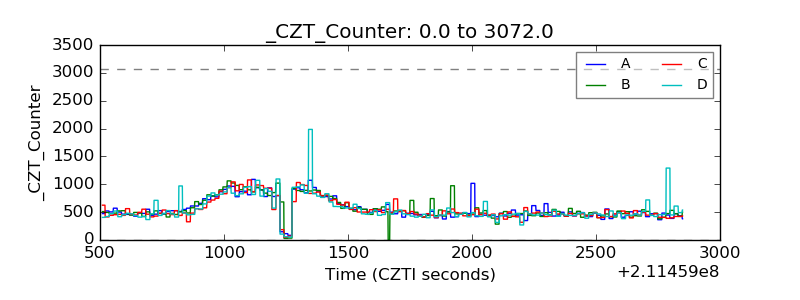 |
| +2.5 Volts monitor |  |
| +5 Volts monitor |  |
| _ROLL_ROT | 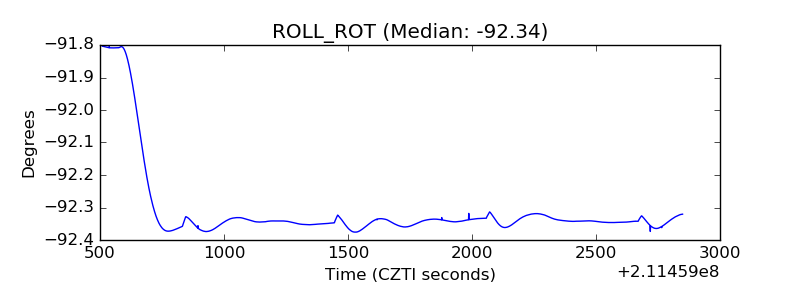 |
| _Roll_DEC | 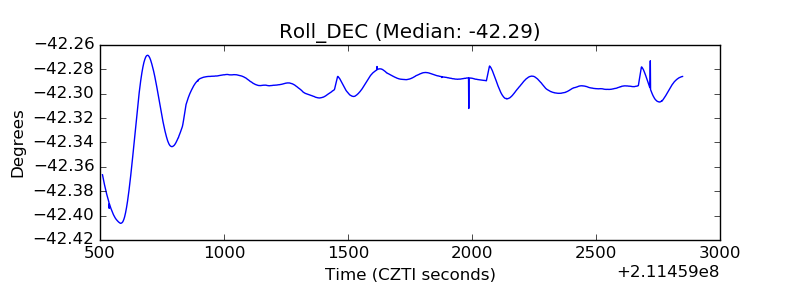 |
| _Roll_RA | 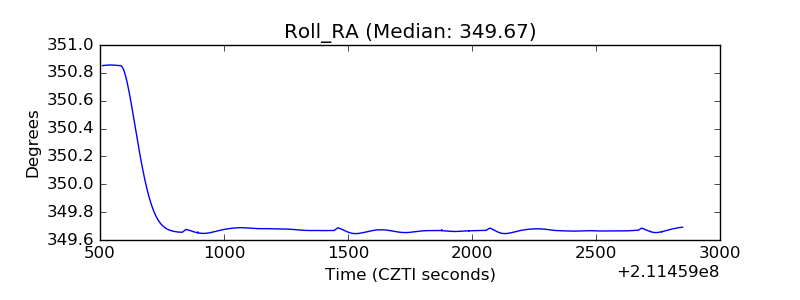 |
| Veto Counter | 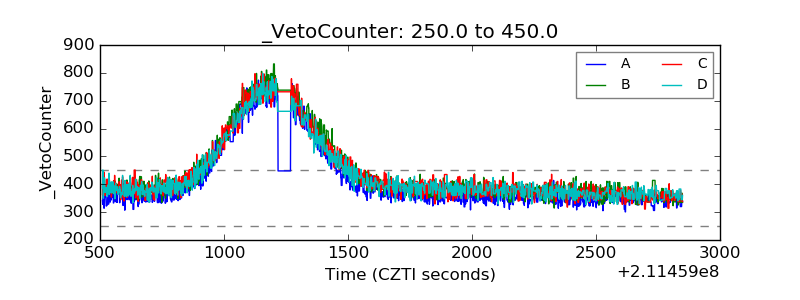 |