| Param | Original file | Final file |
|---|---|---|
| Filename | modeM0/AS1G05_152T02_9000000658_05201cztM0_level2.evt | modeM0/AS1G05_152T02_9000000658_05201cztM0_level2_quad_clean.evt |
| Size (bytes) | 179,991,360 | 18,512,640 |
| Size | 171.7 MB | 17.7 MB |
| Events in quadrant A | 1,304,470 | 92,141 |
| Events in quadrant B | 1,359,843 | 94,201 |
| Events in quadrant C | 1,297,062 | 94,440 |
| Events in quadrant D | 1,309,611 | 92,728 |
| Mode M0 | |||
|---|---|---|---|
| Quadrant | BADHDUFLAG | Total packets | Discarded packets |
| A | 0 | 16563 | 10909 |
| B | 0 | 16711 | 11000 |
| C | 0 | 16485 | 10816 |
| D | 0 | 16676 | 10944 |
| Mode M9 | |||
|---|---|---|---|
| Quadrant | BADHDUFLAG | Total packets | Discarded packets |
| A | 0 | 1 | 1 |
| B | 0 | 1 | 1 |
| C | 0 | 3 | 3 |
| D | 0 | 1 | 1 |
| Mode SS | |||
|---|---|---|---|
| Quadrant | BADHDUFLAG | Total packets | Discarded packets |
| A | 0 | 158 | 104 |
| B | 0 | 161 | 113 |
| C | 0 | 158 | 105 |
| D | 0 | 155 | 97 |
| Quadrant | Total seconds | Saturated seconds | Saturation percentage |
|---|---|---|---|
| A | 2590 | 243 | 9.382239% |
| B | 2605 | 234 | 8.982726% |
| C | 2581 | 201 | 7.787679% |
| D | 2579 | 206 | 7.987592% |
Noise dominated data is calculated using 1-second bins in cleaned event files. If a bin has >2000 counts, and if more than 50% of those come from <1% of pixels, then it is considered to be noise-dominated and hence unusable.
| Quadrant | # 1 sec bins | Bins with >0 counts | Bins with >2000 counts | High rate bins dominated by noise | Noise dominated (total time) | Noise dominated (detector-on time) | Marked lightcurve |
|---|---|---|---|---|---|---|---|
| A | 7685 | 3105 | 0 | 0 | 0.00% | 0.00% | 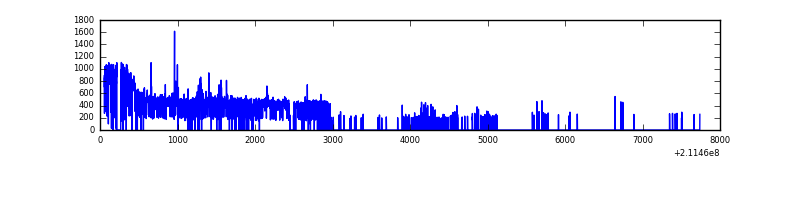 |
| B | 7699 | 3118 | 0 | 0 | 0.00% | 0.00% | 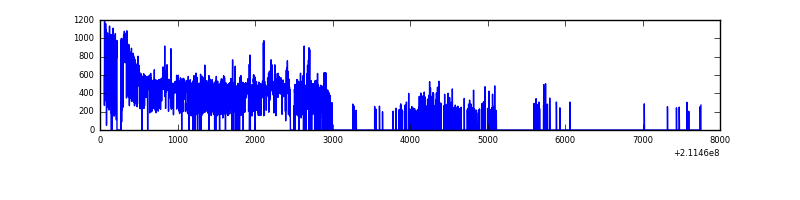 |
| C | 7691 | 3092 | 0 | 0 | 0.00% | 0.00% | 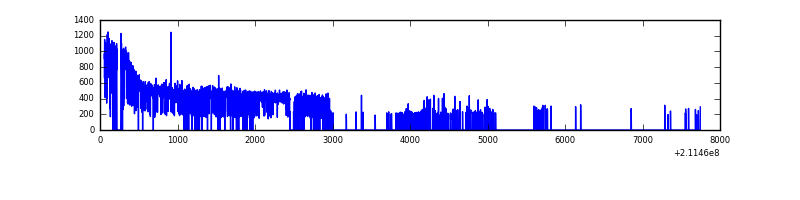 |
| D | 7690 | 3119 | 1 | 1 | 0.01% | 0.03% | 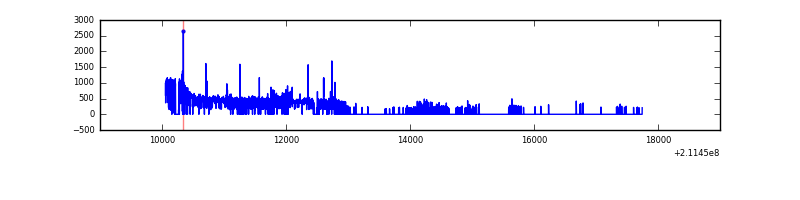 |
Top three noisy pixels from each quadrant. If the there are fewer than three noisy pixels in the level2.evt file, extra rows are filled as -1
| Pixel properties | Quadrant properties | ||||||
|---|---|---|---|---|---|---|---|
| Quadrant | DetID | PixID | Counts | Sigma | Mean | Median | Sigma |
| A | 4 | 2 | 34959 | 493.7 | 329 | 319 | 70.2 |
| A | 12 | 194 | 3318 | 42.74 | 329 | 319 | 70.2 |
| A | 0 | 226 | 3243 | 41.67 | 329 | 319 | 70.2 |
| B | 15 | 204 | 62429 | 912.62 | 332 | 322 | 68.1 |
| B | 4 | 48 | 10602 | 151.06 | 332 | 322 | 68.1 |
| B | 12 | 111 | 6342 | 88.46 | 332 | 322 | 68.1 |
| C | 1 | 16 | 13901 | 173.45 | 325 | 326 | 78.3 |
| C | 8 | 128 | 6848 | 83.33 | 325 | 326 | 78.3 |
| C | 8 | 112 | 2959 | 33.64 | 325 | 326 | 78.3 |
| D | 2 | 63 | 52978 | 637.47 | 327 | 315 | 82.6 |
| D | 10 | 15 | 10512 | 123.43 | 327 | 315 | 82.6 |
| D | 2 | 14 | 10409 | 122.18 | 327 | 315 | 82.6 |
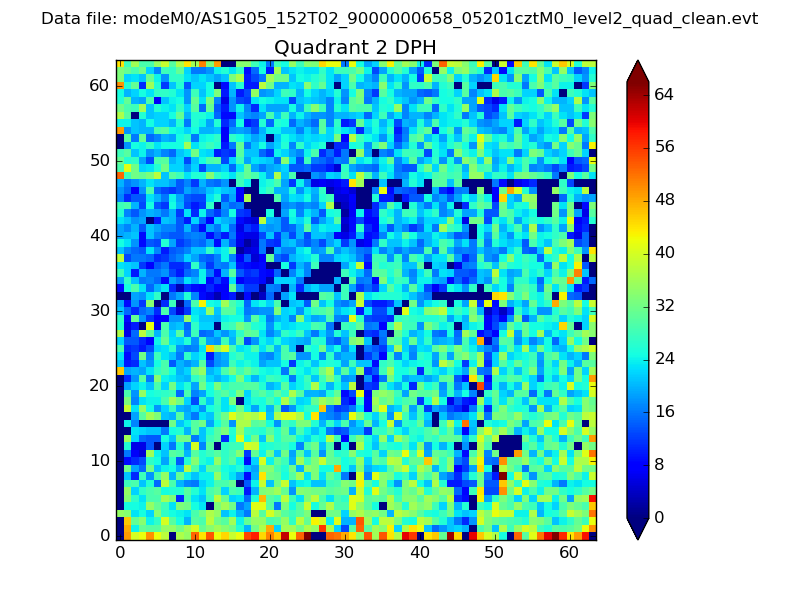
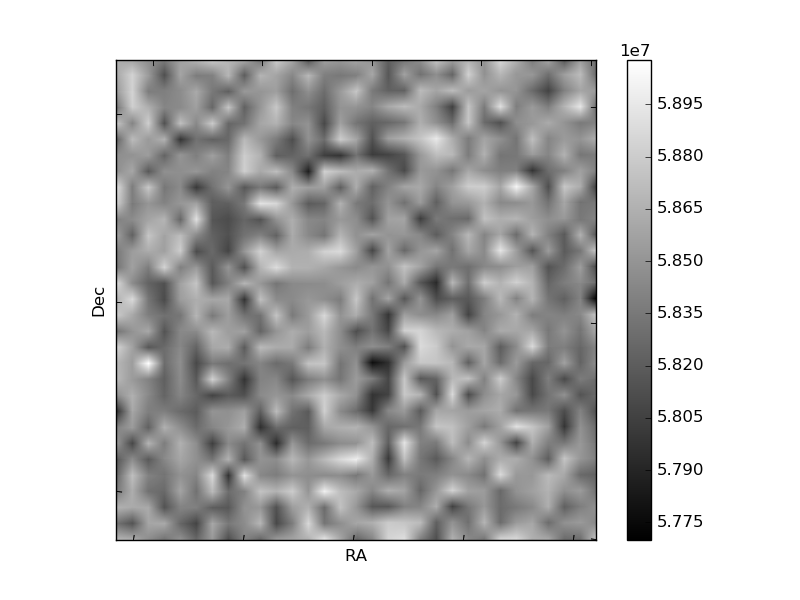
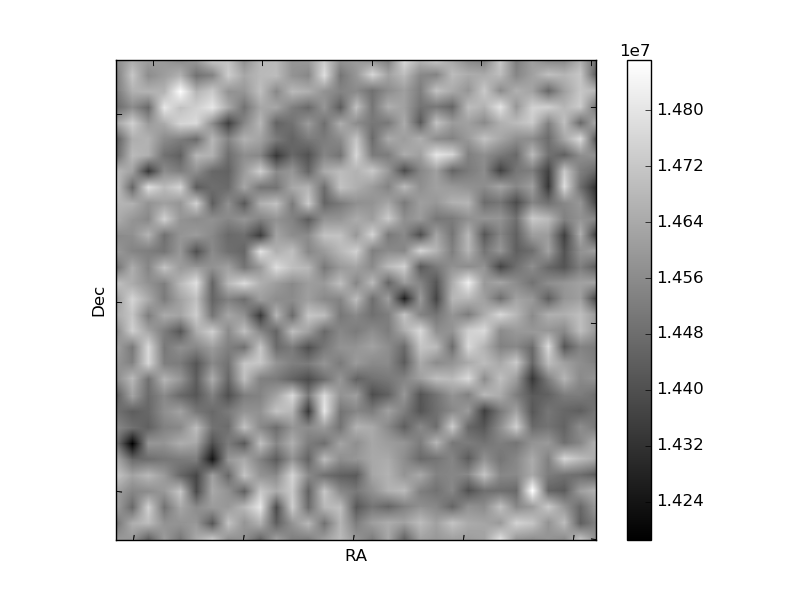
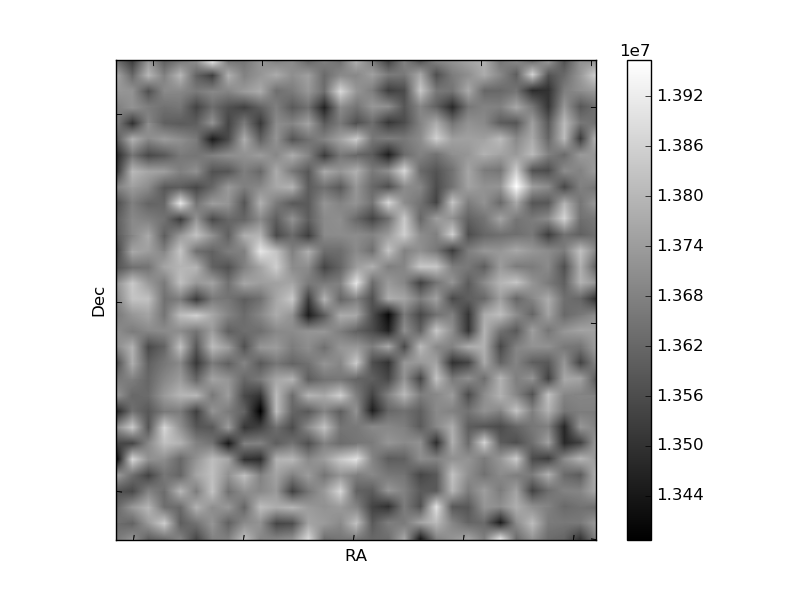
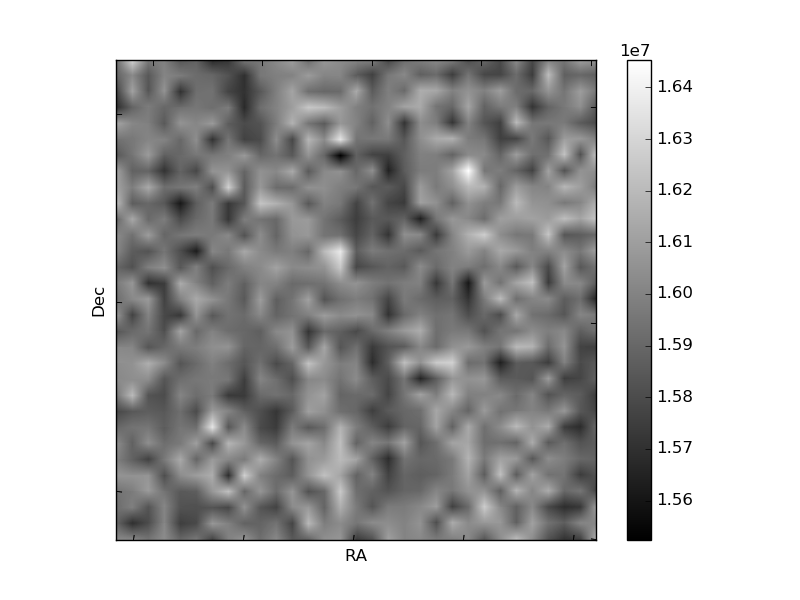
Histogram calculated using DETX and DETY for each event in the final _common_clean file
| Quadrant A | 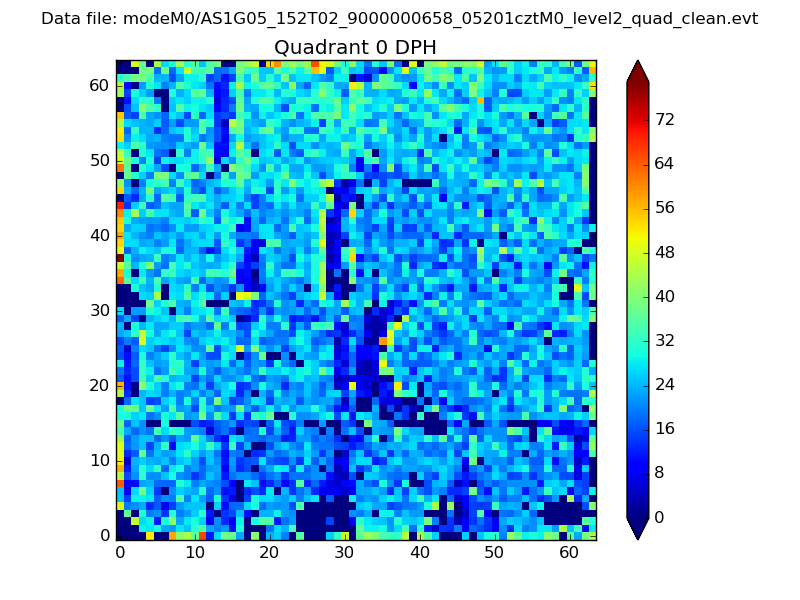 |
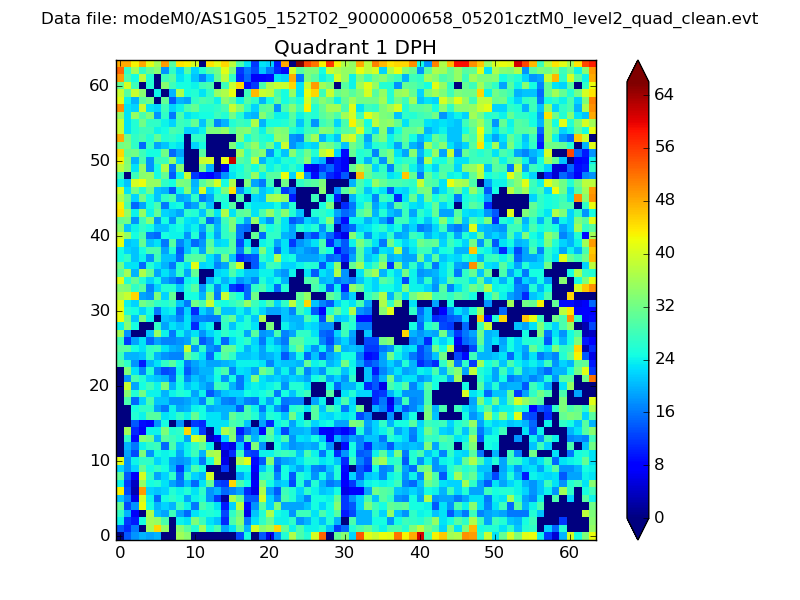 |
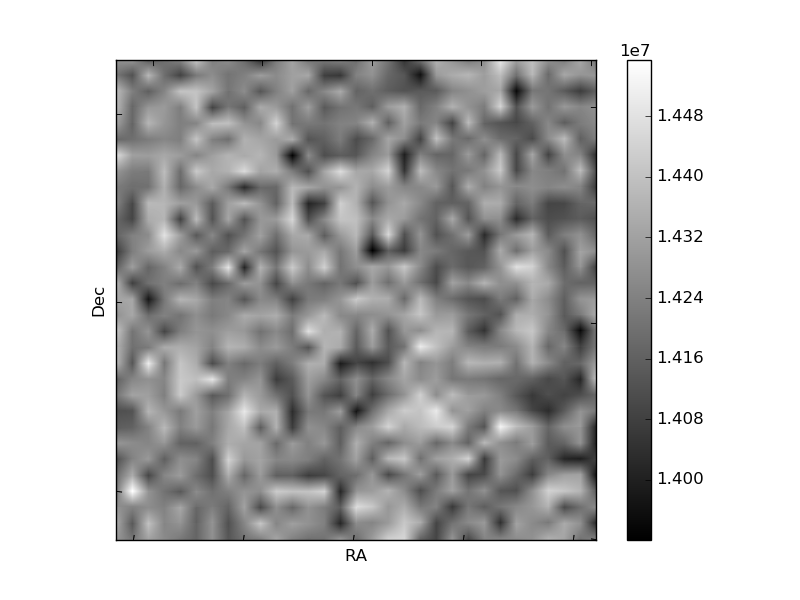
Quadrant B |
|---|---|---|---|
| Quadrant D | 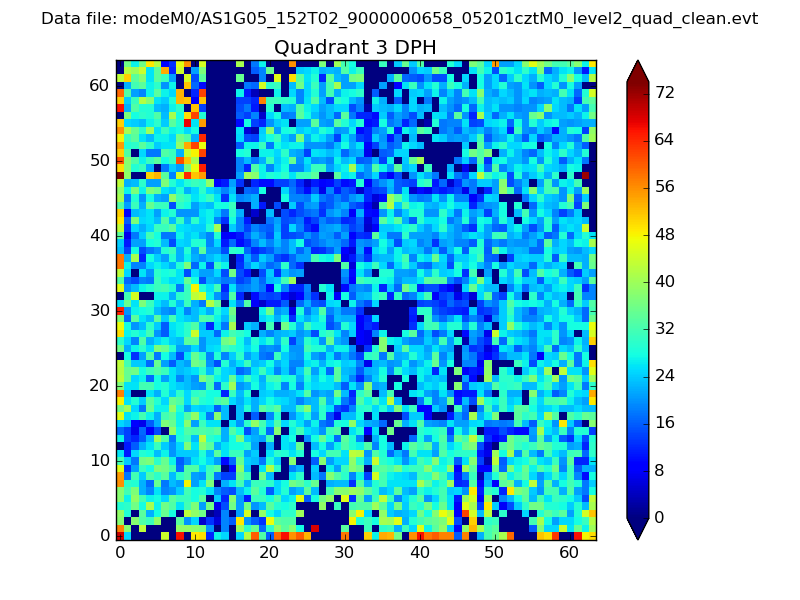 |
 |
Quadrant C |
| Plot type | Count rate plots | Images |
|---|---|---|
| Comparison with Poisson distribution Blue bars denote a histogram of data divided into 1 sec bins. Red curve is a Poisson curve with rate = median count rate of data. |
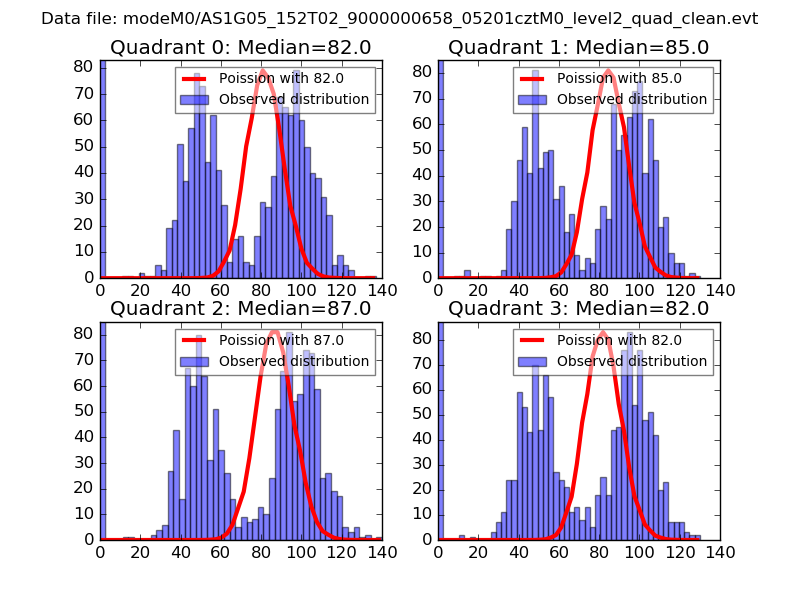 |
 |
| Quadrant-wise count rates Data is divided into 100 sec bins |
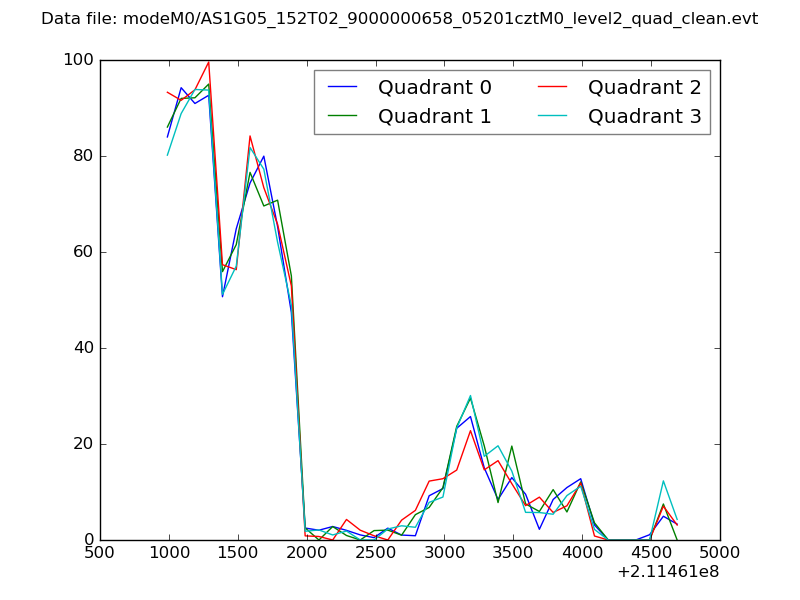 |
|
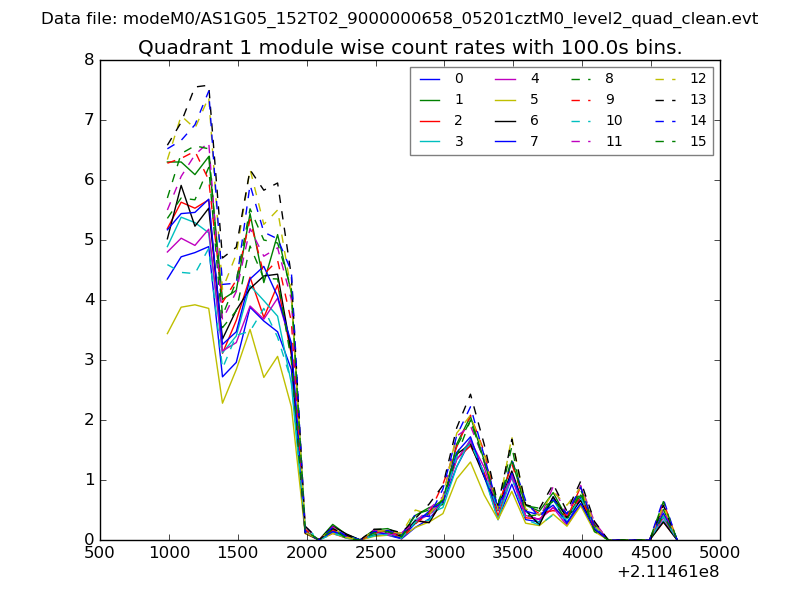
| Module-wise count rates for Quadrant A Data is divided into 100 sec bins |
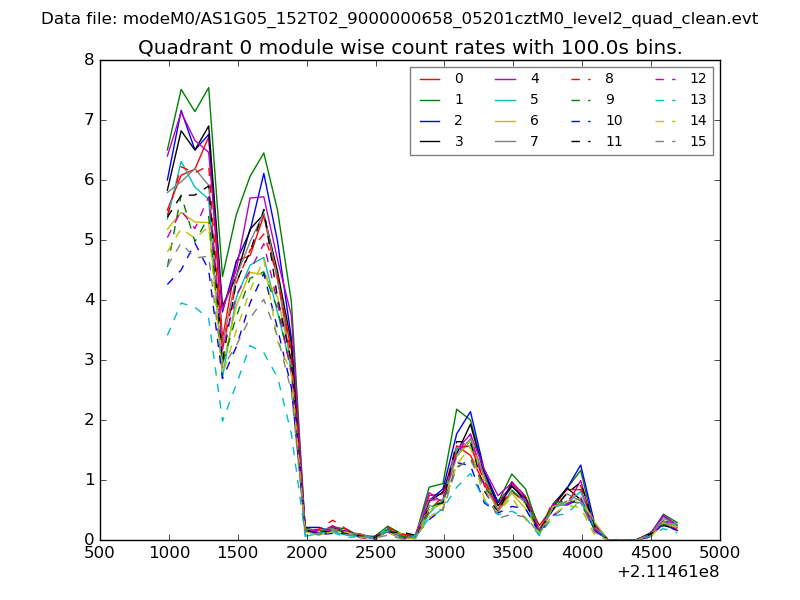 |
 |
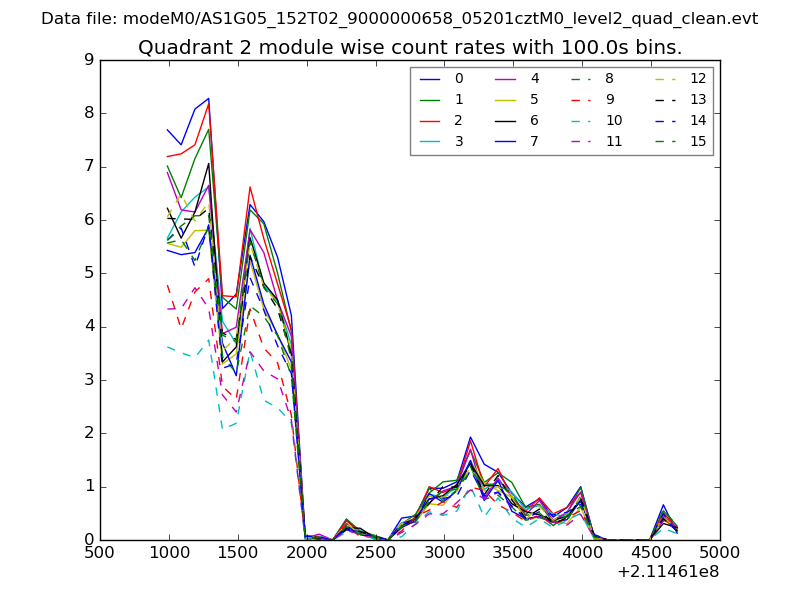
| Module-wise count rates for Quadrant B Data is divided into 100 sec bins |
 |
 |
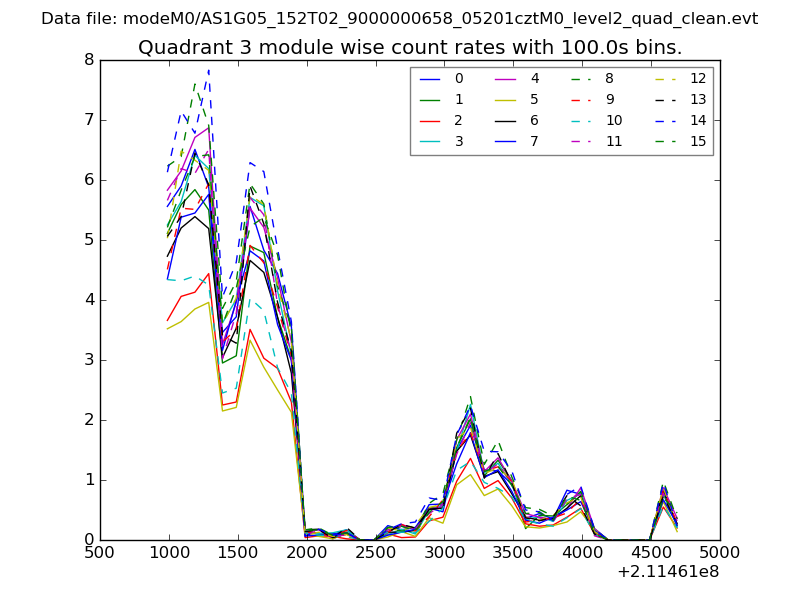
| Module-wise count rates for Quadrant C Data is divided into 100 sec bins |
 |
 |
| Module-wise count rates for Quadrant D Data is divided into 100 sec bins |
 |
 |
| Parameter | Plot |
|---|---|
| CZT HV Monitor | 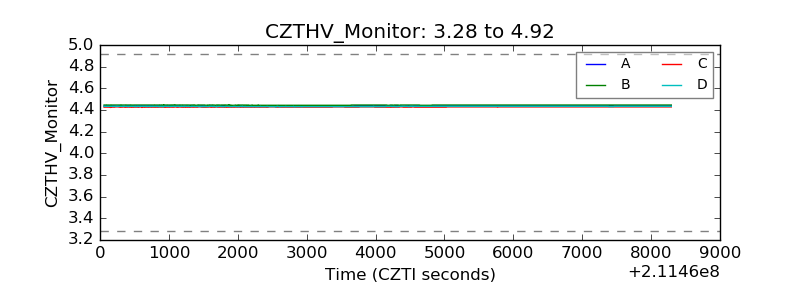 |
| D_VDD | 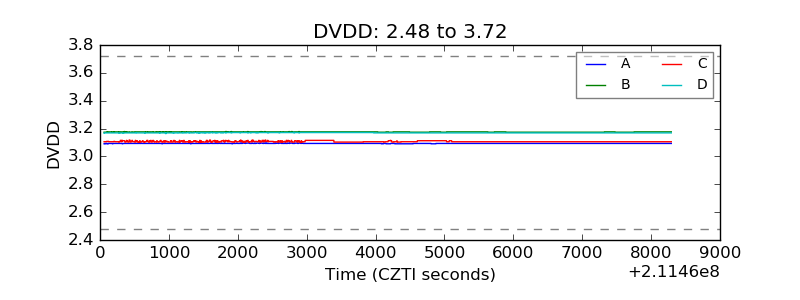 |
| Temperature 1 | 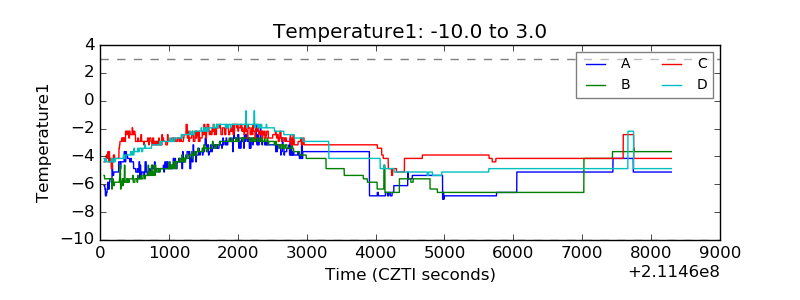 |
| Veto HV Monitor | 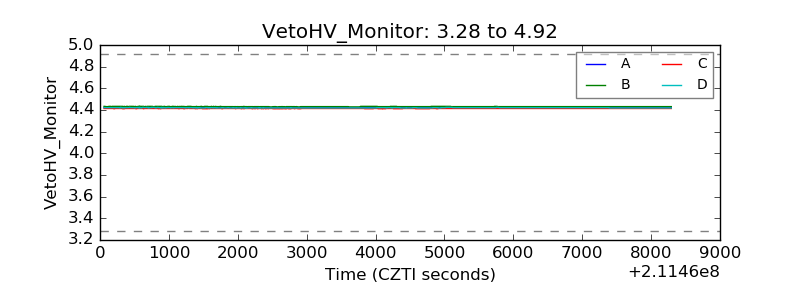 |
| Veto LLD | 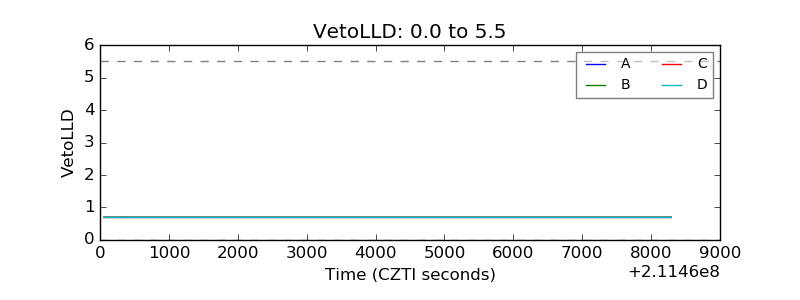 |
| Alpha Counter | 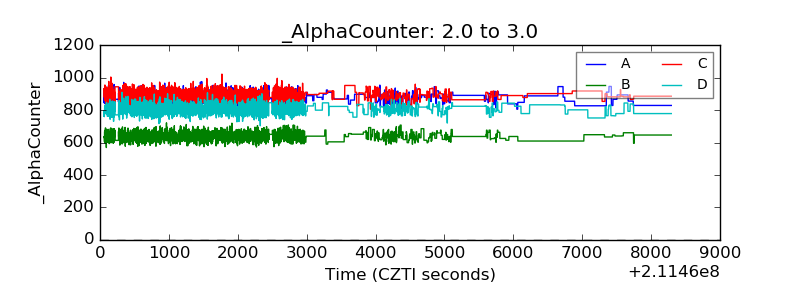 |
| _CPM_Rate | 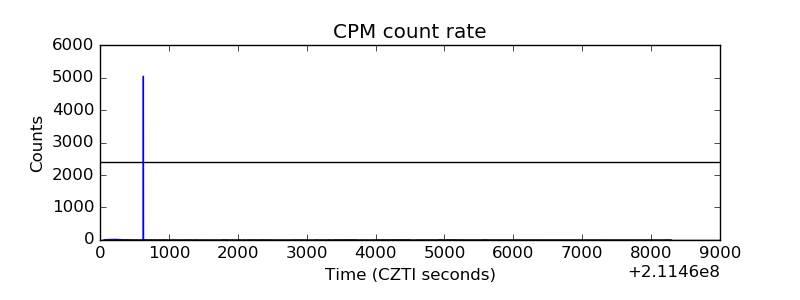 |
| CZT Counter | 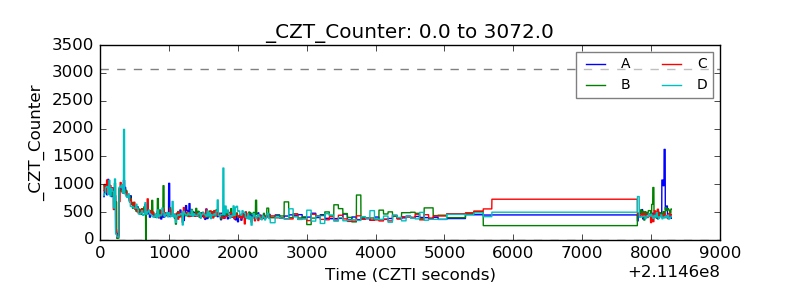 |
| +2.5 Volts monitor | 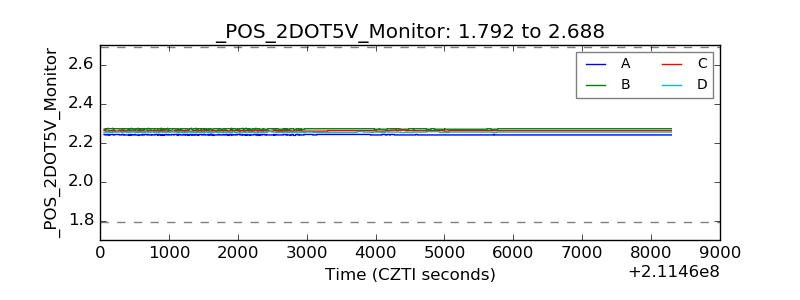 |
| +5 Volts monitor | 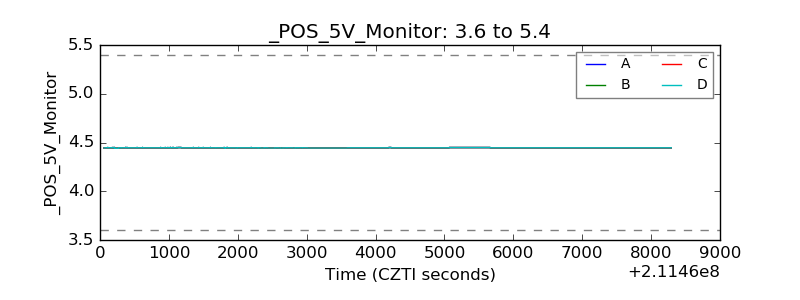 |
| _ROLL_ROT | 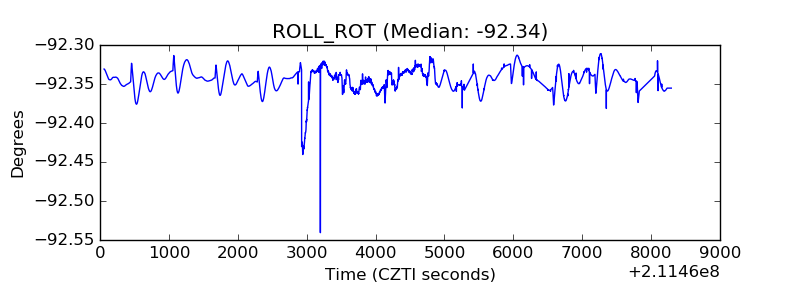 |
| _Roll_DEC | 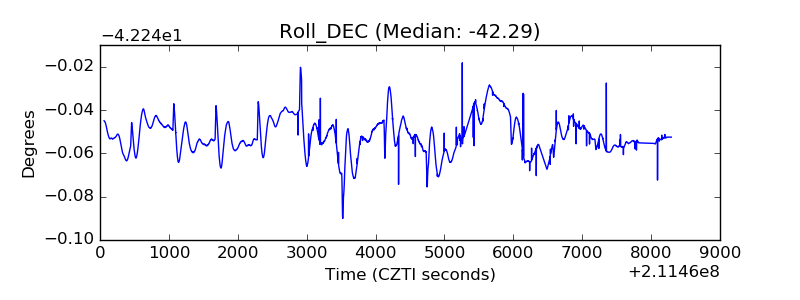 |
| _Roll_RA | 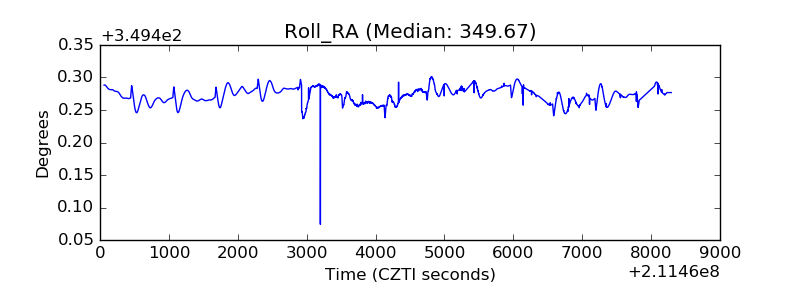 |
| Veto Counter | 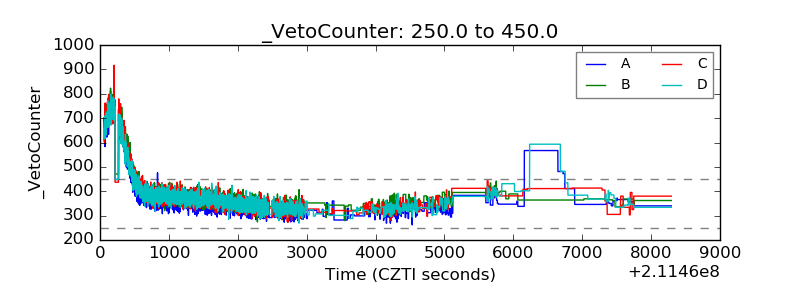 |