| Param | Original file | Final file |
|---|---|---|
| Filename | modeM0/AS1G05_194T01_9000000660cztM0_level2.fits | modeM0/AS1G05_194T01_9000000660cztM0_level2_quad_clean.evt |
| Size (bytes) | 138,674,880 | 110,220,480 |
| Size | 132.3 MB | 105.1 MB |
| Events in quadrant A | 826,948 | 588,028 |
| Events in quadrant B | 810,380 | 600,261 |
| Events in quadrant C | 823,944 | 582,861 |
| Events in quadrant D | 699,474 | 526,688 |
| Mode M0 | |||
|---|---|---|---|
| Quadrant | BADHDUFLAG | Total packets | Discarded packets |
| A | 0 | 31057 | 0 |
| B | 0 | 31011 | 0 |
| C | 0 | 31993 | 0 |
| D | 0 | 33424 | 0 |
| Mode SS | |||
|---|---|---|---|
| Quadrant | BADHDUFLAG | Total packets | Discarded packets |
| A | 0 | 310 | 0 |
| B | 0 | 310 | 0 |
| C | 0 | 310 | 0 |
| D | 0 | 310 | 0 |
| Mode M9 | |||
|---|---|---|---|
| Quadrant | BADHDUFLAG | Total packets | Discarded packets |
| A | 0 | 31 | 0 |
| B | 0 | 31 | 0 |
| C | 0 | 31 | 0 |
| D | 0 | 31 | 0 |
| Quadrant | Total seconds | Saturated seconds | Saturation percentage |
|---|---|---|---|
| A | 15052 | 120 | 0.797236% |
| B | 15047 | 98 | 0.651293% |
| C | 15045 | 60 | 0.398804% |
| D | 15051 | 184 | 1.222510% |
Noise dominated data is calculated using 1-second bins in cleaned event files. If a bin has >2000 counts, and if more than 50% of those come from <1% of pixels, then it is considered to be noise-dominated and hence unusable.
| Quadrant | # 1 sec bins | Bins with >0 counts | Bins with >2000 counts | High rate bins dominated by noise | Noise dominated (total time) | Noise dominated (detector-on time) | Marked lightcurve |
|---|---|---|---|---|---|---|---|
| A | 18219 | 15059 | 0 | 0 | 0.00% | 0.00% | 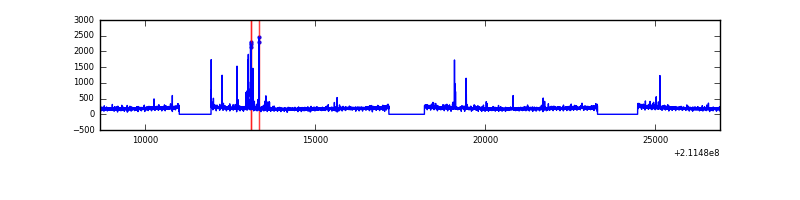 |
| B | 18219 | 15058 | 0 | 0 | 0.00% | 0.00% |  |
| C | 18219 | 15058 | 0 | 0 | 0.00% | 0.00% |  |
| D | 18219 | 15059 | 0 | 0 | 0.00% | 0.00% |  |
Top three noisy pixels from each quadrant. If the there are fewer than three noisy pixels in the level2.evt file, extra rows are filled as -1
| Pixel properties | Quadrant properties | ||||||
|---|---|---|---|---|---|---|---|
| Quadrant | DetID | PixID | Counts | Sigma | Mean | Median | Sigma |
| A | 0 | 29 | 827 | 10.93 | 214 | 200 | 57.4 |
| A | 7 | 110 | 722 | 9.1 | 214 | 200 | 57.4 |
| A | 9 | 19 | 625 | 7.41 | 214 | 200 | 57.4 |
| B | 2 | 9 | 681 | 10.44 | 213 | 203 | 45.8 |
| B | 12 | 226 | 573 | 8.08 | 213 | 203 | 45.8 |
| B | 14 | 254 | 553 | 7.65 | 213 | 203 | 45.8 |
| C | 1 | 80 | 584 | 6.38 | 217 | 201 | 60.1 |
| C | 1 | 81 | 573 | 6.19 | 217 | 201 | 60.1 |
| C | 12 | 241 | 563 | 6.03 | 217 | 201 | 60.1 |
| D | 11 | 82 | 566 | 7.04 | 199 | 180 | 54.8 |
| D | 1 | 19 | 532 | 6.42 | 199 | 180 | 54.8 |
| D | 3 | 14 | 530 | 6.39 | 199 | 180 | 54.8 |
Histogram calculated using DETX and DETY for each event in the final _common_clean file
| Quadrant A | 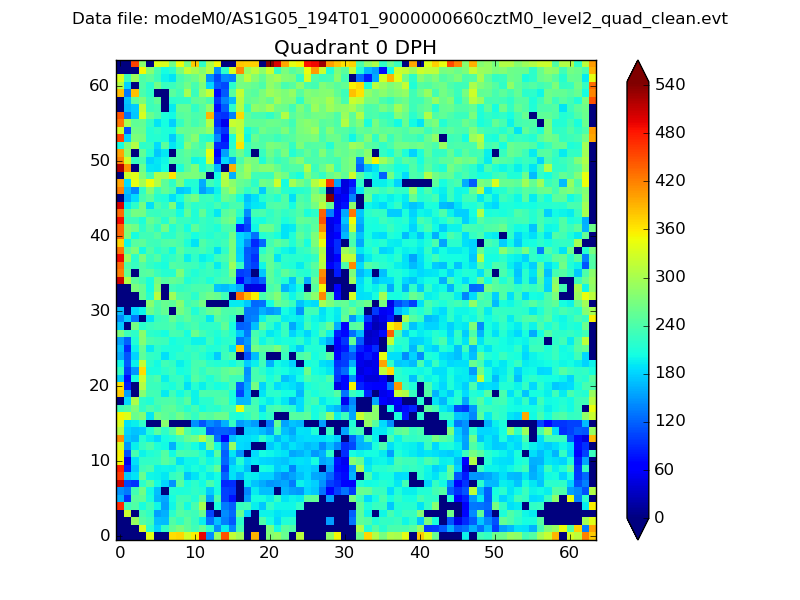 |
 |
Quadrant B |
|---|---|---|---|
| Quadrant D |  |
 |
Quadrant C |
| Plot type | Count rate plots | Images |
|---|---|---|
| Comparison with Poisson distribution Blue bars denote a histogram of data divided into 1 sec bins. Red curve is a Poisson curve with rate = median count rate of data. |
 |
 |
| Quadrant-wise count rates Data is divided into 100 sec bins |
 |
|
| Module-wise count rates for Quadrant A Data is divided into 100 sec bins |
 |
 |
| Module-wise count rates for Quadrant B Data is divided into 100 sec bins |
 |
 |
| Module-wise count rates for Quadrant C Data is divided into 100 sec bins |
 |
 |
| Module-wise count rates for Quadrant D Data is divided into 100 sec bins |
 |
 |
| Parameter | Plot |
|---|---|
| CZT HV Monitor |  |
| D_VDD |  |
| Temperature 1 |  |
| Veto HV Monitor |  |
| Veto LLD |  |
| Alpha Counter |  |
| _CPM_Rate |  |
| CZT Counter |  |
| +2.5 Volts monitor |  |
| +5 Volts monitor |  |
| _ROLL_ROT |  |
| _Roll_DEC |  |
| _Roll_RA |  |
| Veto Counter |  |