| Param | Original file | Final file |
|---|---|---|
| Filename | modeM0/AS1G05_141T01_9000000664cztM0_level2.fits | modeM0/AS1G05_141T01_9000000664cztM0_level2_quad_clean.evt |
| Size (bytes) | 414,486,720 | 368,688,960 |
| Size | 395.3 MB | 351.6 MB |
| Events in quadrant A | 2,535,444 | 2,186,007 |
| Events in quadrant B | 2,454,148 | 2,189,224 |
| Events in quadrant C | 2,523,444 | 2,144,032 |
| Events in quadrant D | 1,838,260 | 1,449,313 |
| Mode M9 | |||
|---|---|---|---|
| Quadrant | BADHDUFLAG | Total packets | Discarded packets |
| A | 0 | 71 | 0 |
| B | 0 | 71 | 0 |
| C | 0 | 71 | 0 |
| D | 0 | 71 | 0 |
| Mode M0 | |||
|---|---|---|---|
| Quadrant | BADHDUFLAG | Total packets | Discarded packets |
| A | 0 | 97479 | 0 |
| B | 0 | 99372 | 0 |
| C | 0 | 95284 | 0 |
| D | 0 | 184553 | 0 |
| Mode SS | |||
|---|---|---|---|
| Quadrant | BADHDUFLAG | Total packets | Discarded packets |
| A | 0 | 942 | 0 |
| B | 0 | 944 | 0 |
| C | 0 | 946 | 0 |
| D | 0 | 948 | 0 |
| Quadrant | Total seconds | Saturated seconds | Saturation percentage |
|---|---|---|---|
| A | 46575 | 661 | 1.419216% |
| B | 46590 | 695 | 1.491736% |
| C | 46568 | 263 | 0.564766% |
| D | 46571 | 11566 | 24.835198% |
Noise dominated data is calculated using 1-second bins in cleaned event files. If a bin has >2000 counts, and if more than 50% of those come from <1% of pixels, then it is considered to be noise-dominated and hence unusable.
| Quadrant | # 1 sec bins | Bins with >0 counts | Bins with >2000 counts | High rate bins dominated by noise | Noise dominated (total time) | Noise dominated (detector-on time) | Marked lightcurve |
|---|---|---|---|---|---|---|---|
| A | 53593 | 46649 | 0 | 0 | 0.00% | 0.00% | 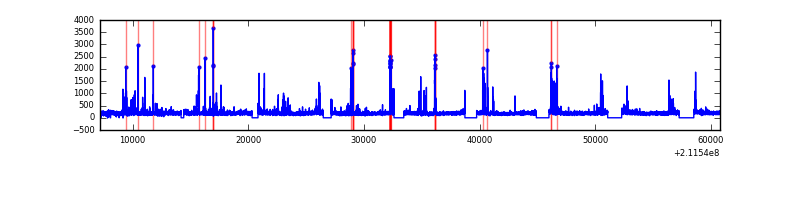 |
| B | 53593 | 46636 | 0 | 0 | 0.00% | 0.00% | 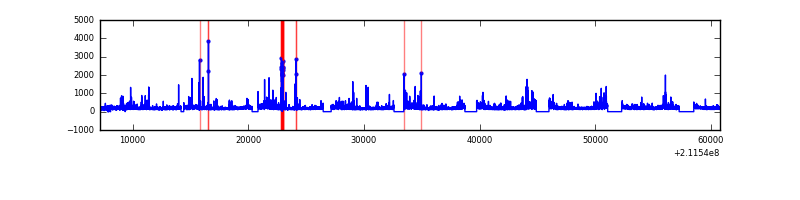 |
| C | 53593 | 46650 | 0 | 0 | 0.00% | 0.00% | 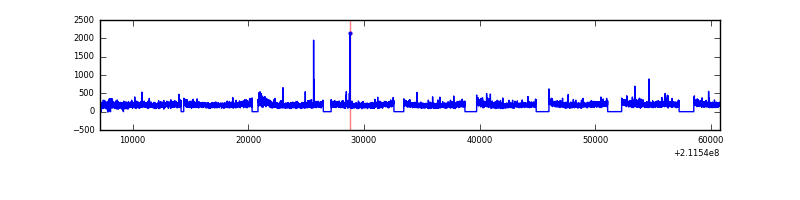 |
| D | 53593 | 45880 | 0 | 0 | 0.00% | 0.00% | 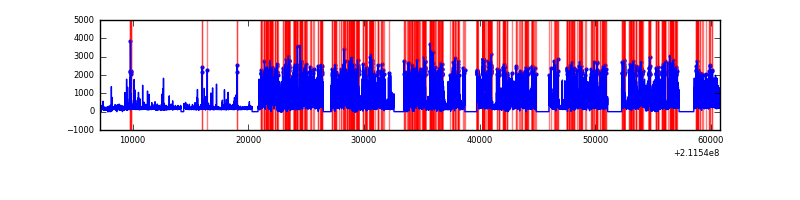 |
Top three noisy pixels from each quadrant. If the there are fewer than three noisy pixels in the level2.evt file, extra rows are filled as -1
| Pixel properties | Quadrant properties | ||||||
|---|---|---|---|---|---|---|---|
| Quadrant | DetID | PixID | Counts | Sigma | Mean | Median | Sigma |
| A | 14 | 188 | 2493 | 11.0 | 656 | 610 | 171.1 |
| A | 0 | 29 | 2436 | 10.67 | 656 | 610 | 171.1 |
| A | 14 | 204 | 2215 | 9.38 | 656 | 610 | 171.1 |
| B | 2 | 9 | 2093 | 11.03 | 649 | 616 | 133.9 |
| B | 12 | 226 | 1742 | 8.41 | 649 | 616 | 133.9 |
| B | 14 | 254 | 1725 | 8.28 | 649 | 616 | 133.9 |
| C | 1 | 80 | 1816 | 6.81 | 664 | 612 | 176.7 |
| C | 1 | 81 | 1798 | 6.71 | 664 | 612 | 176.7 |
| C | 12 | 241 | 1762 | 6.51 | 664 | 612 | 176.7 |
| D | 6 | 231 | 1418 | 6.7 | 524 | 475 | 140.7 |
| D | 4 | 160 | 1382 | 6.44 | 524 | 475 | 140.7 |
| D | 11 | 82 | 1378 | 6.41 | 524 | 475 | 140.7 |
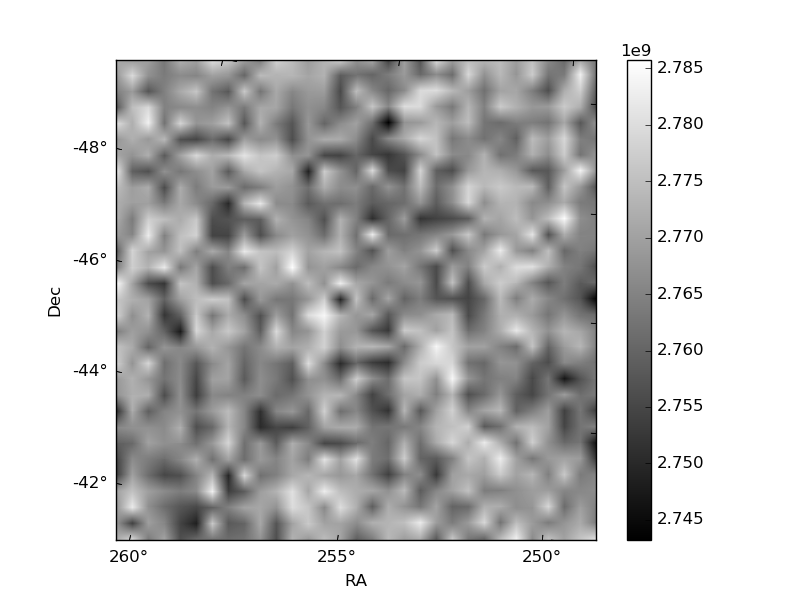
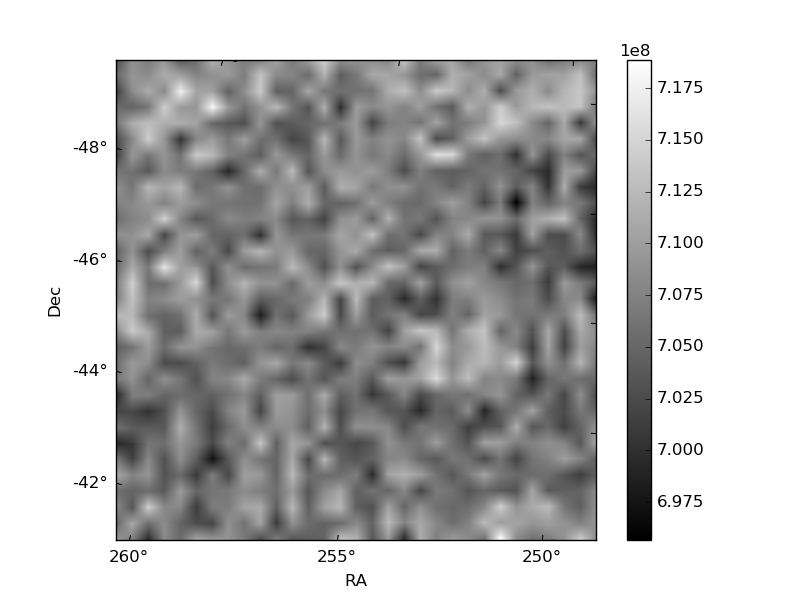
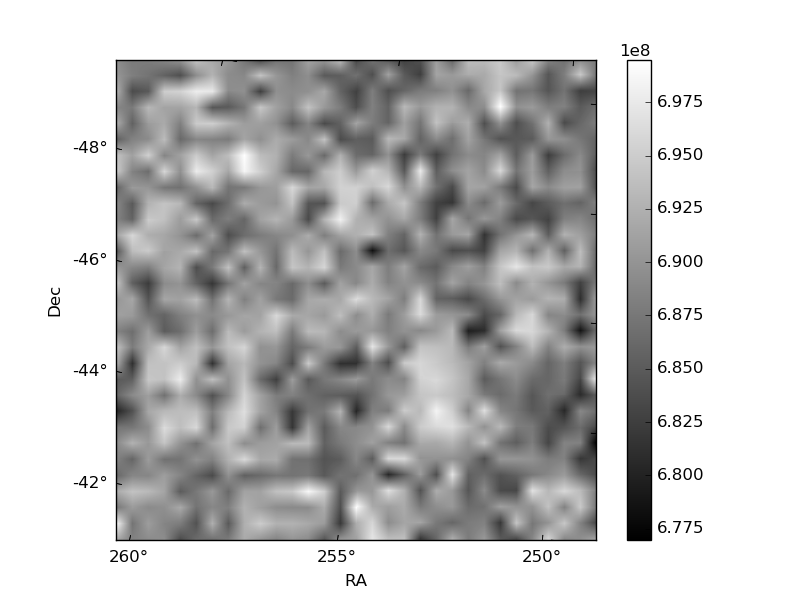
Histogram calculated using DETX and DETY for each event in the final _common_clean file
| Quadrant A | 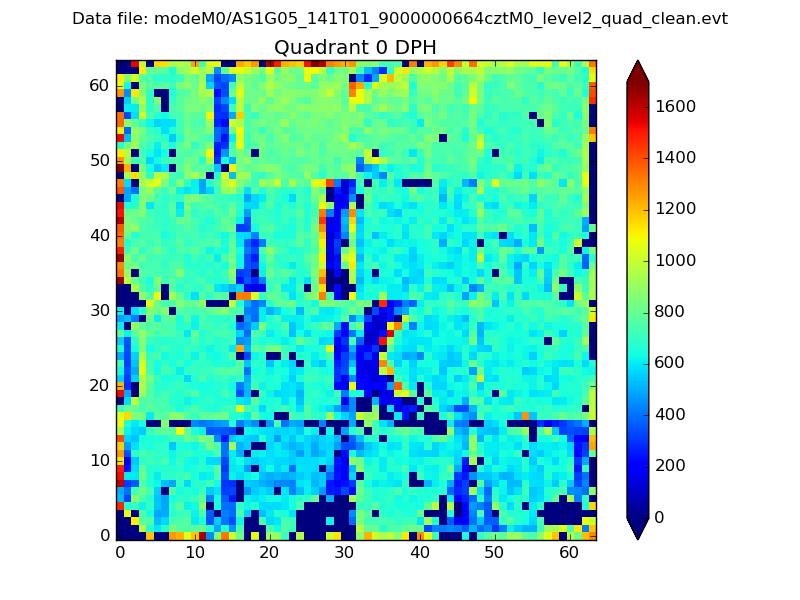 |
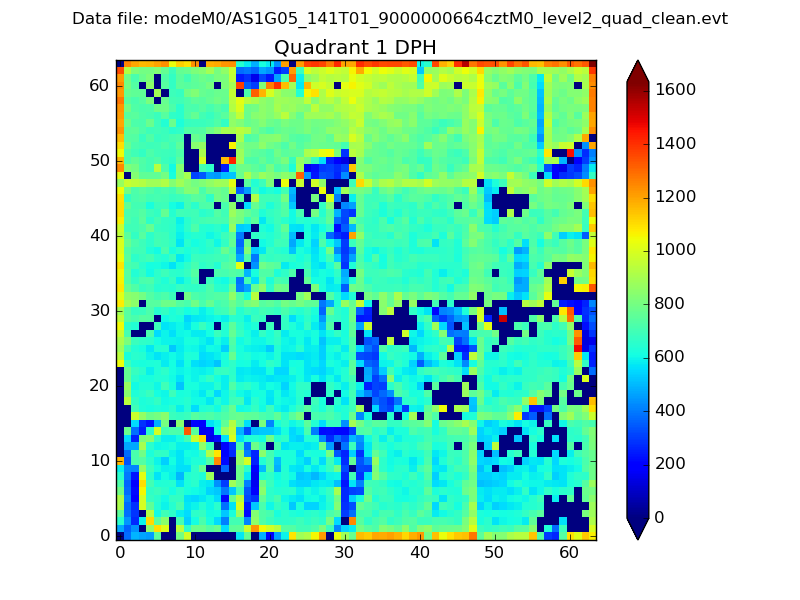 |
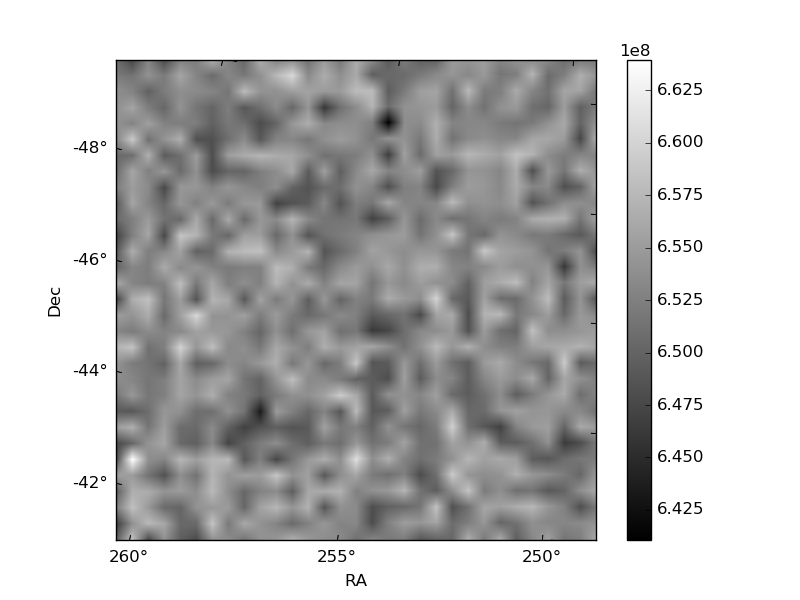
Quadrant B |
|---|---|---|---|
| Quadrant D | 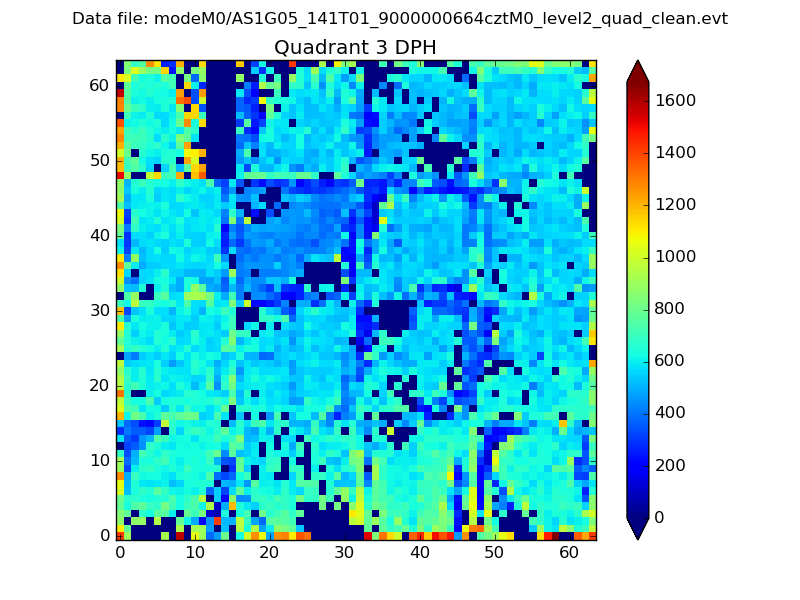 |
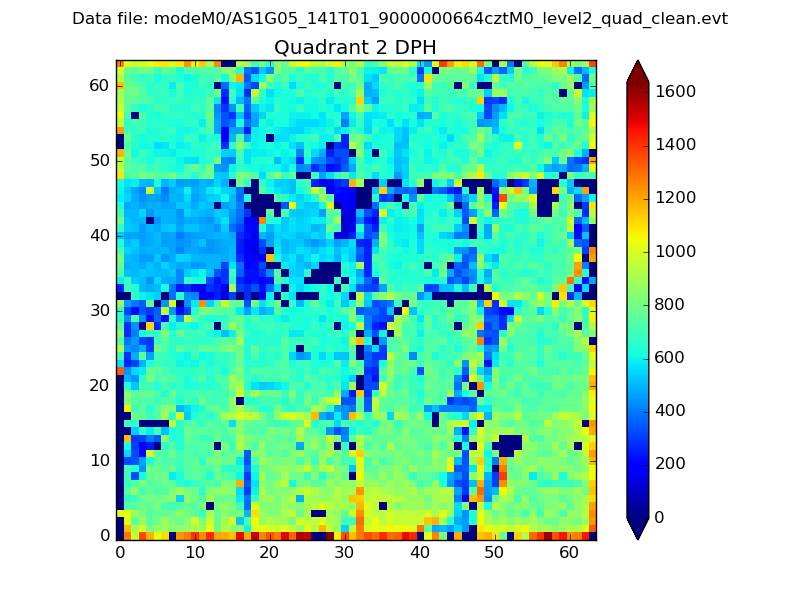 |
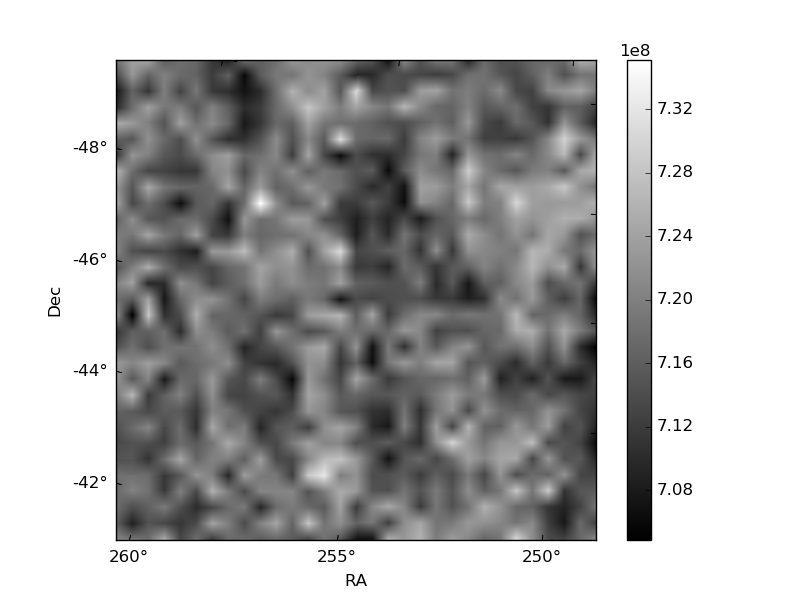
Quadrant C |
| Plot type | Count rate plots | Images |
|---|---|---|
| Comparison with Poisson distribution Blue bars denote a histogram of data divided into 1 sec bins. Red curve is a Poisson curve with rate = median count rate of data. |
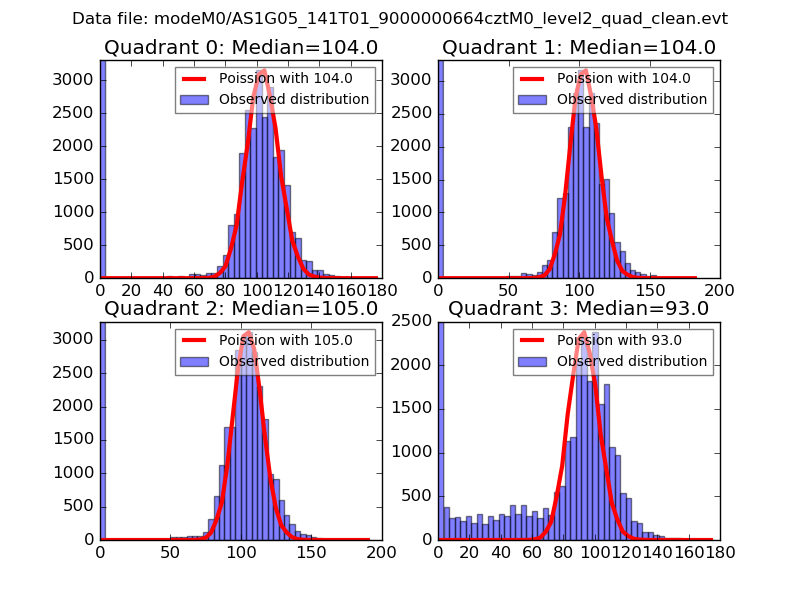 |
 |
| Quadrant-wise count rates Data is divided into 100 sec bins |
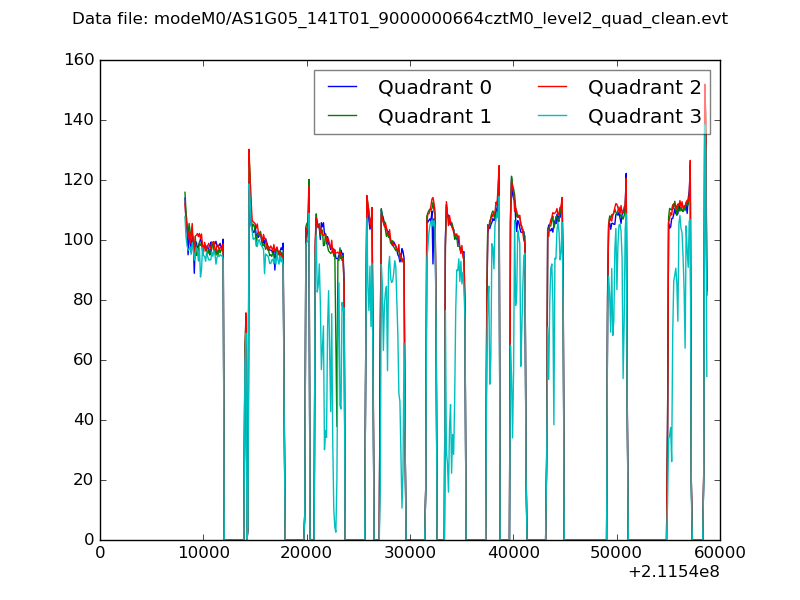 |
|
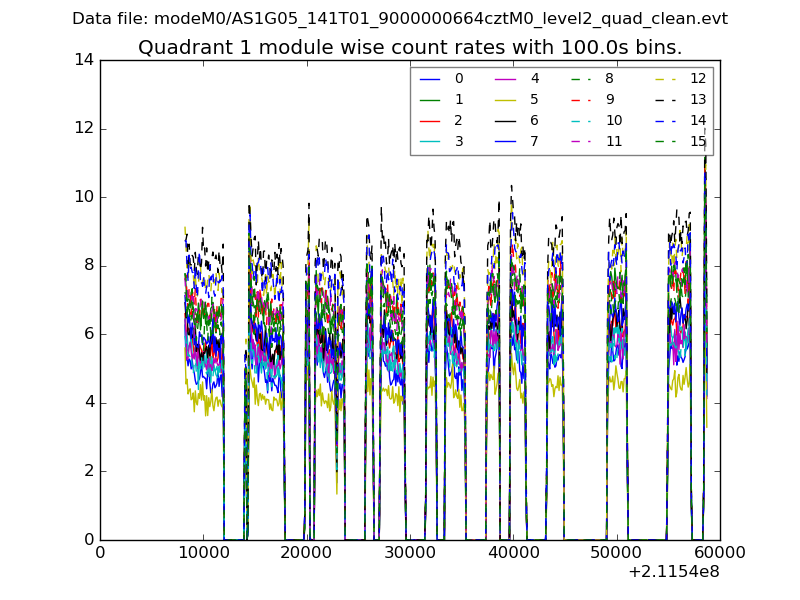
| Module-wise count rates for Quadrant A Data is divided into 100 sec bins |
 |
 |
| Module-wise count rates for Quadrant B Data is divided into 100 sec bins |
 |
 |
| Module-wise count rates for Quadrant C Data is divided into 100 sec bins |
 |
 |
| Module-wise count rates for Quadrant D Data is divided into 100 sec bins |
 |
 |
| Parameter | Plot |
|---|---|
| CZT HV Monitor | 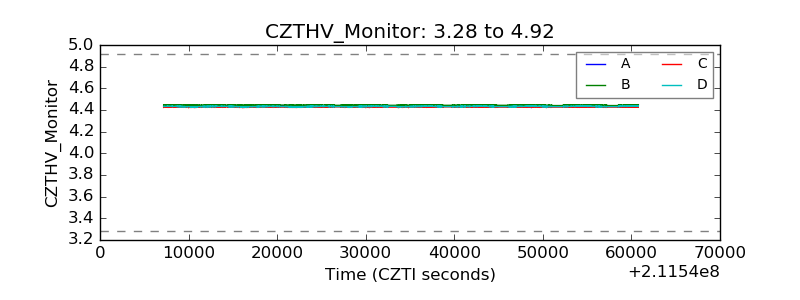 |
| D_VDD | 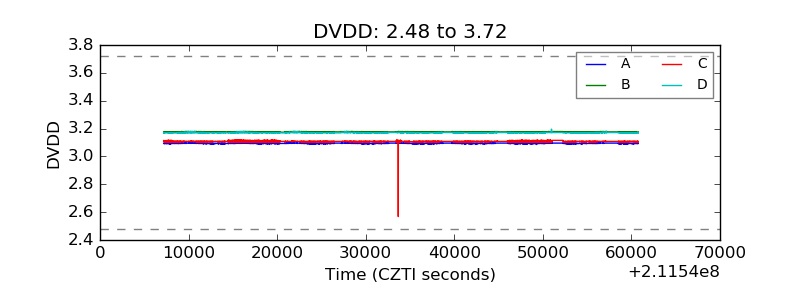 |
| Temperature 1 | 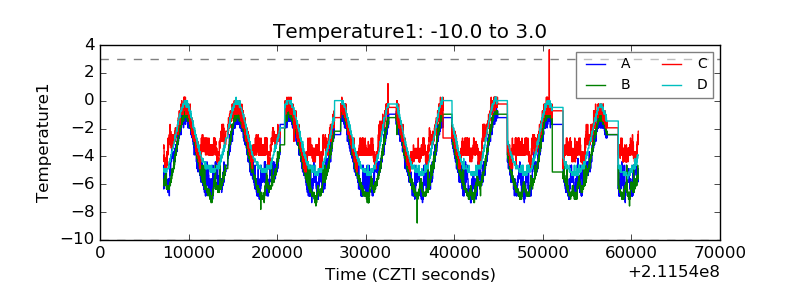 |
| Veto HV Monitor | 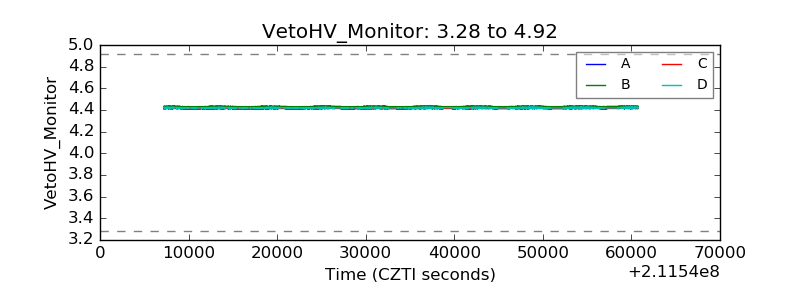 |
| Veto LLD | 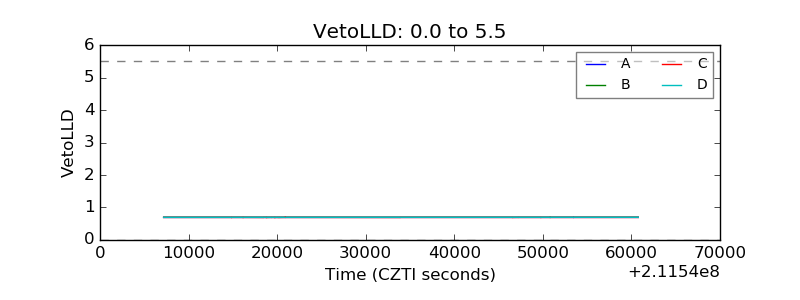 |
| Alpha Counter | 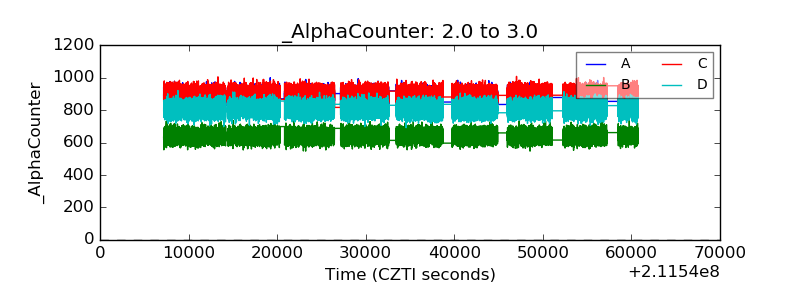 |
| _CPM_Rate | 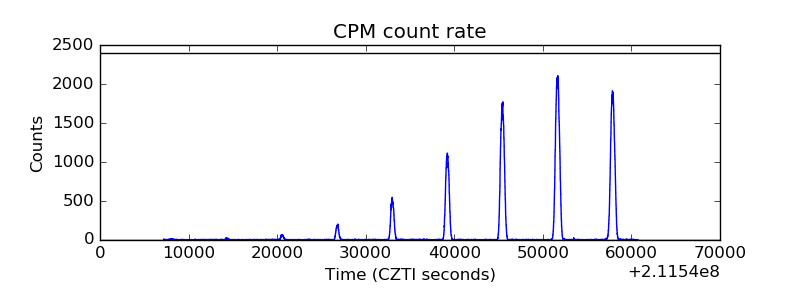 |
| CZT Counter | 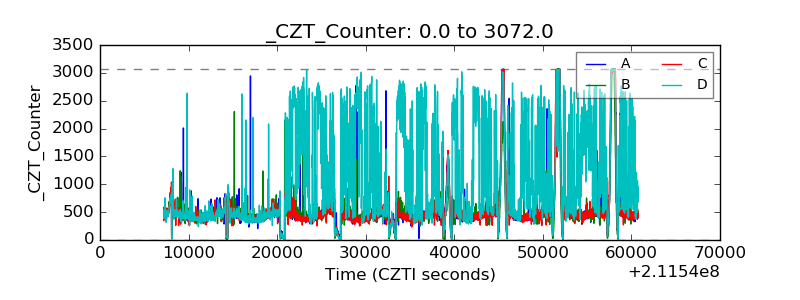 |
| +2.5 Volts monitor |  |
| +5 Volts monitor |  |
| _ROLL_ROT | 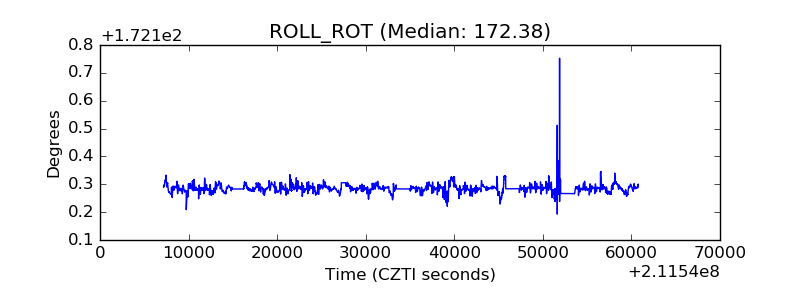 |
| _Roll_DEC | 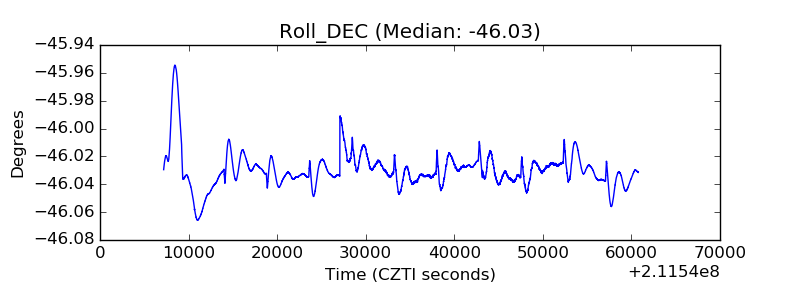 |
| _Roll_RA | 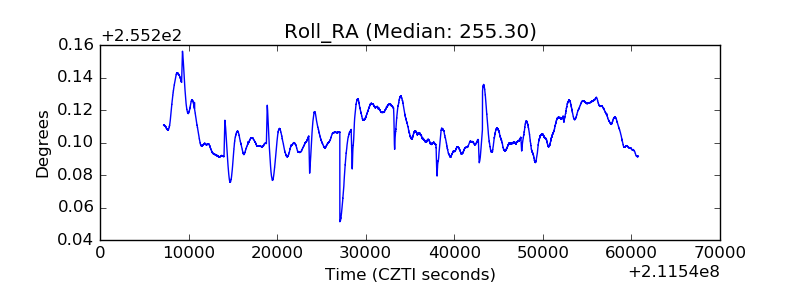 |
| Veto Counter |  |