| Param | Original file | Final file |
|---|---|---|
| Filename | modeM0/AS1G05_141T01_9000000664_05216cztM0_level2.evt | modeM0/AS1G05_141T01_9000000664_05216cztM0_level2_quad_clean.evt |
| Size (bytes) | 474,511,680 | 87,249,600 |
| Size | 452.5 MB | 83.2 MB |
| Events in quadrant A | 3,461,580 | 534,419 |
| Events in quadrant B | 3,596,522 | 534,702 |
| Events in quadrant C | 3,316,198 | 542,879 |
| Events in quadrant D | 3,496,919 | 518,923 |
| Mode M9 | |||
|---|---|---|---|
| Quadrant | BADHDUFLAG | Total packets | Discarded packets |
| A | 0 | 3 | 0 |
| B | 0 | 3 | 0 |
| C | 0 | 3 | 0 |
| D | 0 | 3 | 0 |
| Mode M0 | |||
|---|---|---|---|
| Quadrant | BADHDUFLAG | Total packets | Discarded packets |
| A | 0 | 15431 | 30 |
| B | 0 | 15555 | 9 |
| C | 0 | 15082 | 13 |
| D | 0 | 15708 | 22 |
| Mode SS | |||
|---|---|---|---|
| Quadrant | BADHDUFLAG | Total packets | Discarded packets |
| A | 0 | 148 | 0 |
| B | 0 | 148 | 0 |
| C | 0 | 148 | 2 |
| D | 0 | 148 | 0 |
| Quadrant | Total seconds | Saturated seconds | Saturation percentage |
|---|---|---|---|
| A | 7342 | 144 | 1.961318% |
| B | 7352 | 140 | 1.904244% |
| C | 7350 | 58 | 0.789116% |
| D | 7346 | 116 | 1.579091% |
Noise dominated data is calculated using 1-second bins in cleaned event files. If a bin has >2000 counts, and if more than 50% of those come from <1% of pixels, then it is considered to be noise-dominated and hence unusable.
| Quadrant | # 1 sec bins | Bins with >0 counts | Bins with >2000 counts | High rate bins dominated by noise | Noise dominated (total time) | Noise dominated (detector-on time) | Marked lightcurve |
|---|---|---|---|---|---|---|---|
| A | 7591 | 7357 | 10 | 10 | 0.13% | 0.14% | 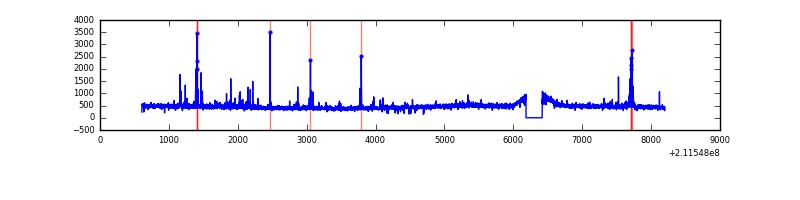 |
| B | 7591 | 7357 | 14 | 14 | 0.18% | 0.19% |  |
| C | 7591 | 7357 | 0 | 0 | 0.00% | 0.00% | 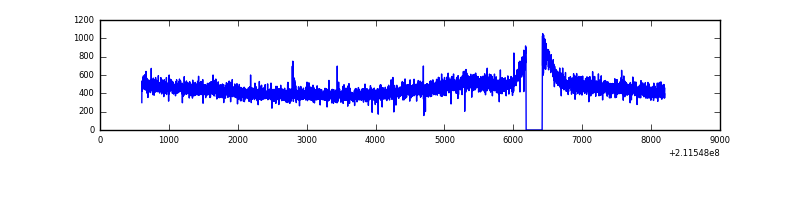 |
| D | 7591 | 7357 | 42 | 42 | 0.55% | 0.57% | 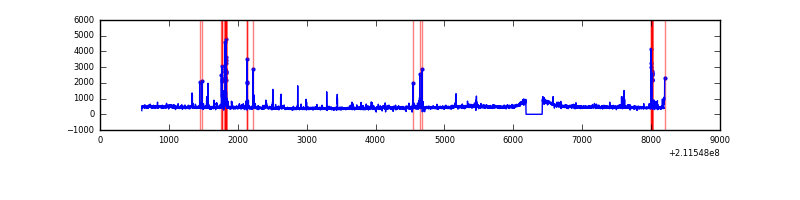 |
Top three noisy pixels from each quadrant. If the there are fewer than three noisy pixels in the level2.evt file, extra rows are filled as -1
| Pixel properties | Quadrant properties | ||||||
|---|---|---|---|---|---|---|---|
| Quadrant | DetID | PixID | Counts | Sigma | Mean | Median | Sigma |
| A | 0 | 50 | 111611 | 630.39 | 856 | 836 | 175.7 |
| A | 4 | 2 | 30417 | 168.34 | 856 | 836 | 175.7 |
| A | 13 | 251 | 16603 | 89.73 | 856 | 836 | 175.7 |
| B | 15 | 204 | 71926 | 421.28 | 862 | 841 | 168.7 |
| B | 0 | 219 | 50511 | 294.37 | 862 | 841 | 168.7 |
| B | 15 | 54 | 45399 | 264.07 | 862 | 841 | 168.7 |
| C | 1 | 16 | 63597 | 325.28 | 828 | 833 | 193.0 |
| C | 14 | 67 | 9297 | 43.86 | 828 | 833 | 193.0 |
| C | 13 | 61 | 6746 | 30.64 | 828 | 833 | 193.0 |
| D | 2 | 33 | 167802 | 825.42 | 828 | 802 | 202.3 |
| D | 2 | 136 | 92880 | 455.11 | 828 | 802 | 202.3 |
| D | 10 | 15 | 41457 | 200.94 | 828 | 802 | 202.3 |
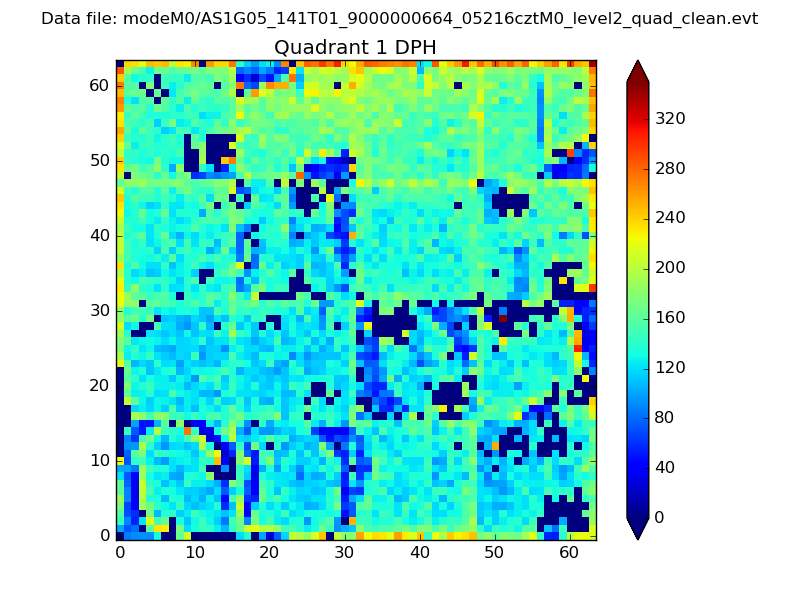
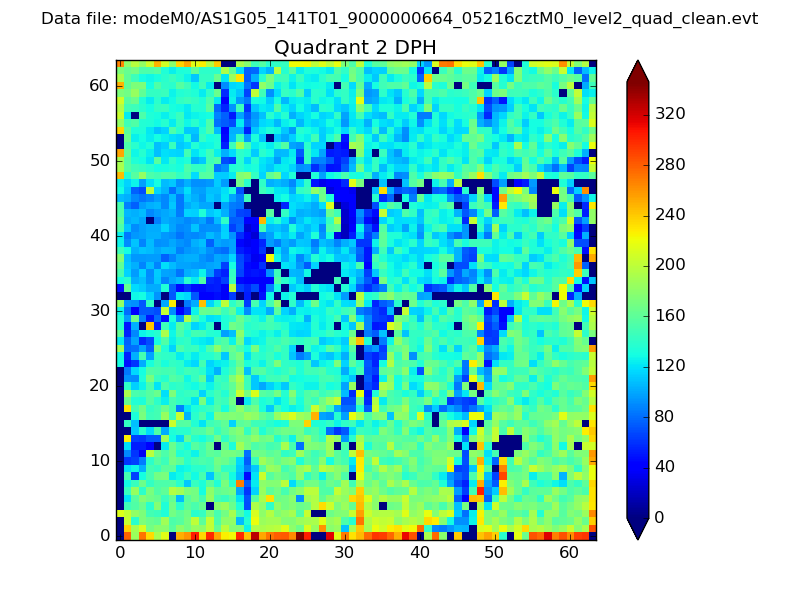
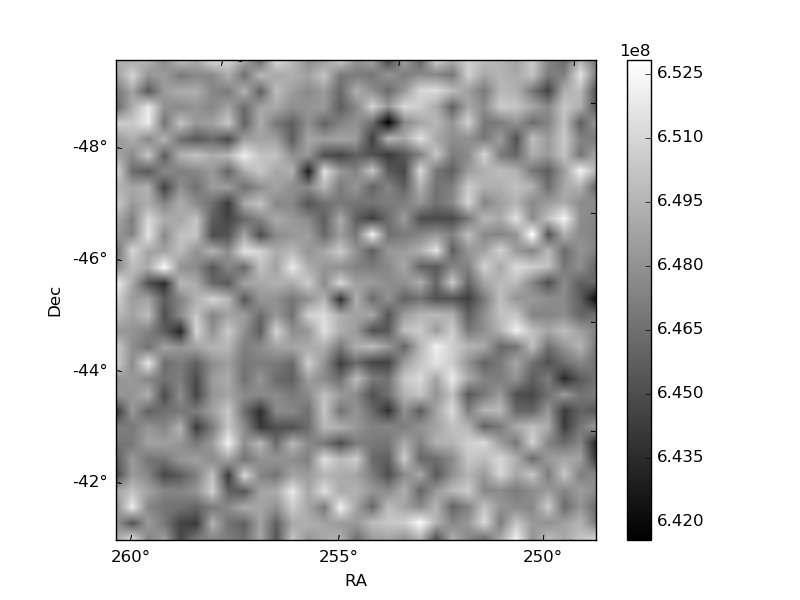
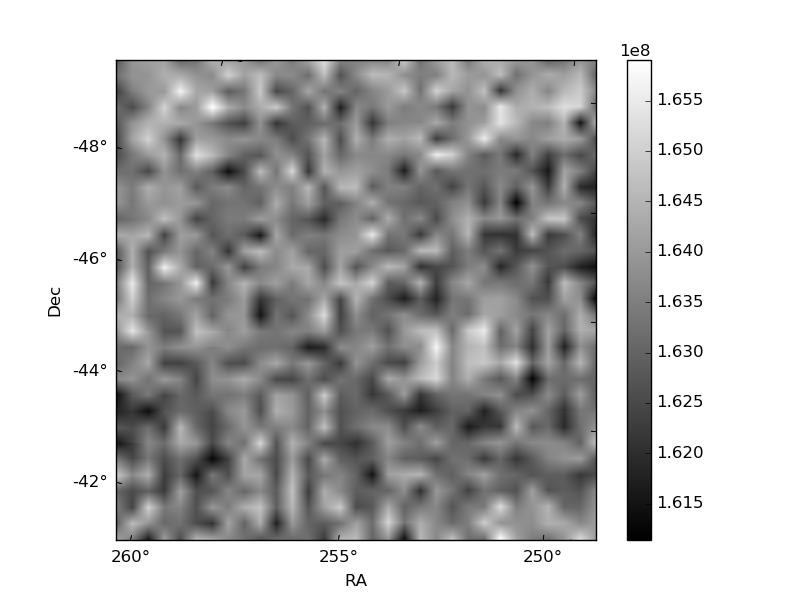
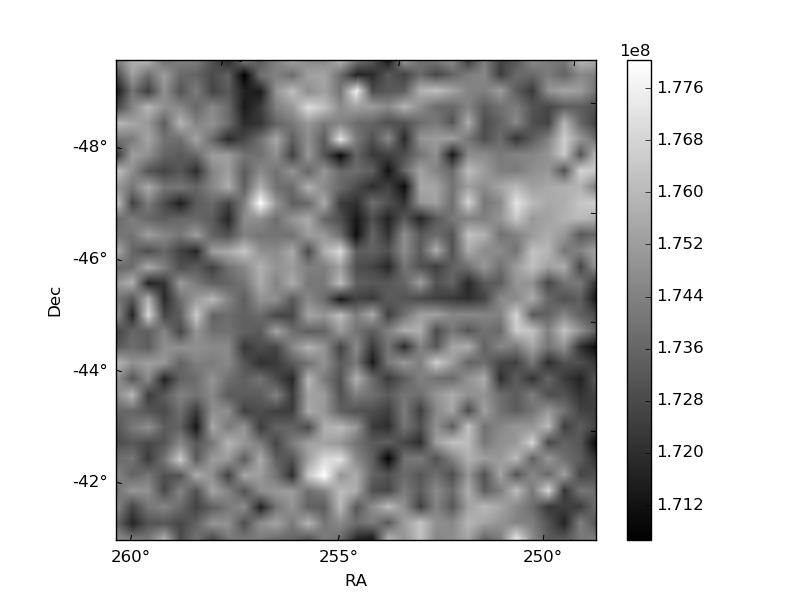
Histogram calculated using DETX and DETY for each event in the final _common_clean file
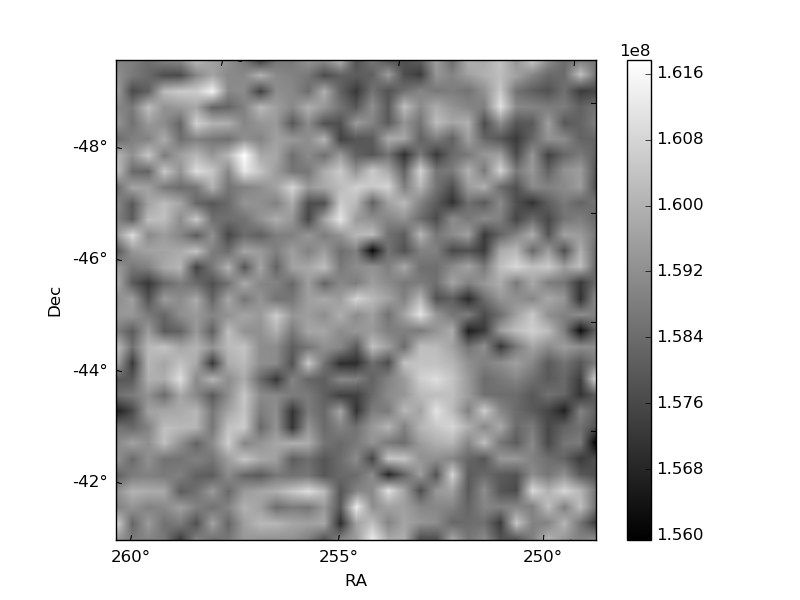
| Quadrant A | 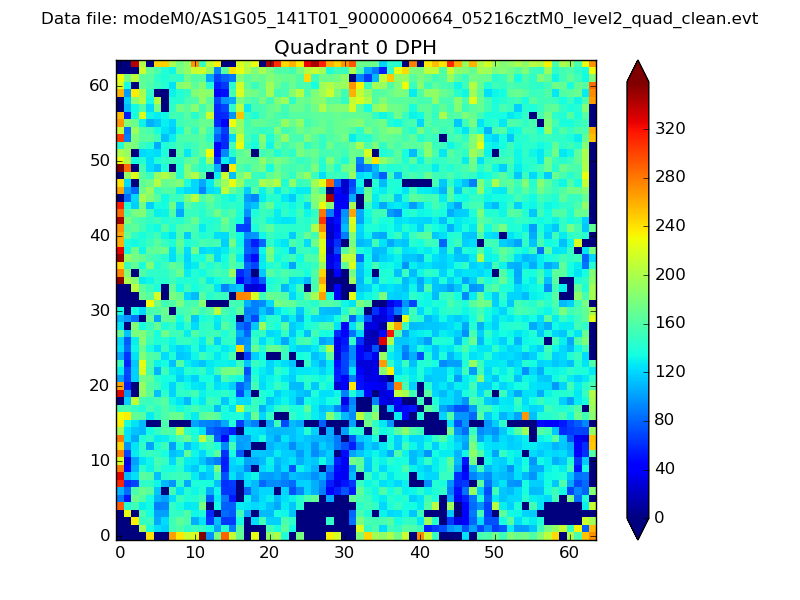 |
 |
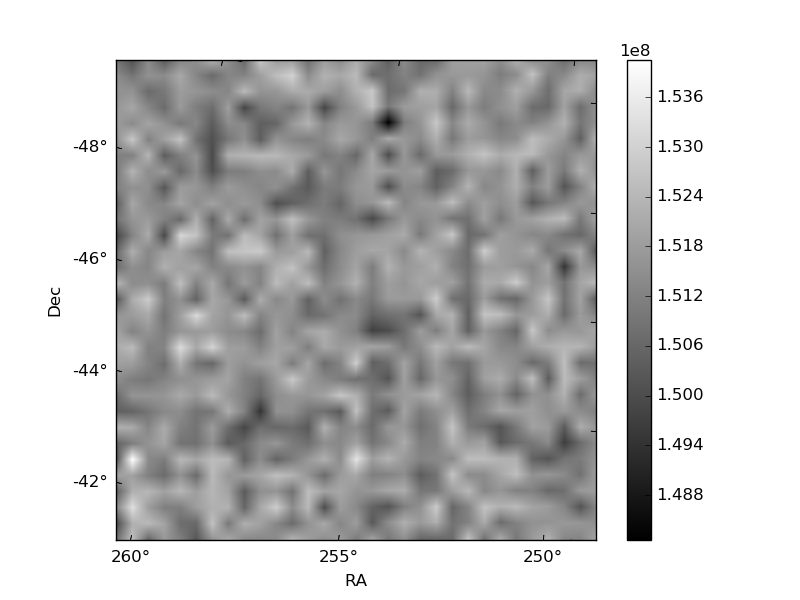
Quadrant B |
|---|---|---|---|
| Quadrant D | 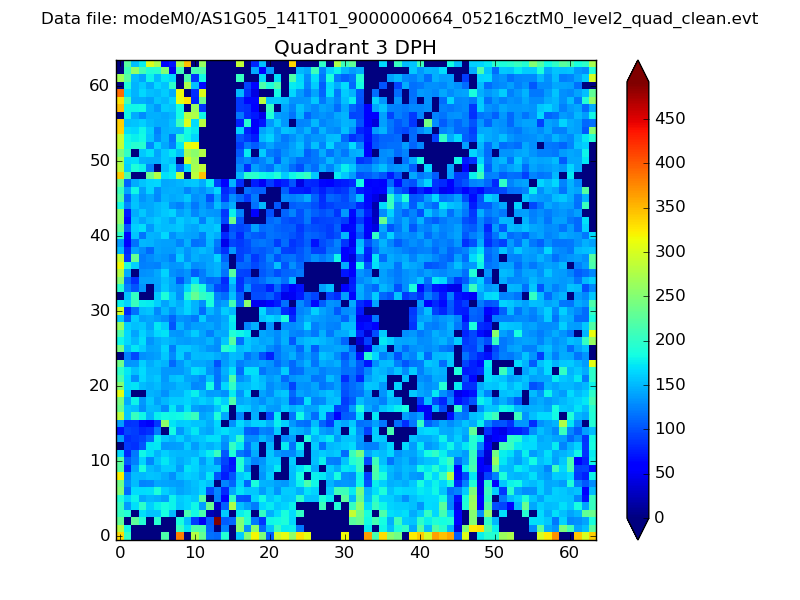 |
 |
Quadrant C |
| Plot type | Count rate plots | Images |
|---|---|---|
| Comparison with Poisson distribution Blue bars denote a histogram of data divided into 1 sec bins. Red curve is a Poisson curve with rate = median count rate of data. |
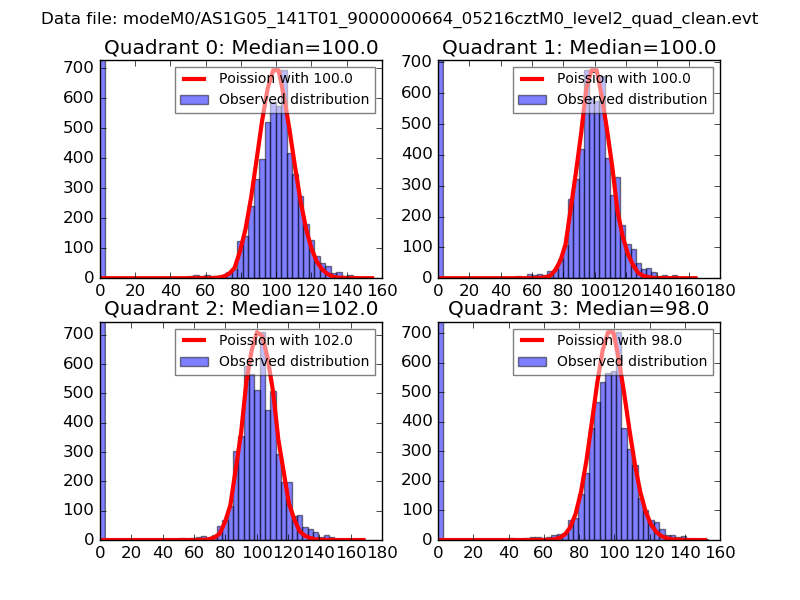 |
 |
| Quadrant-wise count rates Data is divided into 100 sec bins |
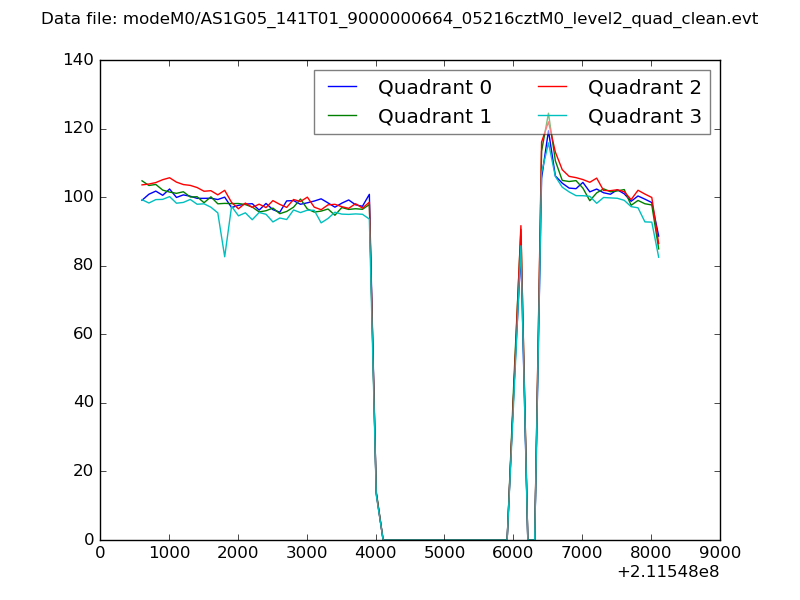 |
|
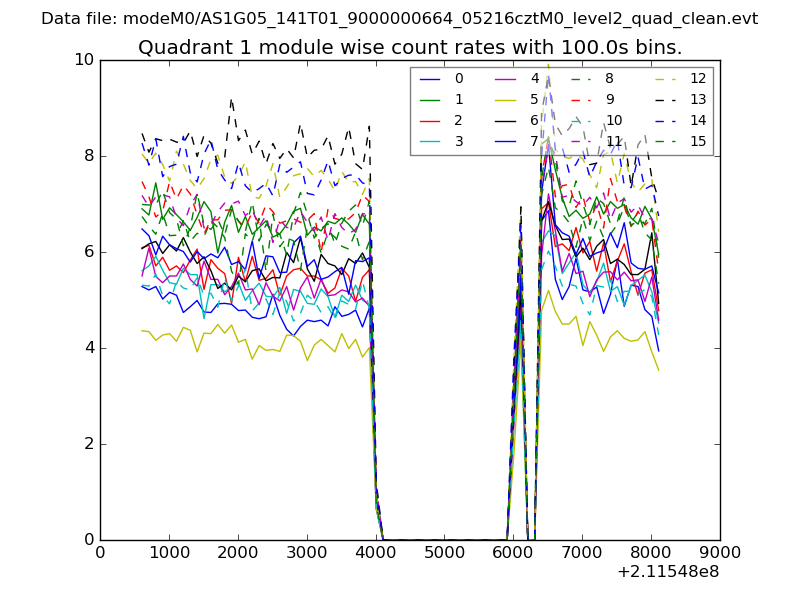
| Module-wise count rates for Quadrant A Data is divided into 100 sec bins |
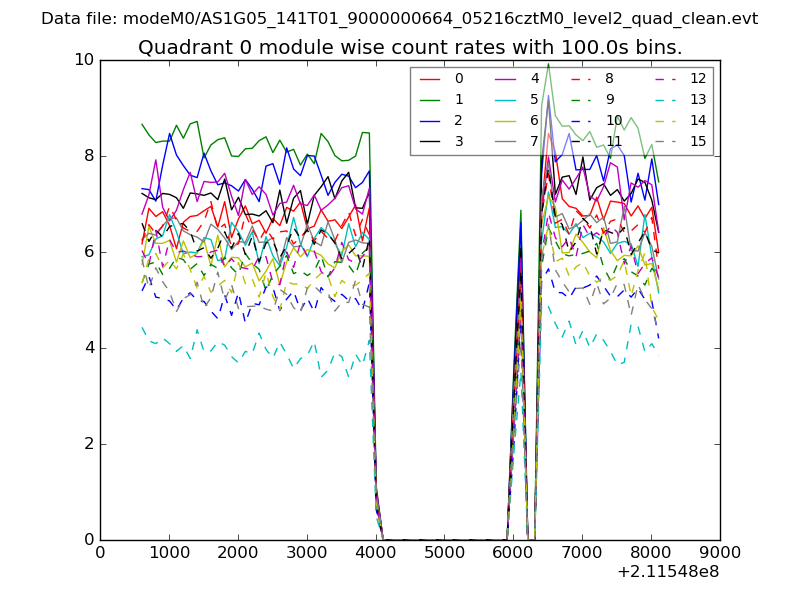 |
 |
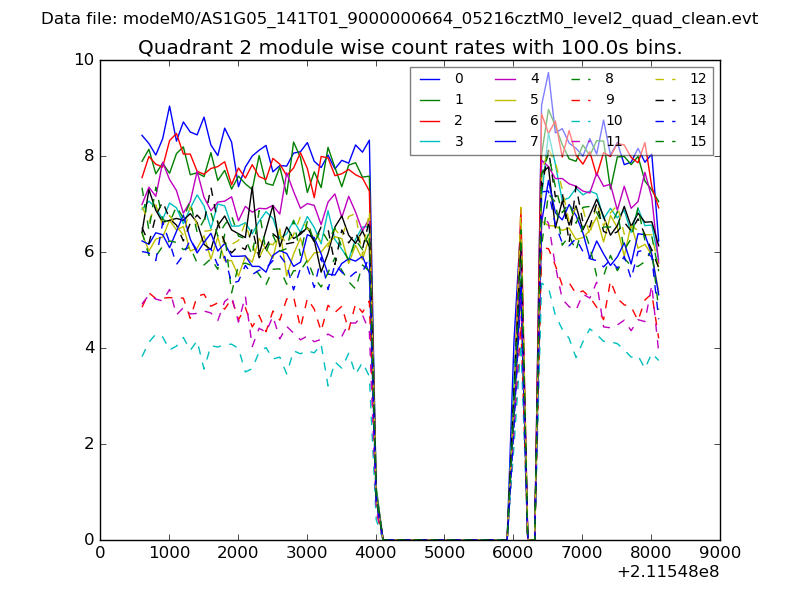
| Module-wise count rates for Quadrant B Data is divided into 100 sec bins |
 |
 |
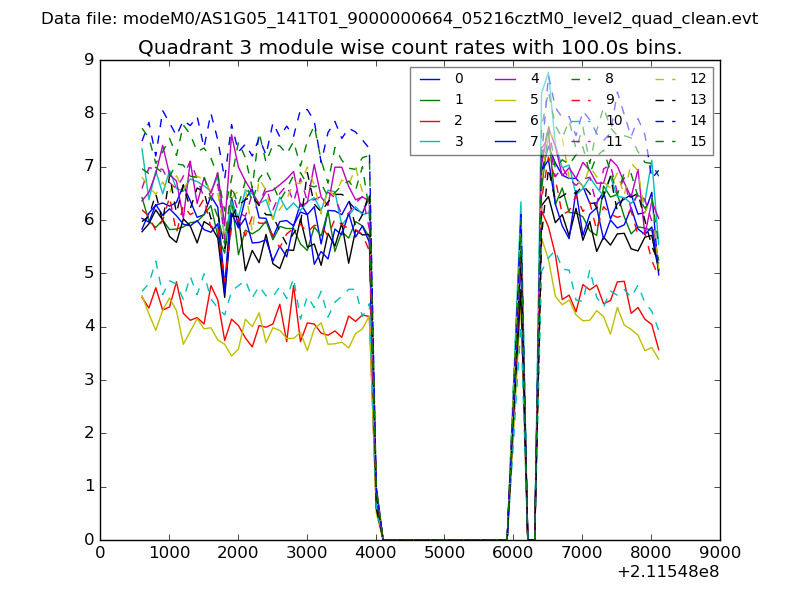
| Module-wise count rates for Quadrant C Data is divided into 100 sec bins |
 |
 |
| Module-wise count rates for Quadrant D Data is divided into 100 sec bins |
 |
 |
| Parameter | Plot |
|---|---|
| CZT HV Monitor | 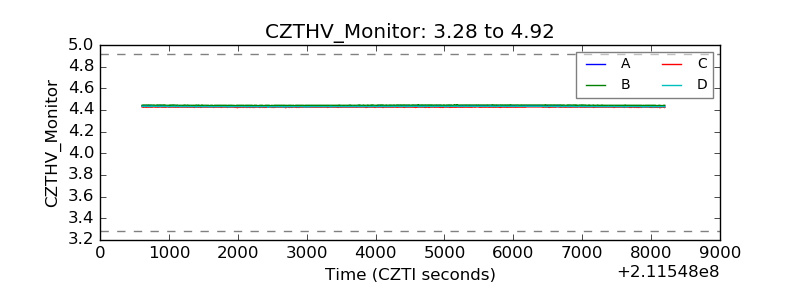 |
| D_VDD | 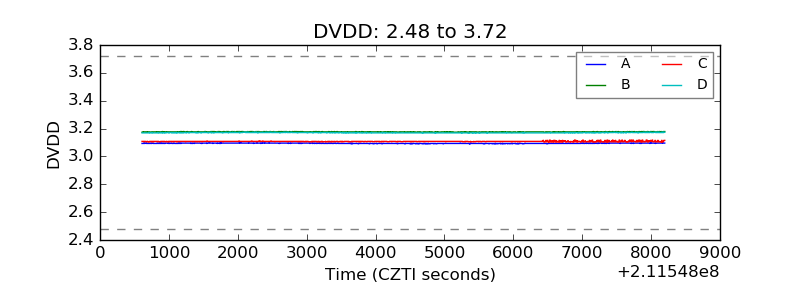 |
| Temperature 1 | 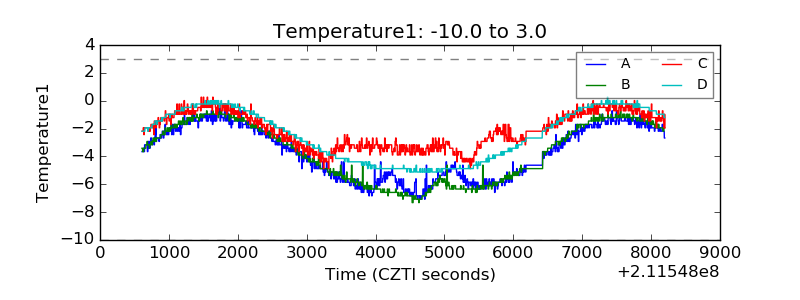 |
| Veto HV Monitor | 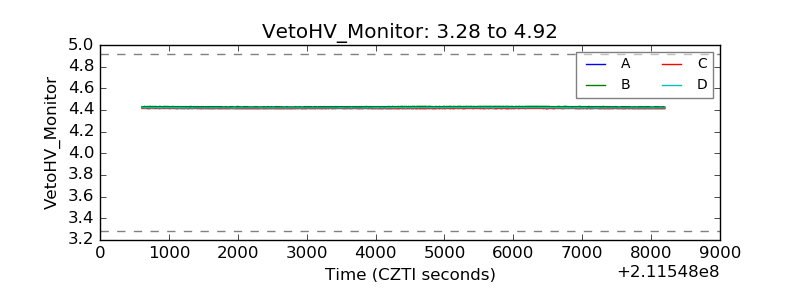 |
| Veto LLD | 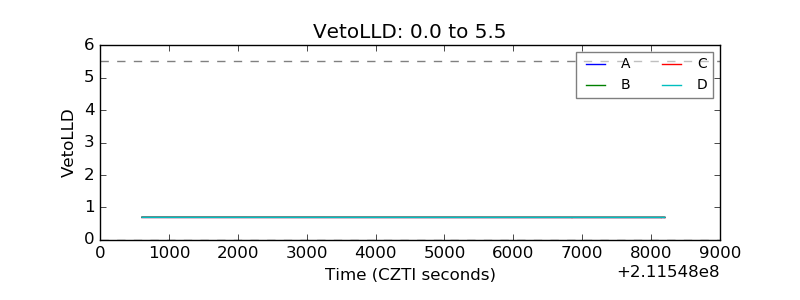 |
| Alpha Counter | 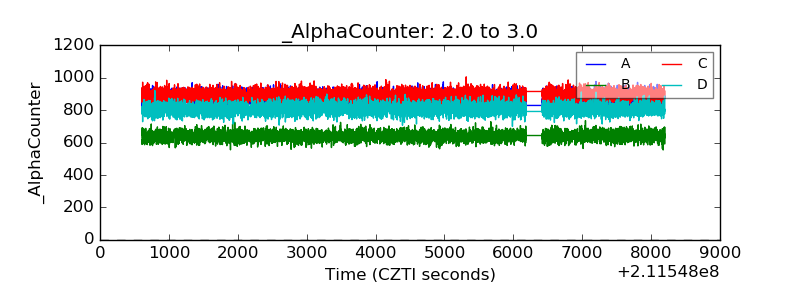 |
| _CPM_Rate | 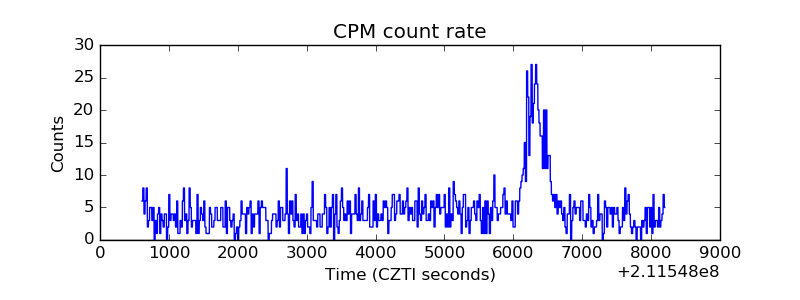 |
| CZT Counter | 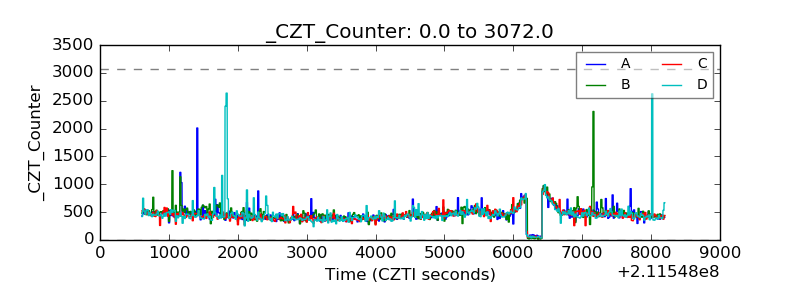 |
| +2.5 Volts monitor |  |
| +5 Volts monitor |  |
| _ROLL_ROT | 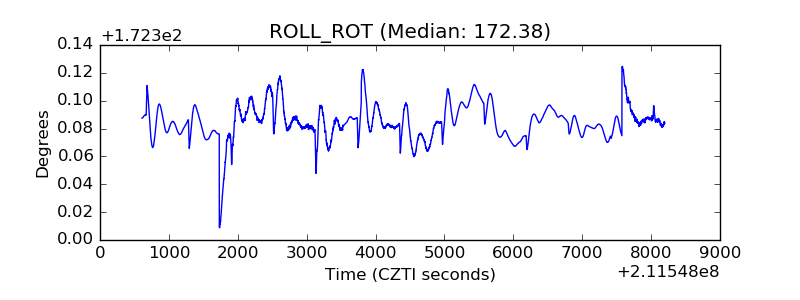 |
| _Roll_DEC | 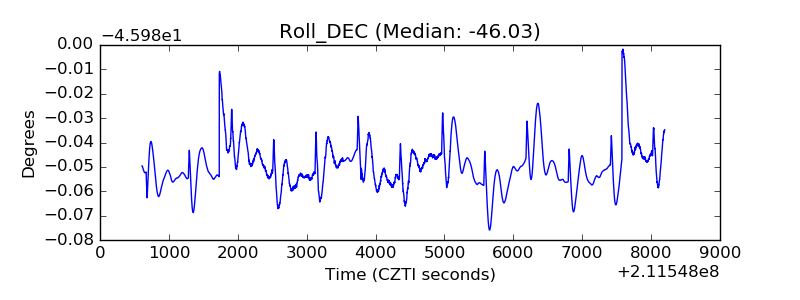 |
| _Roll_RA | 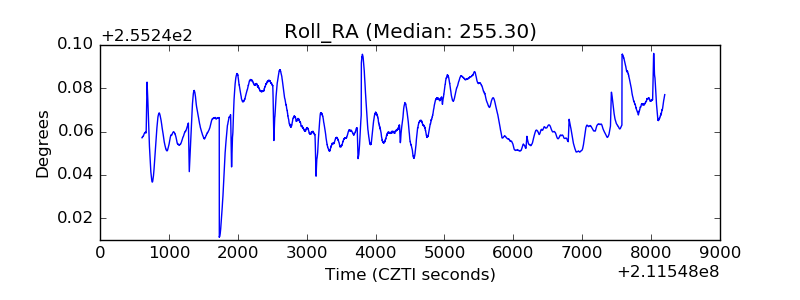 |
| Veto Counter | 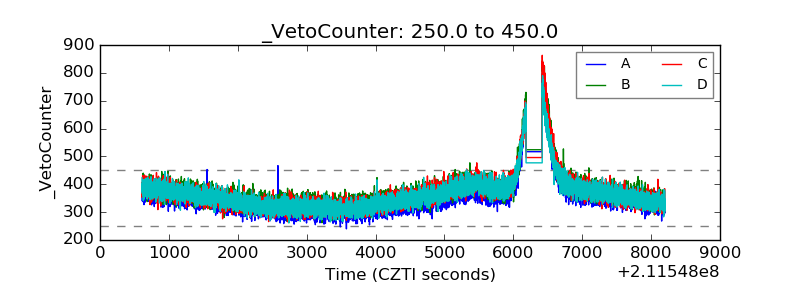 |