| Param | Original file | Final file |
|---|---|---|
| Filename | modeM0/AS1G05_141T01_9000000664_05219cztM0_level2.evt | modeM0/AS1G05_141T01_9000000664_05219cztM0_level2_quad_clean.evt |
| Size (bytes) | 1,564,971,840 | 189,365,760 |
| Size | 1.5 GB | 180.6 MB |
| Events in quadrant A | 8,246,463 | 1,195,988 |
| Events in quadrant B | 8,938,402 | 1,187,827 |
| Events in quadrant C | 7,952,568 | 1,203,826 |
| Events in quadrant D | 21,045,244 | 907,895 |
| Mode M9 | |||
|---|---|---|---|
| Quadrant | BADHDUFLAG | Total packets | Discarded packets |
| A | 0 | 21 | 0 |
| B | 0 | 21 | 0 |
| C | 0 | 21 | 0 |
| D | 0 | 21 | 0 |
| Mode M0 | |||
|---|---|---|---|
| Quadrant | BADHDUFLAG | Total packets | Discarded packets |
| A | 0 | 37411 | 4 |
| B | 0 | 38715 | 3 |
| C | 0 | 36625 | 3 |
| D | 0 | 75336 | 3 |
| Mode SS | |||
|---|---|---|---|
| Quadrant | BADHDUFLAG | Total packets | Discarded packets |
| A | 0 | 364 | 0 |
| B | 0 | 364 | 0 |
| C | 0 | 364 | 0 |
| D | 0 | 364 | 0 |
| Quadrant | Total seconds | Saturated seconds | Saturation percentage |
|---|---|---|---|
| A | 17959 | 176 | 0.980010% |
| B | 17959 | 256 | 1.425469% |
| C | 17959 | 33 | 0.183752% |
| D | 17959 | 5031 | 28.013809% |
Noise dominated data is calculated using 1-second bins in cleaned event files. If a bin has >2000 counts, and if more than 50% of those come from <1% of pixels, then it is considered to be noise-dominated and hence unusable.
| Quadrant | # 1 sec bins | Bins with >0 counts | Bins with >2000 counts | High rate bins dominated by noise | Noise dominated (total time) | Noise dominated (detector-on time) | Marked lightcurve |
|---|---|---|---|---|---|---|---|
| A | 20014 | 17962 | 52 | 52 | 0.26% | 0.29% | 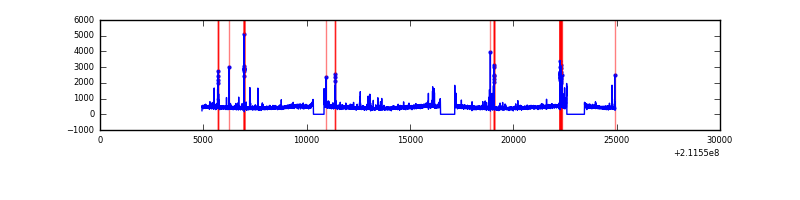 |
| B | 20014 | 17962 | 145 | 145 | 0.72% | 0.81% | 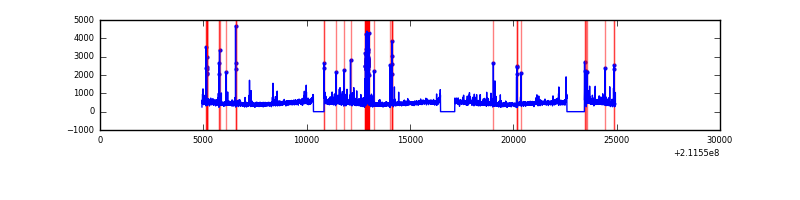 |
| C | 20014 | 17962 | 3 | 3 | 0.01% | 0.02% | 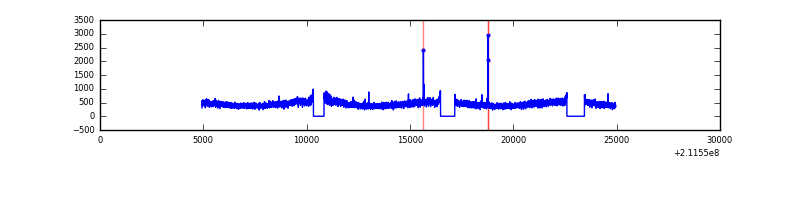 |
| D | 20014 | 17962 | 4223 | 4223 | 21.10% | 23.51% | 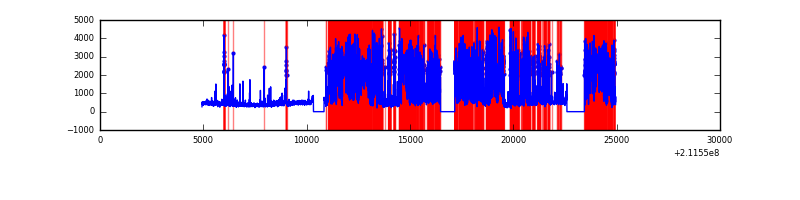 |
Top three noisy pixels from each quadrant. If the there are fewer than three noisy pixels in the level2.evt file, extra rows are filled as -1
| Pixel properties | Quadrant properties | ||||||
|---|---|---|---|---|---|---|---|
| Quadrant | DetID | PixID | Counts | Sigma | Mean | Median | Sigma |
| A | 0 | 50 | 385308 | 918.61 | 2037 | 1993 | 417.3 |
| A | 12 | 194 | 20734 | 44.91 | 2037 | 1993 | 417.3 |
| A | 0 | 226 | 20255 | 43.76 | 2037 | 1993 | 417.3 |
| B | 5 | 172 | 342272 | 864.75 | 2051 | 2005 | 393.5 |
| B | 4 | 80 | 144641 | 362.49 | 2051 | 2005 | 393.5 |
| B | 15 | 204 | 123295 | 308.24 | 2051 | 2005 | 393.5 |
| C | 1 | 16 | 200917 | 436.25 | 1971 | 1977 | 456.0 |
| C | 12 | 4 | 25636 | 51.88 | 1971 | 1977 | 456.0 |
| C | 13 | 61 | 16278 | 31.36 | 1971 | 1977 | 456.0 |
| D | 11 | 145 | 13696797 | 33415.93 | 1674 | 1617 | 409.8 |
| D | 2 | 33 | 346517 | 841.55 | 1674 | 1617 | 409.8 |
| D | 12 | 233 | 251131 | 608.81 | 1674 | 1617 | 409.8 |
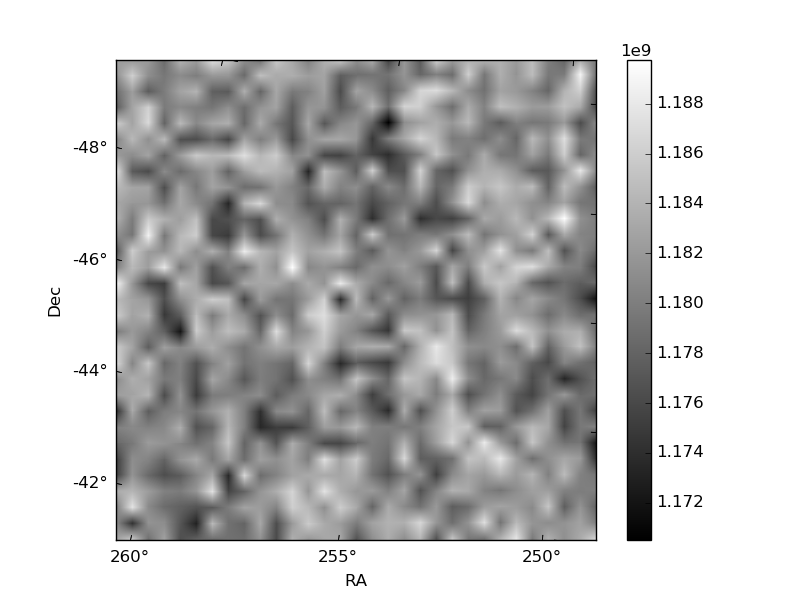
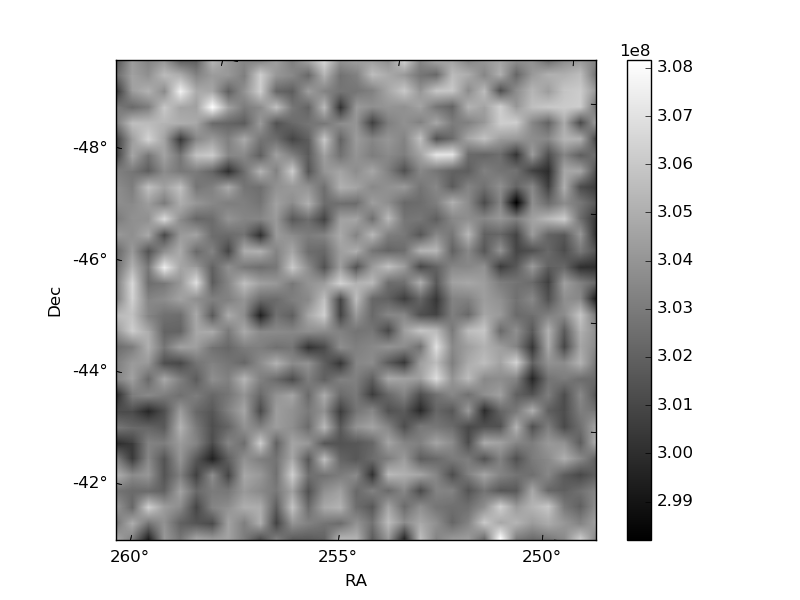
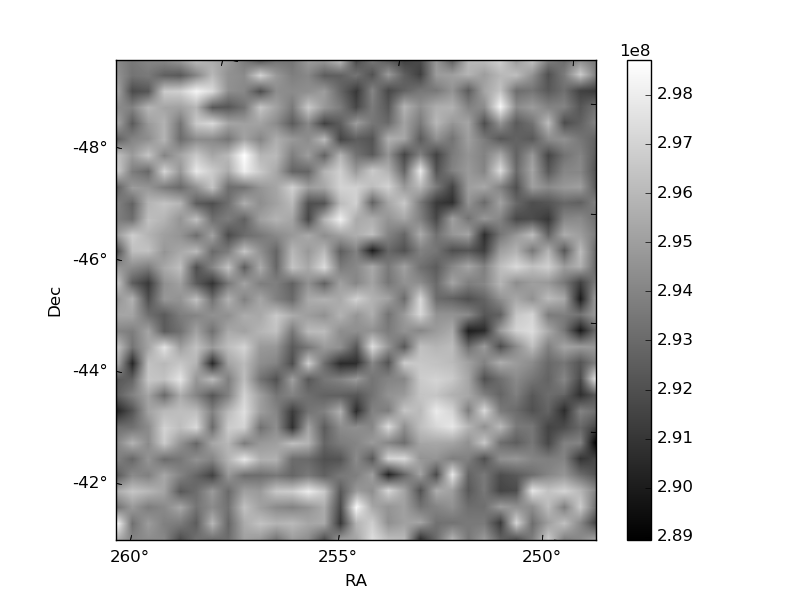
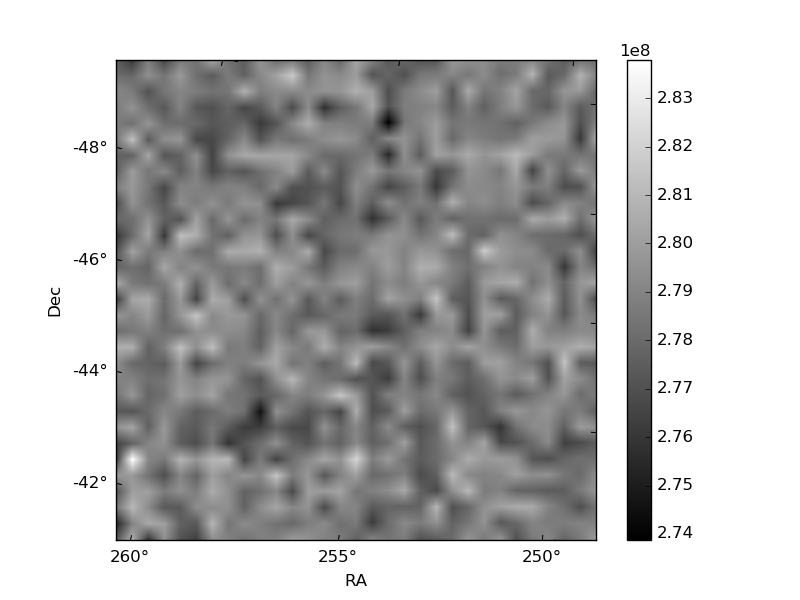
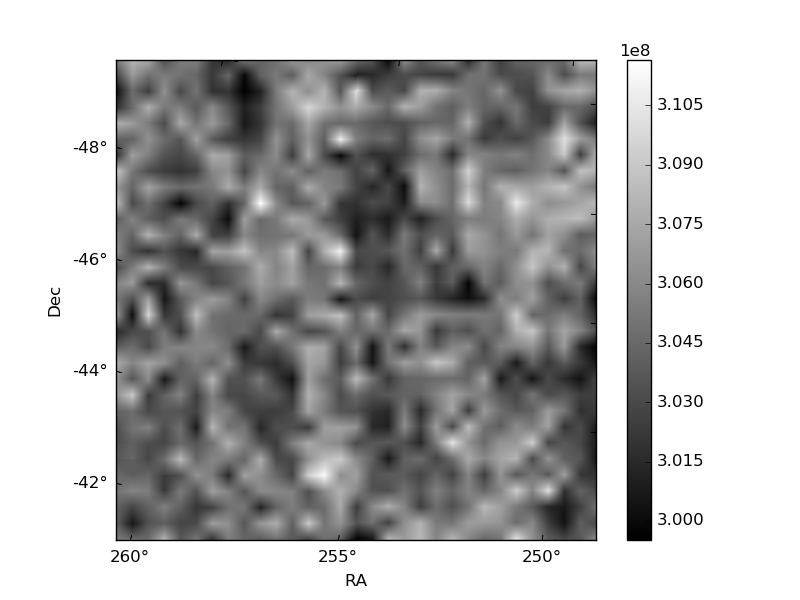
Histogram calculated using DETX and DETY for each event in the final _common_clean file
| Quadrant A | 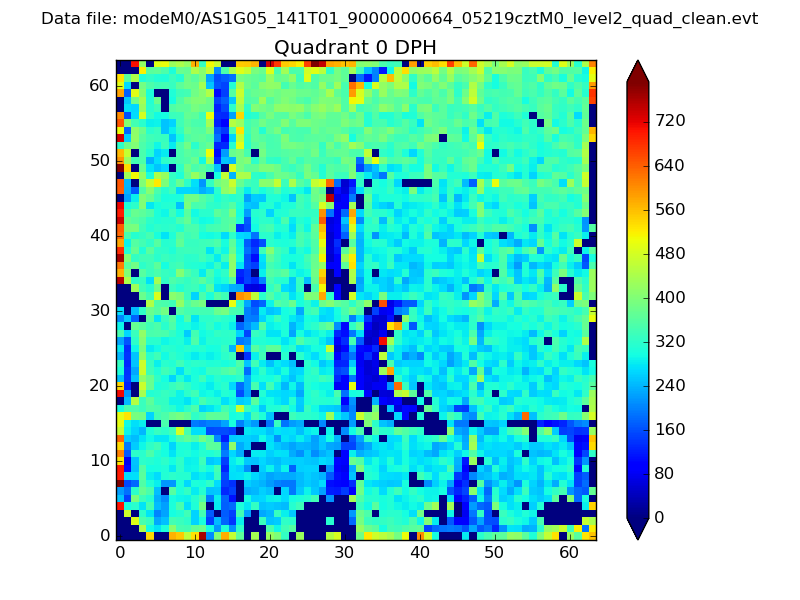 |
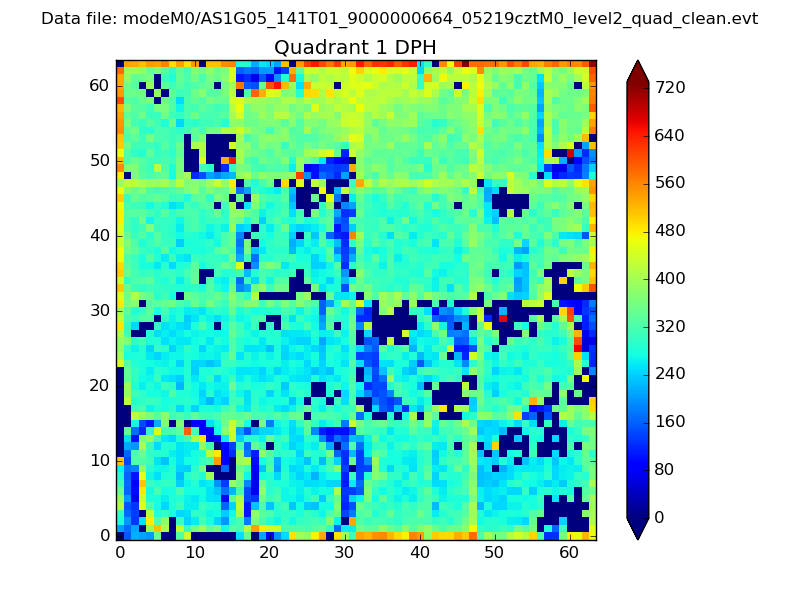 |
Quadrant B |
|---|---|---|---|
| Quadrant D | 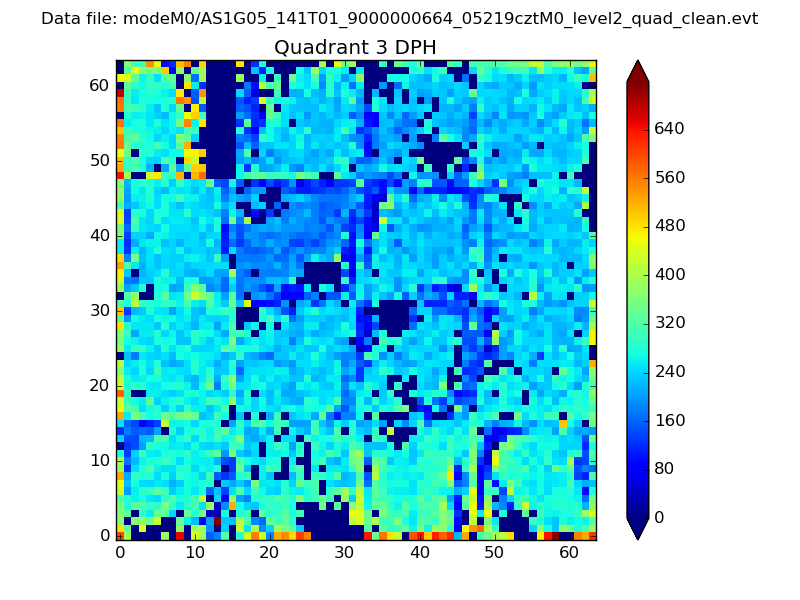 |
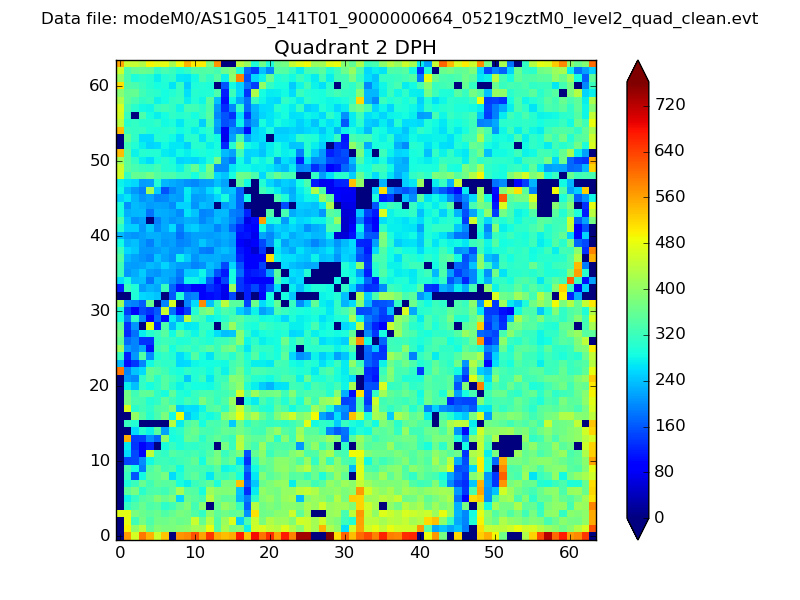 |
Quadrant C |
| Plot type | Count rate plots | Images |
|---|---|---|
| Comparison with Poisson distribution Blue bars denote a histogram of data divided into 1 sec bins. Red curve is a Poisson curve with rate = median count rate of data. |
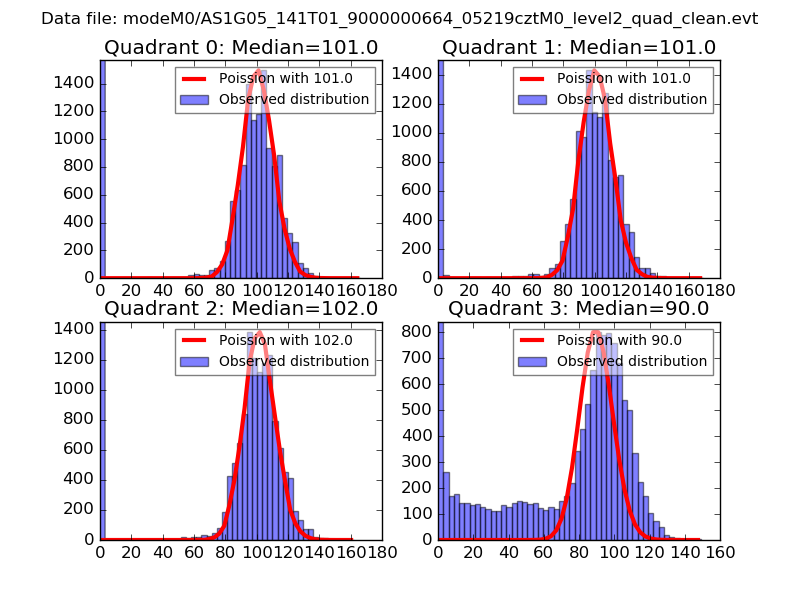 |
 |
| Quadrant-wise count rates Data is divided into 100 sec bins |
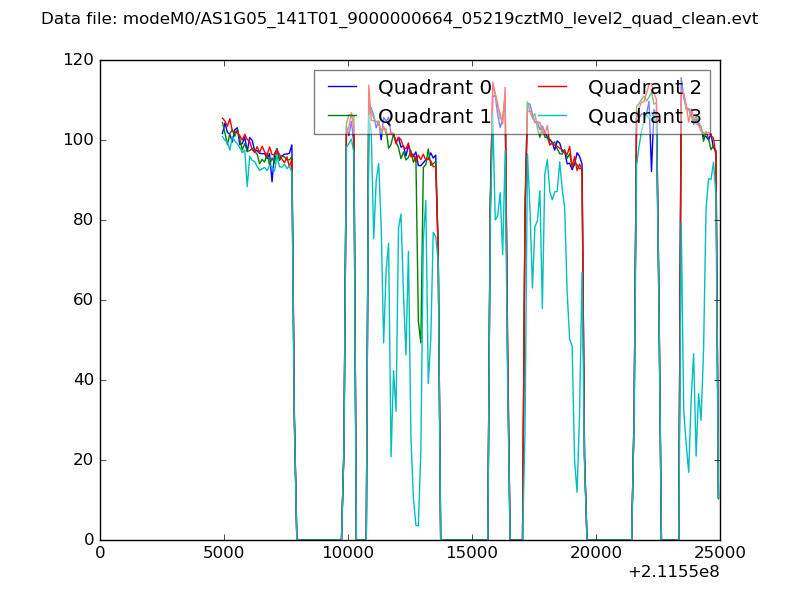 |
|
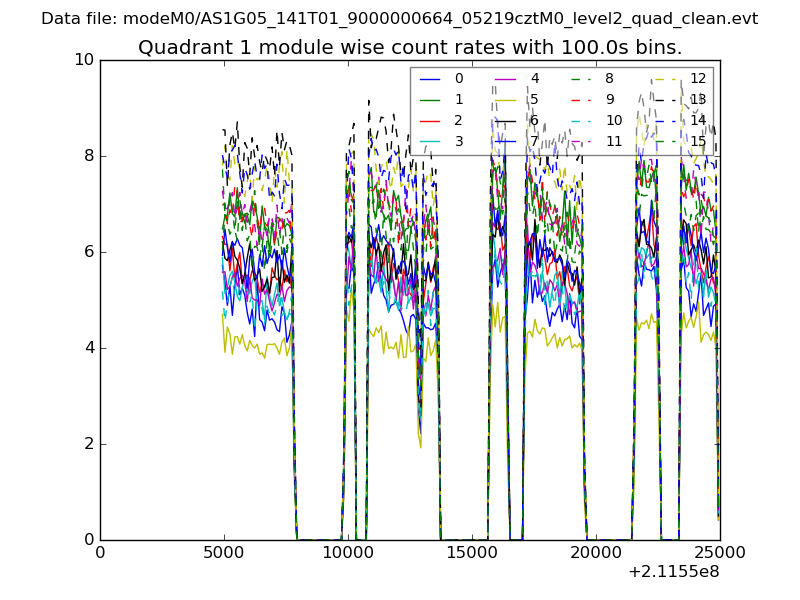
| Module-wise count rates for Quadrant A Data is divided into 100 sec bins |
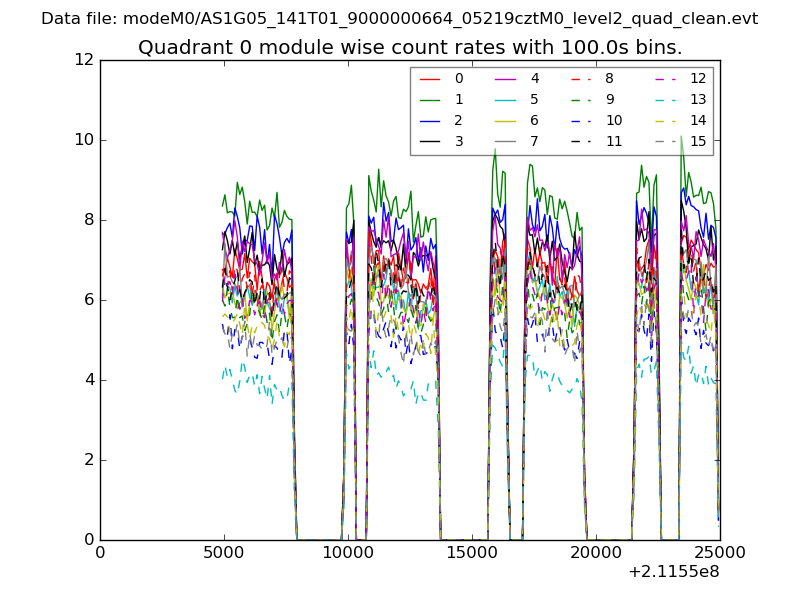 |
 |
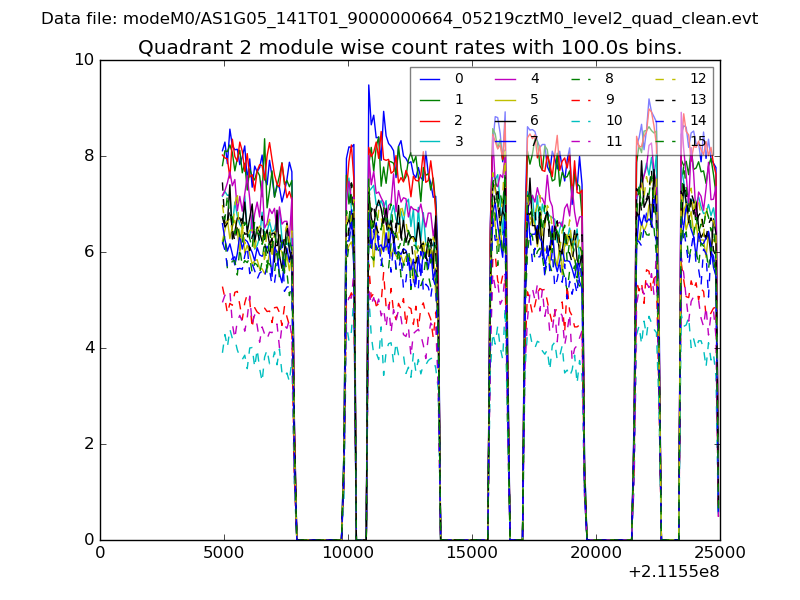
| Module-wise count rates for Quadrant B Data is divided into 100 sec bins |
 |
 |
| Module-wise count rates for Quadrant C Data is divided into 100 sec bins |
 |
 |
| Module-wise count rates for Quadrant D Data is divided into 100 sec bins |
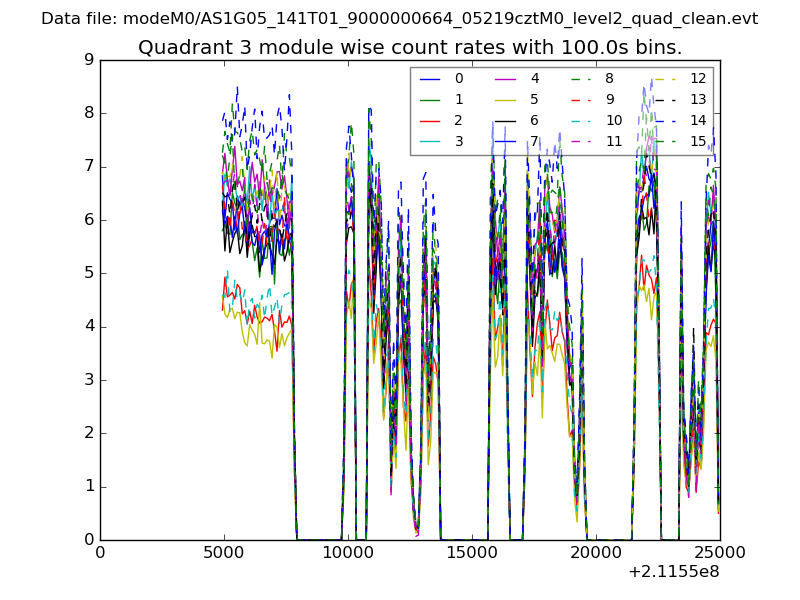 |
 |
| Parameter | Plot |
|---|---|
| CZT HV Monitor | 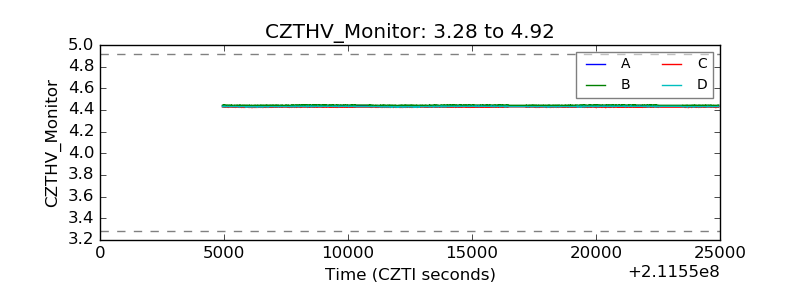 |
| D_VDD | 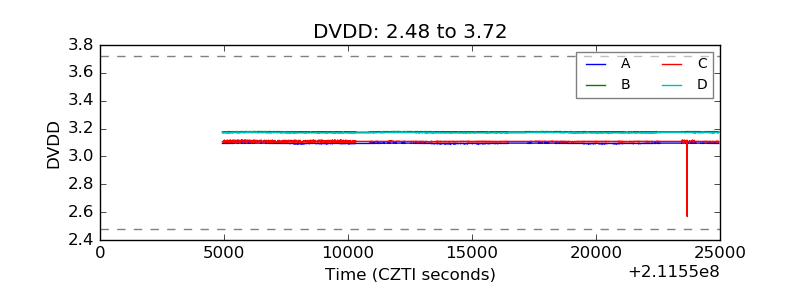 |
| Temperature 1 | 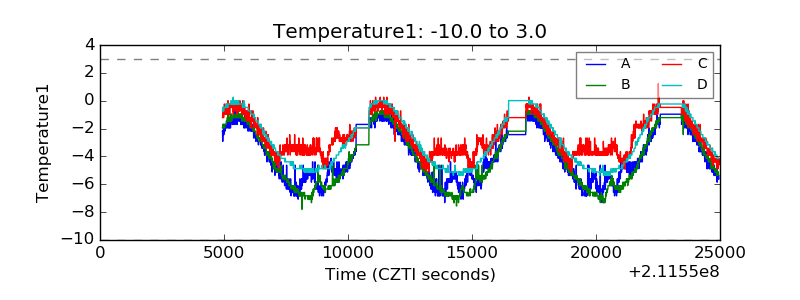 |
| Veto HV Monitor | 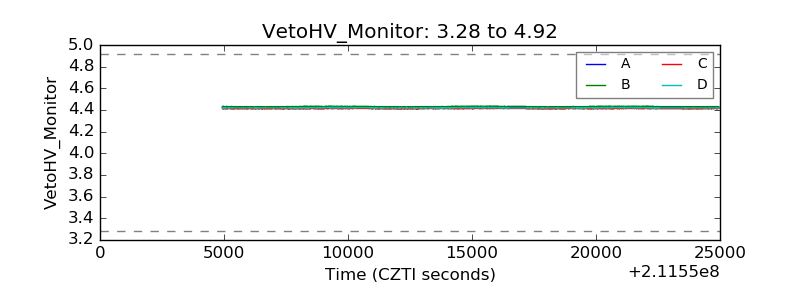 |
| Veto LLD | 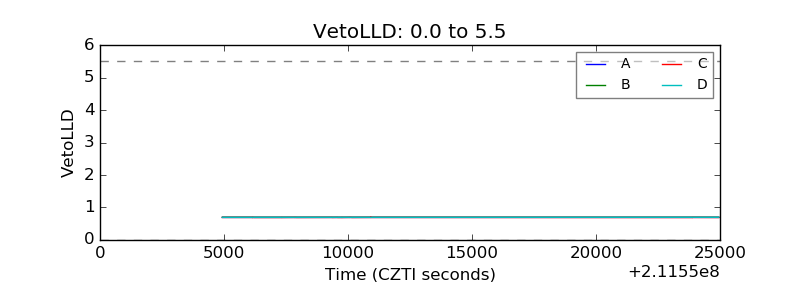 |
| Alpha Counter | 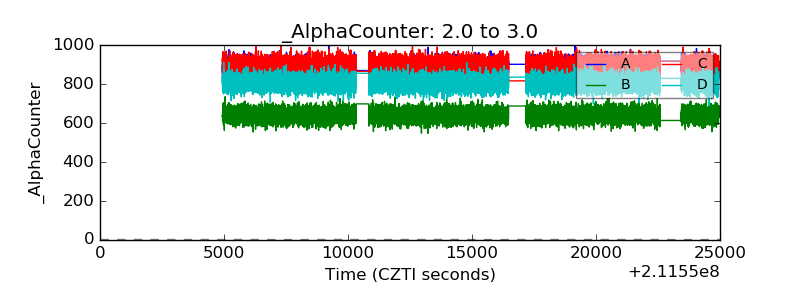 |
| _CPM_Rate | 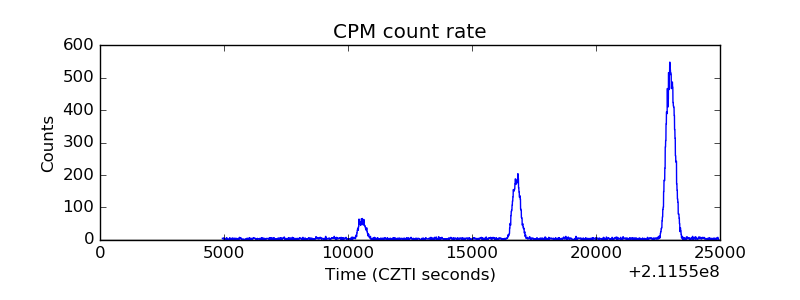 |
| CZT Counter | 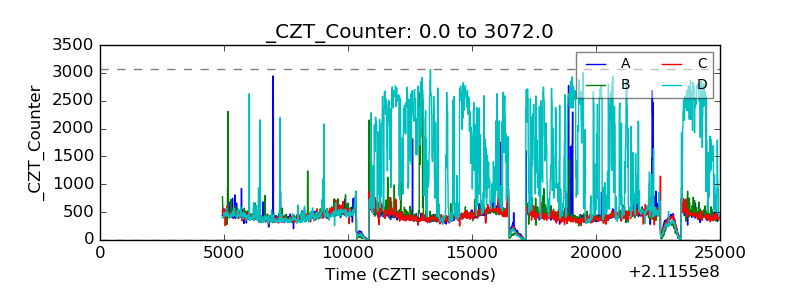 |
| +2.5 Volts monitor |  |
| +5 Volts monitor |  |
| _ROLL_ROT | 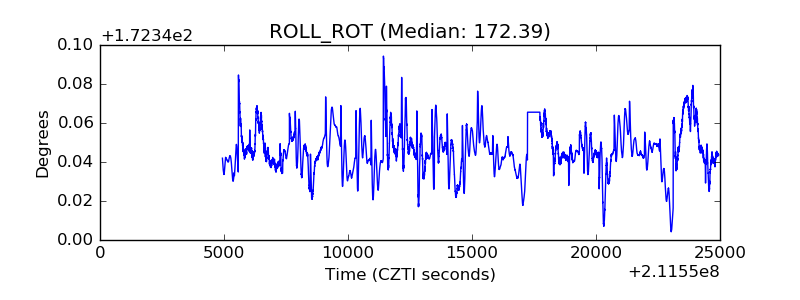 |
| _Roll_DEC | 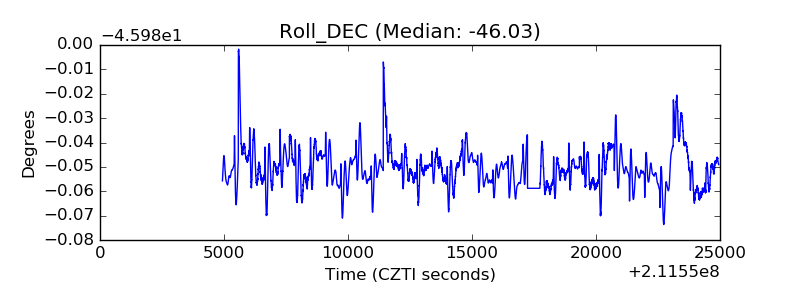 |
| _Roll_RA | 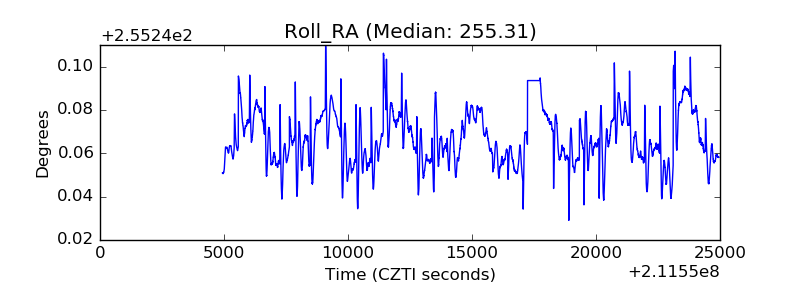 |
| Veto Counter | 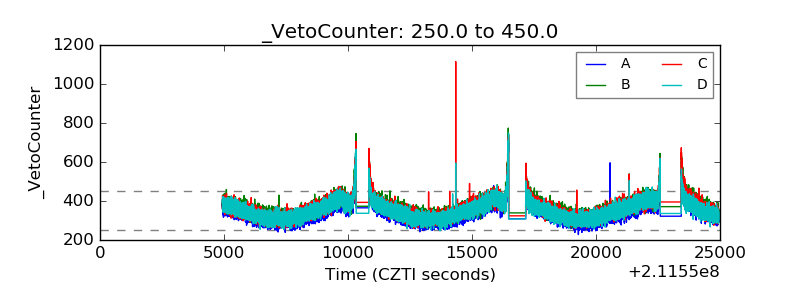 |