| Param | Original file | Final file |
|---|---|---|
| Filename | modeM0/AS1G05_141T01_9000000664_05220cztM0_level2.evt | modeM0/AS1G05_141T01_9000000664_05220cztM0_level2_quad_clean.evt |
| Size (bytes) | 616,515,840 | 73,385,280 |
| Size | 588.0 MB | 70.0 MB |
| Events in quadrant A | 3,073,559 | 474,098 |
| Events in quadrant B | 3,159,169 | 477,936 |
| Events in quadrant C | 2,864,762 | 478,472 |
| Events in quadrant D | 9,131,317 | 335,684 |
| Mode M9 | |||
|---|---|---|---|
| Quadrant | BADHDUFLAG | Total packets | Discarded packets |
| A | 0 | 10 | 0 |
| B | 0 | 10 | 0 |
| C | 0 | 10 | 0 |
| D | 0 | 10 | 0 |
| Mode M0 | |||
|---|---|---|---|
| Quadrant | BADHDUFLAG | Total packets | Discarded packets |
| A | 0 | 13746 | 3 |
| B | 0 | 13788 | 2 |
| C | 0 | 13180 | 2 |
| D | 0 | 31689 | 5 |
| Mode SS | |||
|---|---|---|---|
| Quadrant | BADHDUFLAG | Total packets | Discarded packets |
| A | 0 | 132 | 0 |
| B | 0 | 132 | 0 |
| C | 0 | 132 | 0 |
| D | 0 | 132 | 0 |
| Quadrant | Total seconds | Saturated seconds | Saturation percentage |
|---|---|---|---|
| A | 6524 | 39 | 0.597793% |
| B | 6524 | 20 | 0.306560% |
| C | 6524 | 7 | 0.107296% |
| D | 6523 | 2443 | 37.452093% |
Noise dominated data is calculated using 1-second bins in cleaned event files. If a bin has >2000 counts, and if more than 50% of those come from <1% of pixels, then it is considered to be noise-dominated and hence unusable.
| Quadrant | # 1 sec bins | Bins with >0 counts | Bins with >2000 counts | High rate bins dominated by noise | Noise dominated (total time) | Noise dominated (detector-on time) | Marked lightcurve |
|---|---|---|---|---|---|---|---|
| A | 7545 | 6526 | 30 | 30 | 0.40% | 0.46% | 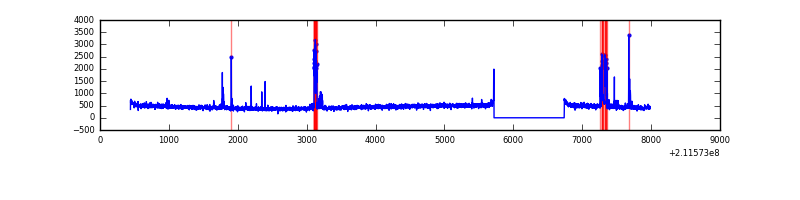 |
| B | 7545 | 6526 | 9 | 9 | 0.12% | 0.14% | 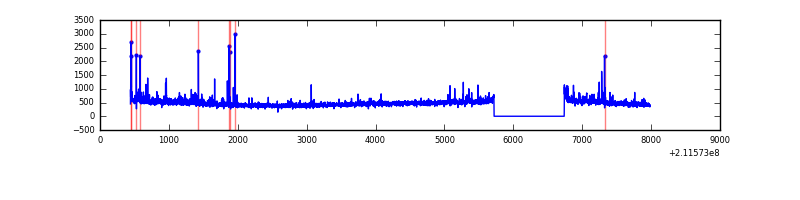 |
| C | 7545 | 6526 | 0 | 0 | 0.00% | 0.00% | 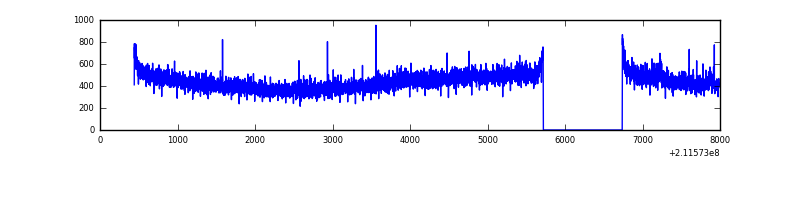 |
| D | 7544 | 6525 | 2166 | 2166 | 28.71% | 33.20% | 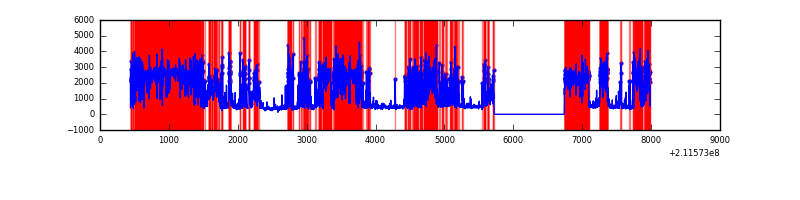 |
Top three noisy pixels from each quadrant. If the there are fewer than three noisy pixels in the level2.evt file, extra rows are filled as -1
| Pixel properties | Quadrant properties | ||||||
|---|---|---|---|---|---|---|---|
| Quadrant | DetID | PixID | Counts | Sigma | Mean | Median | Sigma |
| A | 0 | 50 | 216065 | 1392.86 | 743 | 726 | 154.6 |
| A | 12 | 194 | 7504 | 43.84 | 743 | 726 | 154.6 |
| A | 0 | 226 | 7375 | 43.01 | 743 | 726 | 154.6 |
| B | 0 | 219 | 75112 | 504.48 | 755 | 738 | 147.4 |
| B | 4 | 80 | 43701 | 291.42 | 755 | 738 | 147.4 |
| B | 15 | 204 | 32616 | 216.23 | 755 | 738 | 147.4 |
| C | 1 | 16 | 38063 | 222.13 | 721 | 725 | 168.1 |
| C | 13 | 61 | 5918 | 30.89 | 721 | 725 | 168.1 |
| C | 12 | 4 | 5370 | 27.63 | 721 | 725 | 168.1 |
| D | 11 | 145 | 5902560 | 42236.5 | 563 | 545 | 139.7 |
| D | 2 | 33 | 804856 | 5755.88 | 563 | 545 | 139.7 |
| D | 12 | 233 | 133082 | 948.47 | 563 | 545 | 139.7 |
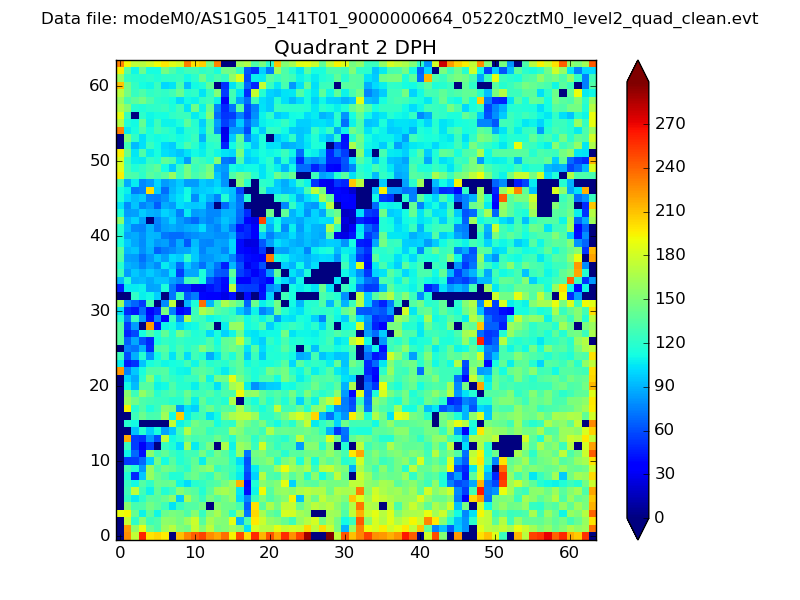
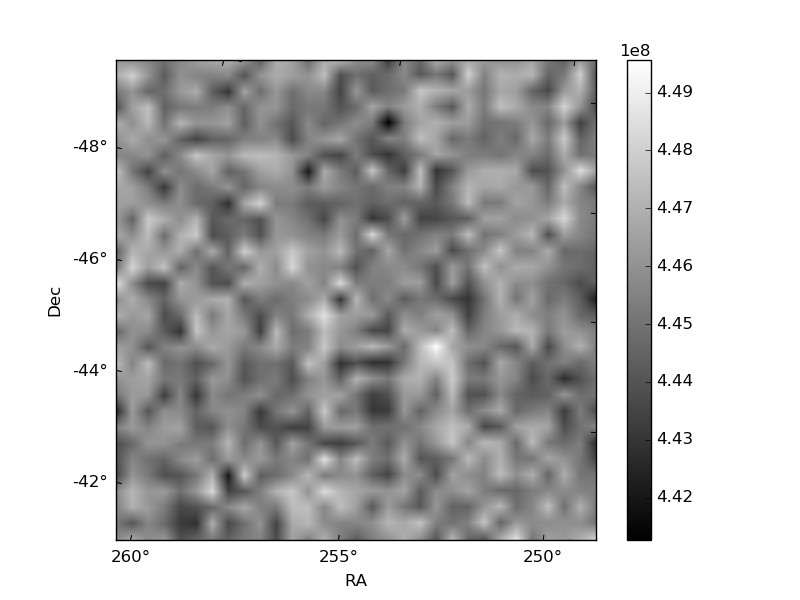
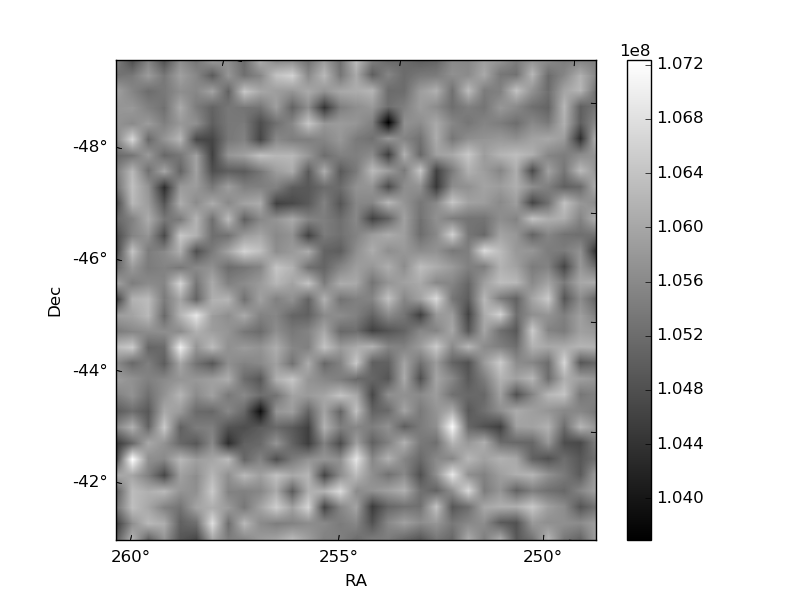
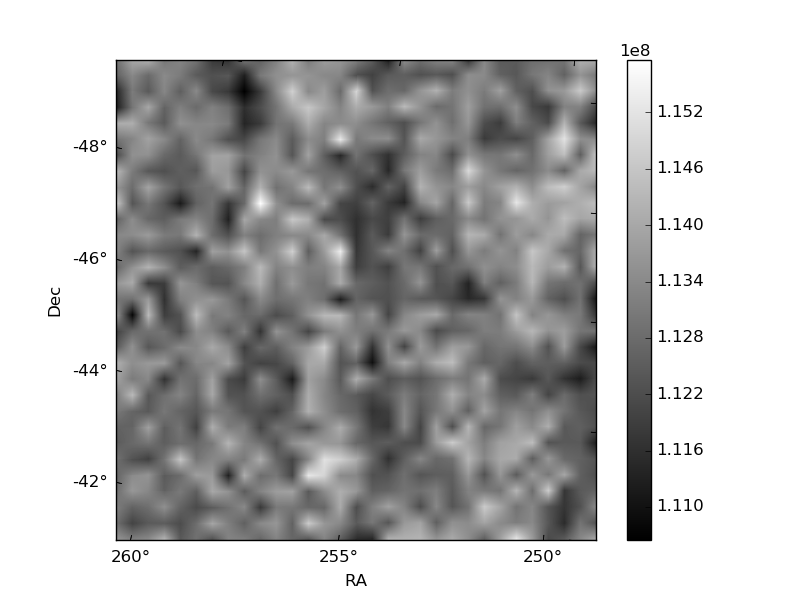
Histogram calculated using DETX and DETY for each event in the final _common_clean file
| Quadrant A | 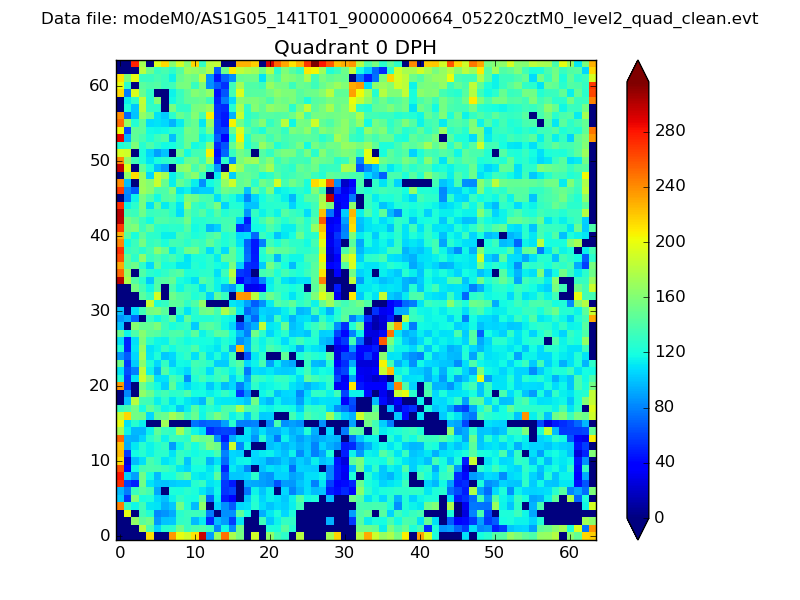 |
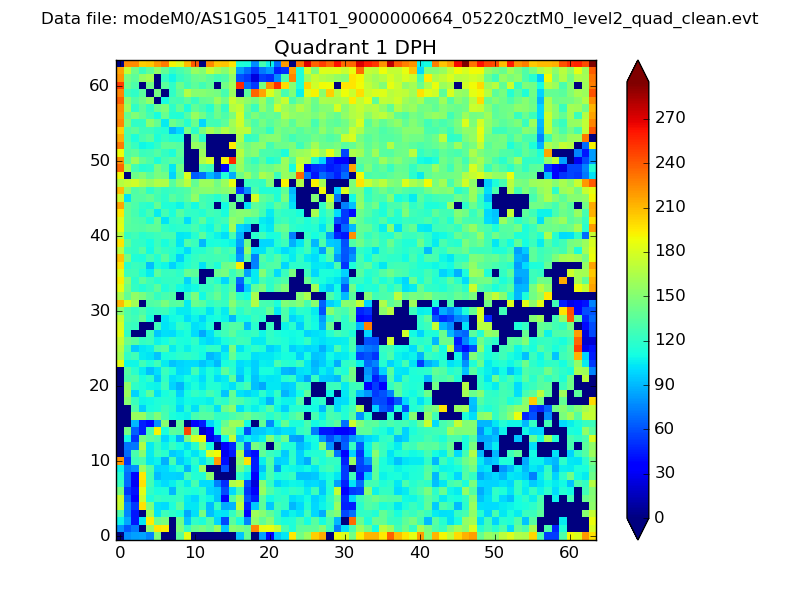 |
Quadrant B |
|---|---|---|---|
| Quadrant D | 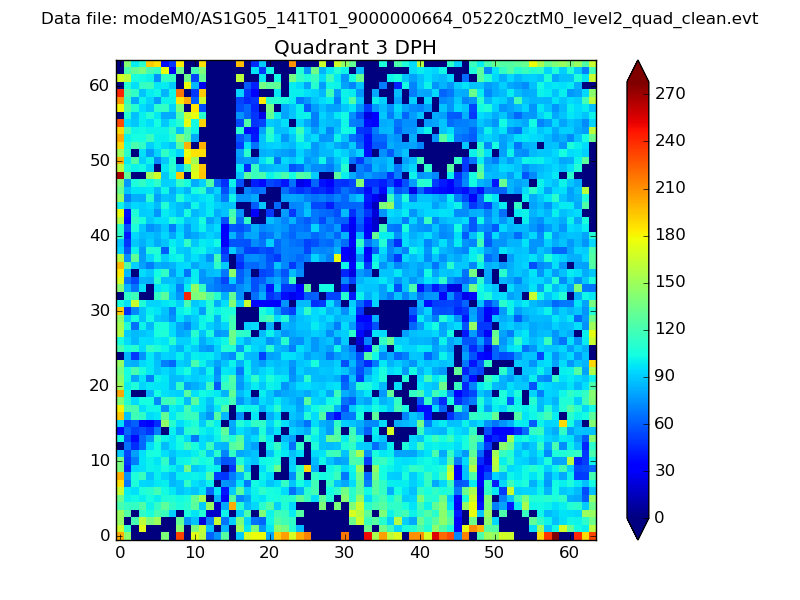 |
 |
Quadrant C |
| Plot type | Count rate plots | Images |
|---|---|---|
| Comparison with Poisson distribution Blue bars denote a histogram of data divided into 1 sec bins. Red curve is a Poisson curve with rate = median count rate of data. |
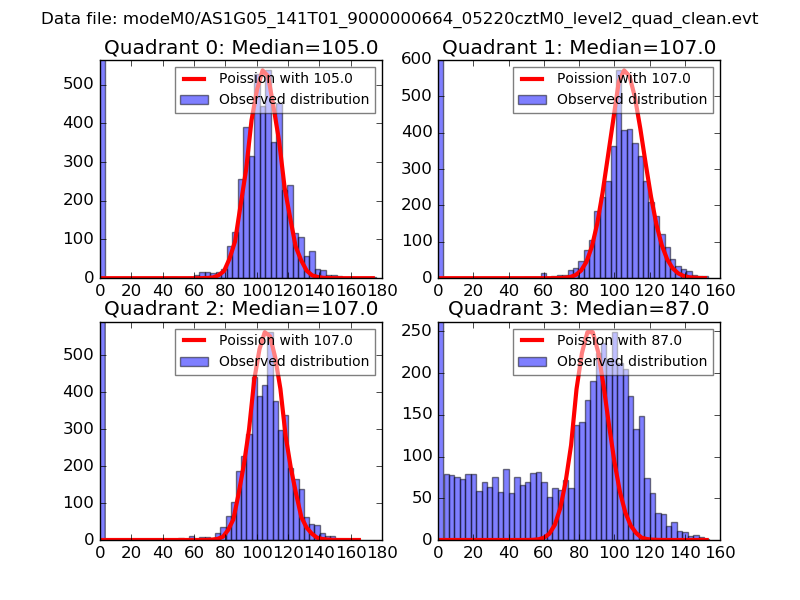 |
 |
| Quadrant-wise count rates Data is divided into 100 sec bins |
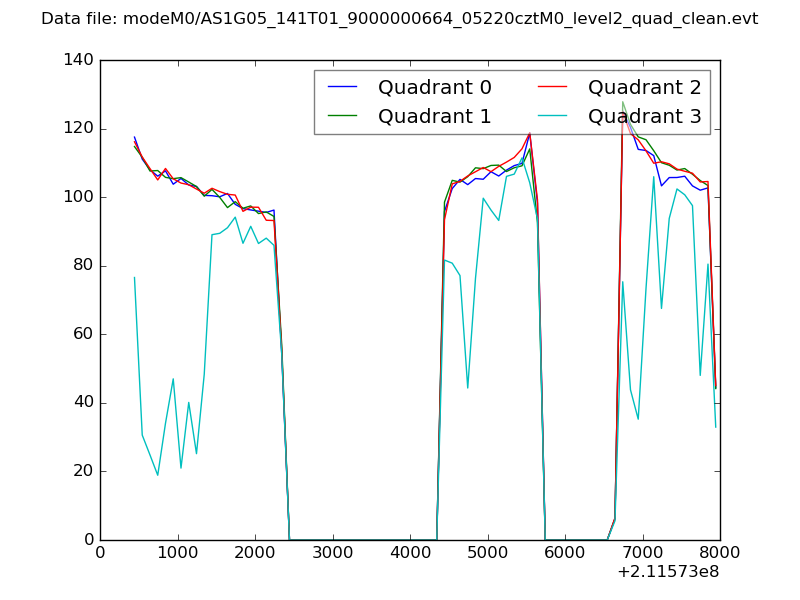 |
|
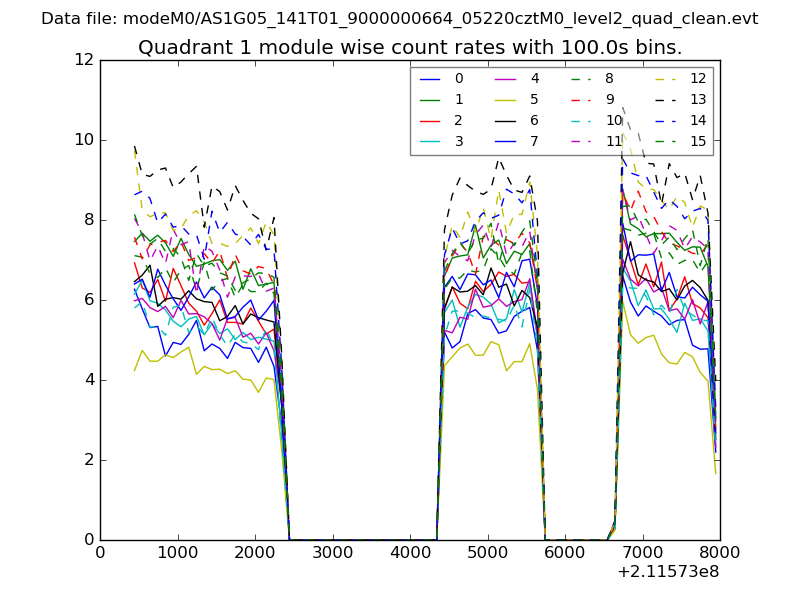
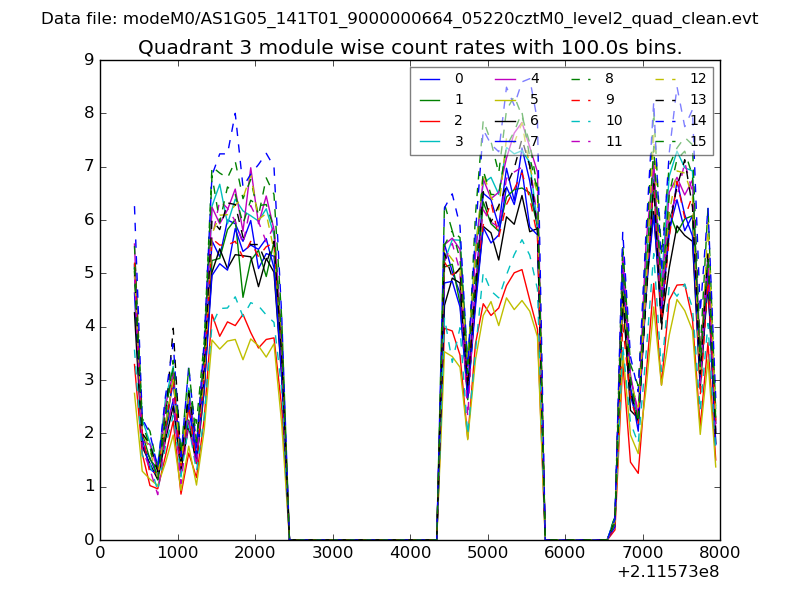
| Module-wise count rates for Quadrant A Data is divided into 100 sec bins |
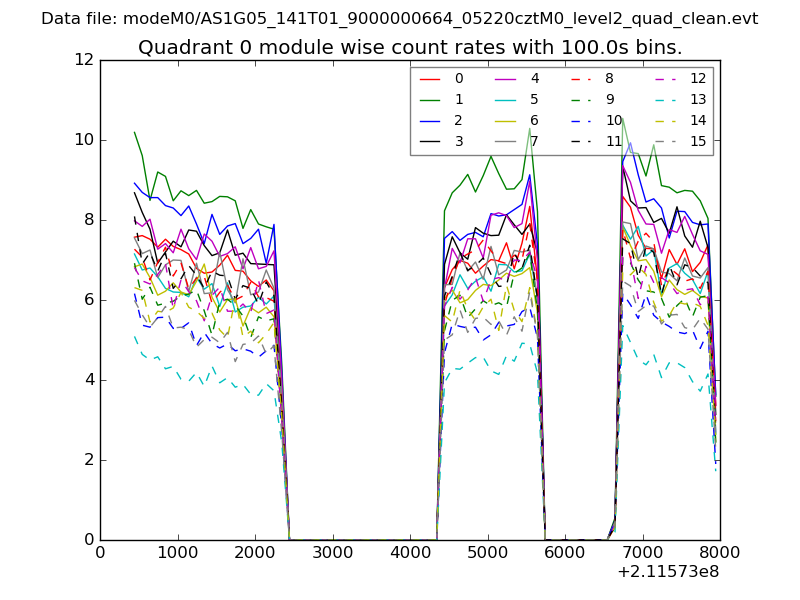 |
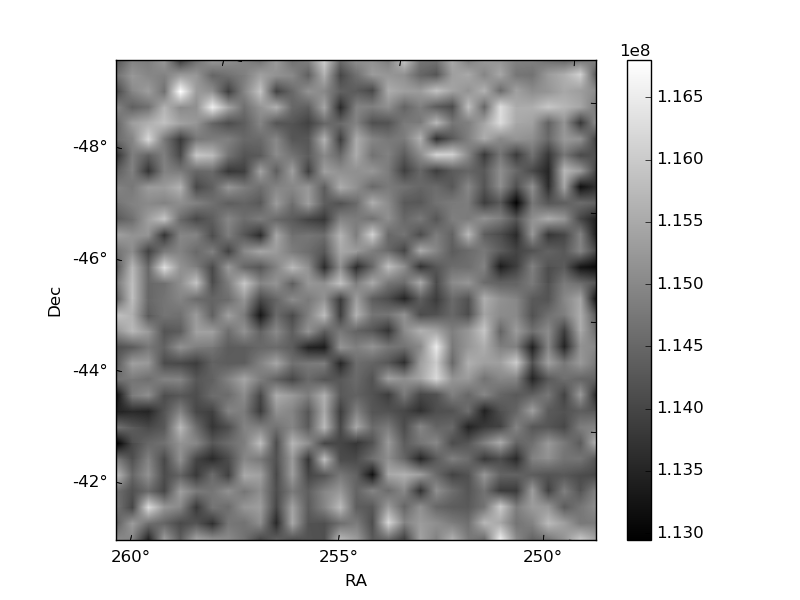 |
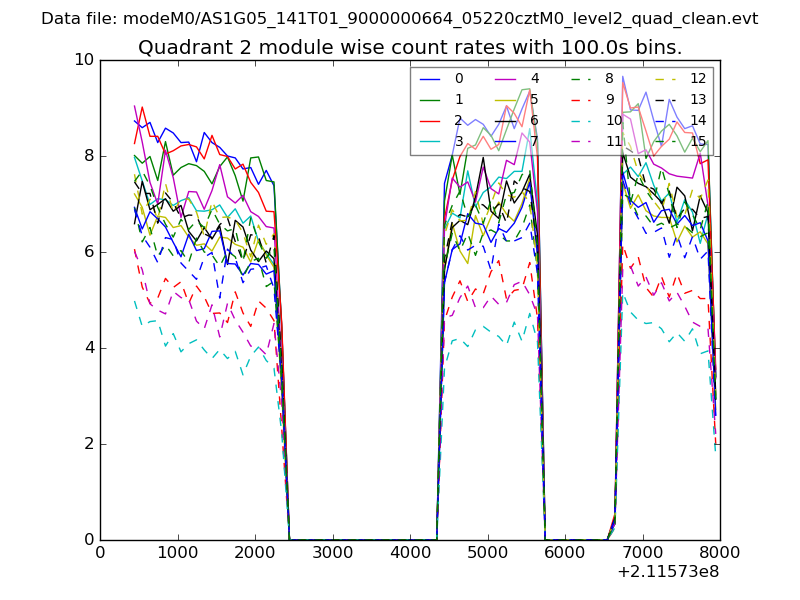
| Module-wise count rates for Quadrant B Data is divided into 100 sec bins |
 |
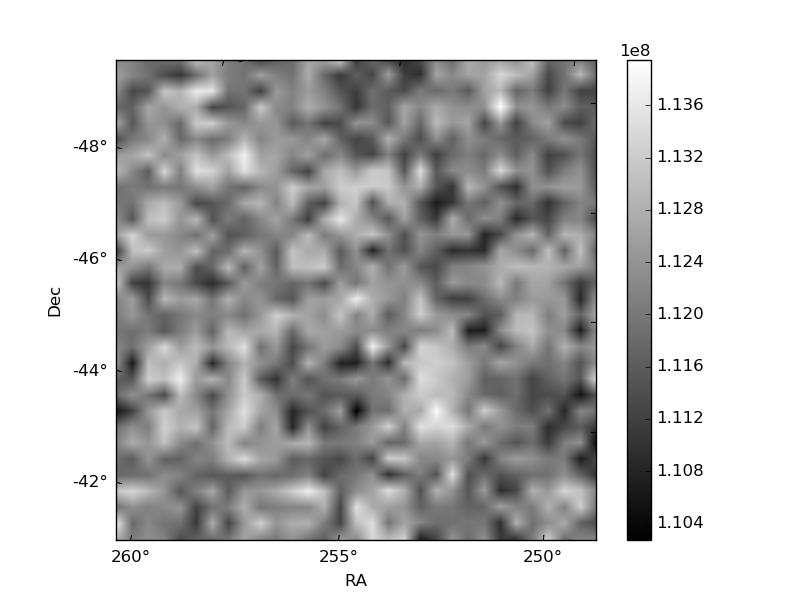 |
| Module-wise count rates for Quadrant C Data is divided into 100 sec bins |
 |
 |
| Module-wise count rates for Quadrant D Data is divided into 100 sec bins |
 |
 |
| Parameter | Plot |
|---|---|
| CZT HV Monitor | 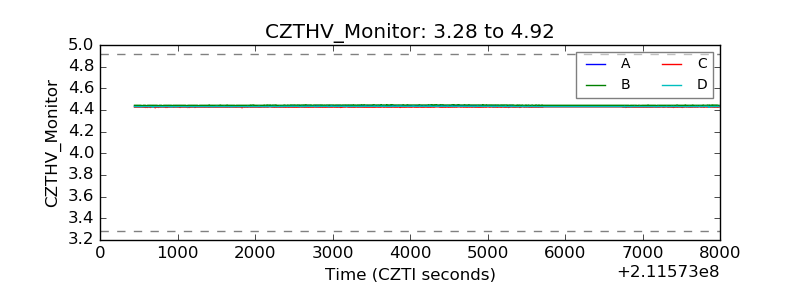 |
| D_VDD | 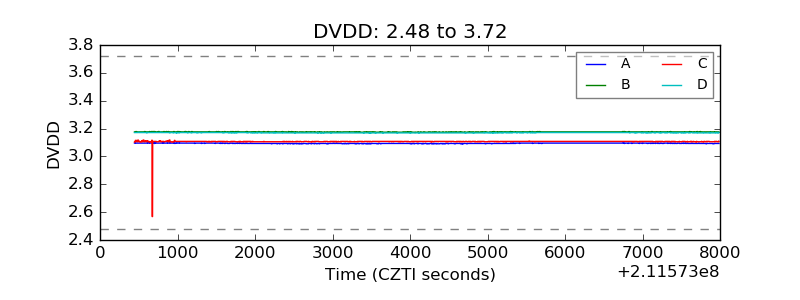 |
| Temperature 1 | 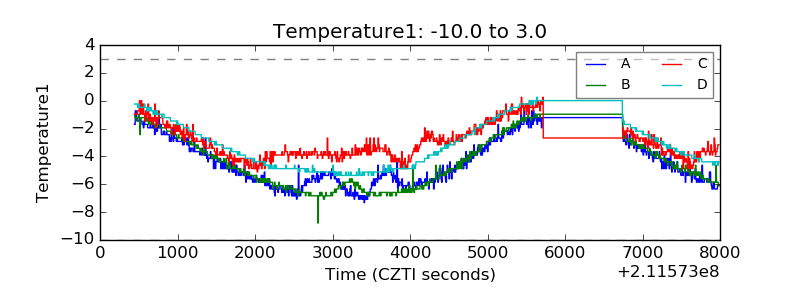 |
| Veto HV Monitor | 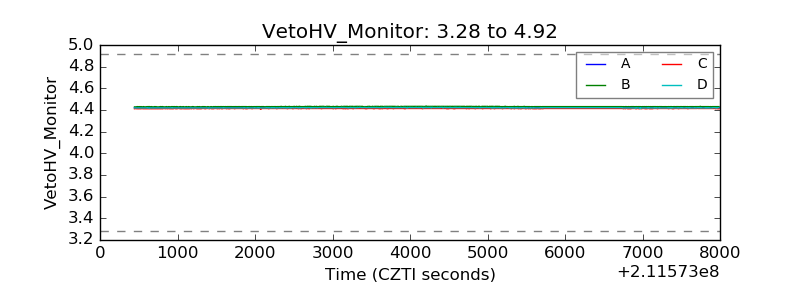 |
| Veto LLD | 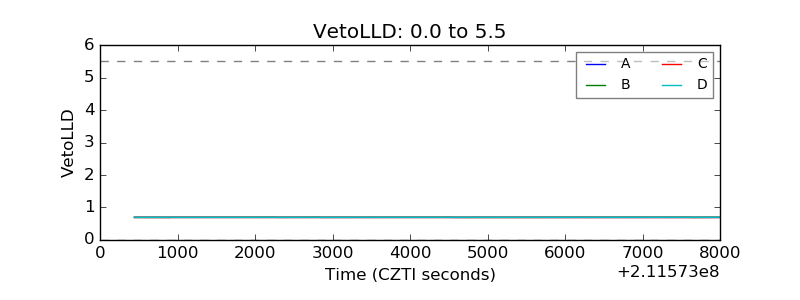 |
| Alpha Counter | 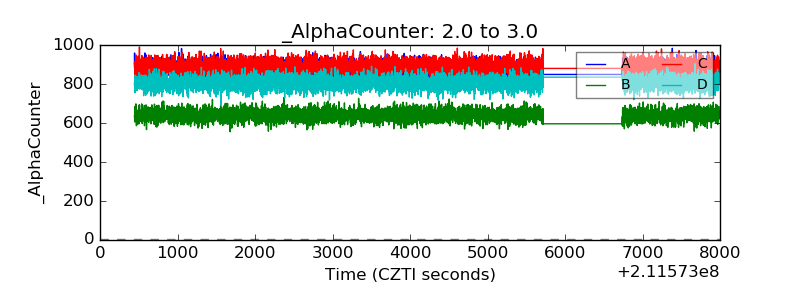 |
| _CPM_Rate | 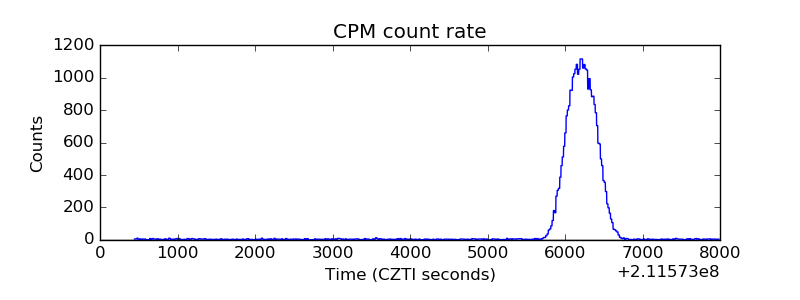 |
| CZT Counter | 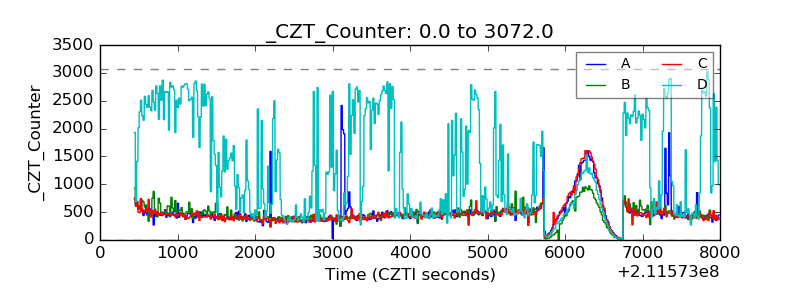 |
| +2.5 Volts monitor |  |
| +5 Volts monitor |  |
| _ROLL_ROT | 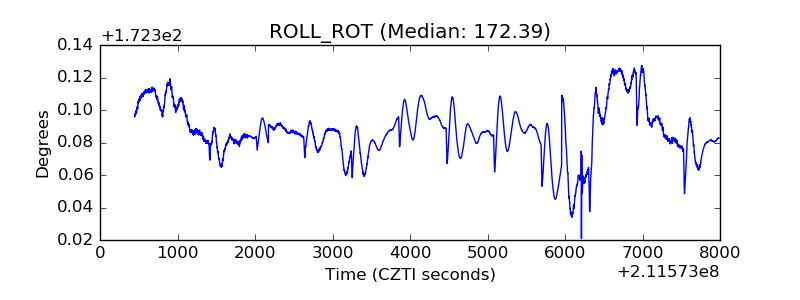 |
| _Roll_DEC | 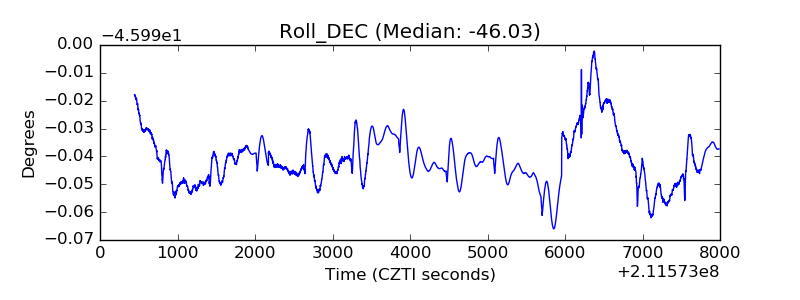 |
| _Roll_RA | 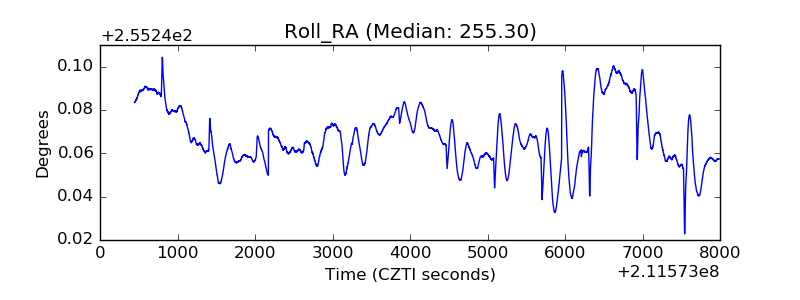 |
| Veto Counter | 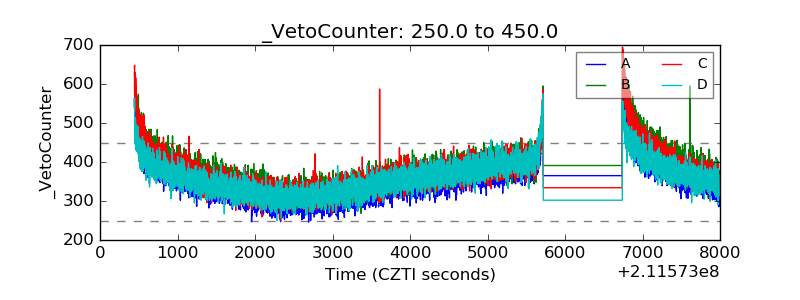 |