| Param | Original file | Final file |
|---|---|---|
| Filename | modeM0/AS1G05_141T01_9000000664_05222cztM0_level2.evt | modeM0/AS1G05_141T01_9000000664_05222cztM0_level2_quad_clean.evt |
| Size (bytes) | 576,486,720 | 73,848,960 |
| Size | 549.8 MB | 70.4 MB |
| Events in quadrant A | 3,123,202 | 463,024 |
| Events in quadrant B | 3,238,336 | 473,017 |
| Events in quadrant C | 2,908,497 | 471,562 |
| Events in quadrant D | 7,749,594 | 376,417 |
| Mode M9 | |||
|---|---|---|---|
| Quadrant | BADHDUFLAG | Total packets | Discarded packets |
| A | 0 | 12 | 0 |
| B | 0 | 12 | 0 |
| C | 0 | 12 | 0 |
| D | 0 | 13 | 0 |
| Mode M0 | |||
|---|---|---|---|
| Quadrant | BADHDUFLAG | Total packets | Discarded packets |
| A | 0 | 13814 | 3 |
| B | 0 | 13988 | 2 |
| C | 0 | 13141 | 2 |
| D | 0 | 27559 | 2 |
| Mode SS | |||
|---|---|---|---|
| Quadrant | BADHDUFLAG | Total packets | Discarded packets |
| A | 0 | 132 | 0 |
| B | 0 | 132 | 0 |
| C | 0 | 132 | 0 |
| D | 0 | 132 | 0 |
| Quadrant | Total seconds | Saturated seconds | Saturation percentage |
|---|---|---|---|
| A | 6471 | 60 | 0.927214% |
| B | 6471 | 34 | 0.525421% |
| C | 6471 | 20 | 0.309071% |
| D | 6471 | 1903 | 29.408129% |
Noise dominated data is calculated using 1-second bins in cleaned event files. If a bin has >2000 counts, and if more than 50% of those come from <1% of pixels, then it is considered to be noise-dominated and hence unusable.
| Quadrant | # 1 sec bins | Bins with >0 counts | Bins with >2000 counts | High rate bins dominated by noise | Noise dominated (total time) | Noise dominated (detector-on time) | Marked lightcurve |
|---|---|---|---|---|---|---|---|
| A | 7571 | 6472 | 39 | 39 | 0.52% | 0.60% | 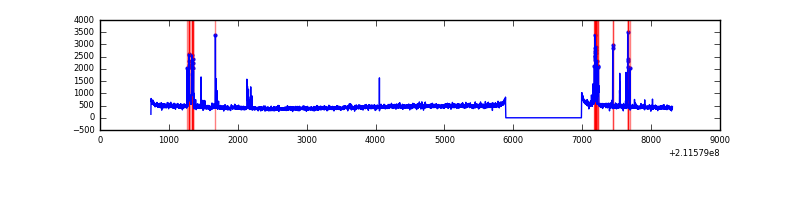 |
| B | 7571 | 6472 | 7 | 7 | 0.09% | 0.11% | 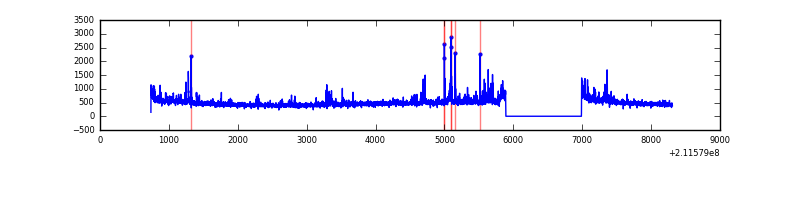 |
| C | 7571 | 6472 | 0 | 0 | 0.00% | 0.00% | 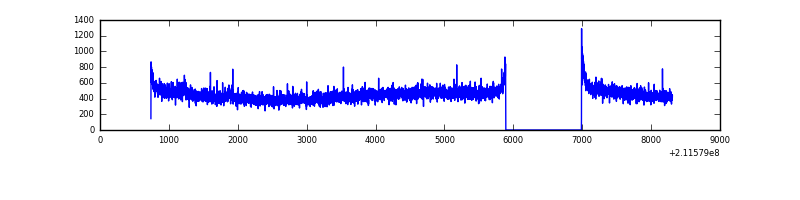 |
| D | 7571 | 6471 | 1647 | 1647 | 21.75% | 25.45% | 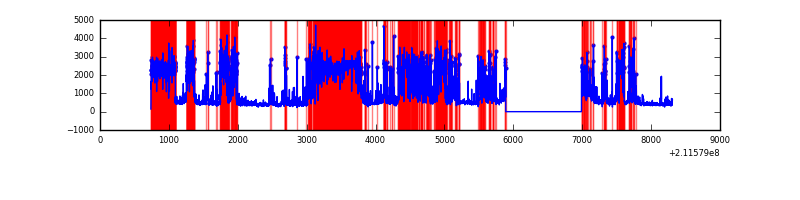 |
Top three noisy pixels from each quadrant. If the there are fewer than three noisy pixels in the level2.evt file, extra rows are filled as -1
| Pixel properties | Quadrant properties | ||||||
|---|---|---|---|---|---|---|---|
| Quadrant | DetID | PixID | Counts | Sigma | Mean | Median | Sigma |
| A | 0 | 50 | 239236 | 1541.8 | 750 | 734 | 154.7 |
| A | 0 | 226 | 7409 | 43.15 | 750 | 734 | 154.7 |
| A | 12 | 194 | 7344 | 42.73 | 750 | 734 | 154.7 |
| B | 4 | 80 | 126566 | 868.7 | 764 | 747 | 144.8 |
| B | 4 | 48 | 40095 | 271.67 | 764 | 747 | 144.8 |
| B | 15 | 204 | 32583 | 219.81 | 764 | 747 | 144.8 |
| C | 1 | 16 | 41141 | 239.58 | 731 | 735 | 168.7 |
| C | 13 | 61 | 5880 | 30.51 | 731 | 735 | 168.7 |
| C | 8 | 128 | 5519 | 28.37 | 731 | 735 | 168.7 |
| D | 11 | 145 | 4390441 | 29376.58 | 608 | 589 | 149.4 |
| D | 2 | 33 | 822588 | 5500.76 | 608 | 589 | 149.4 |
| D | 12 | 233 | 67560 | 448.17 | 608 | 589 | 149.4 |
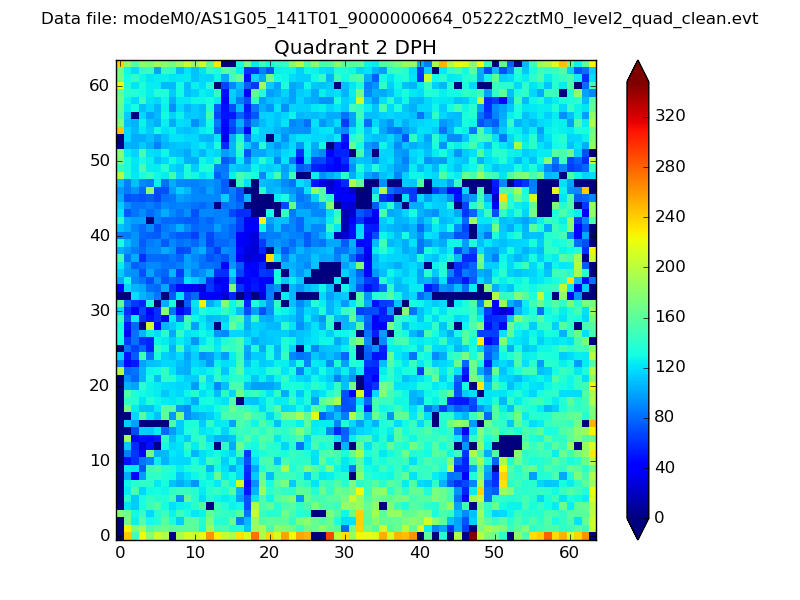
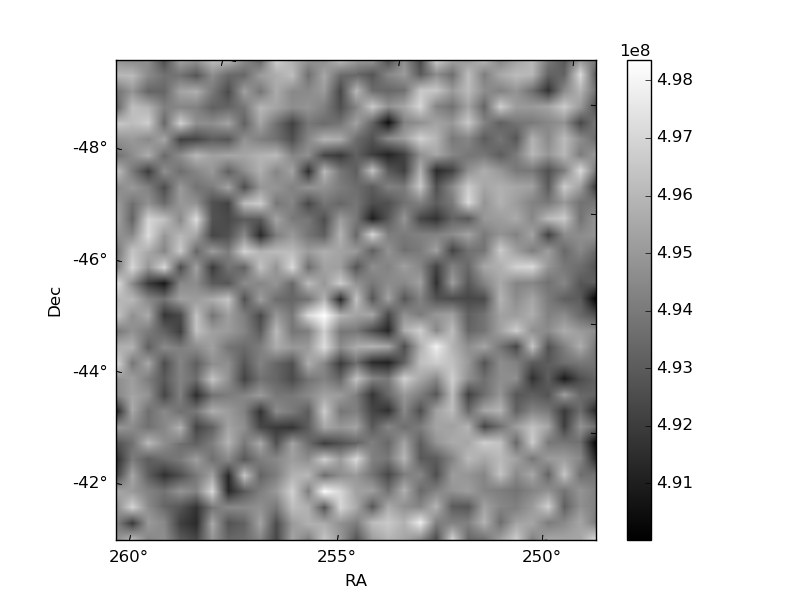
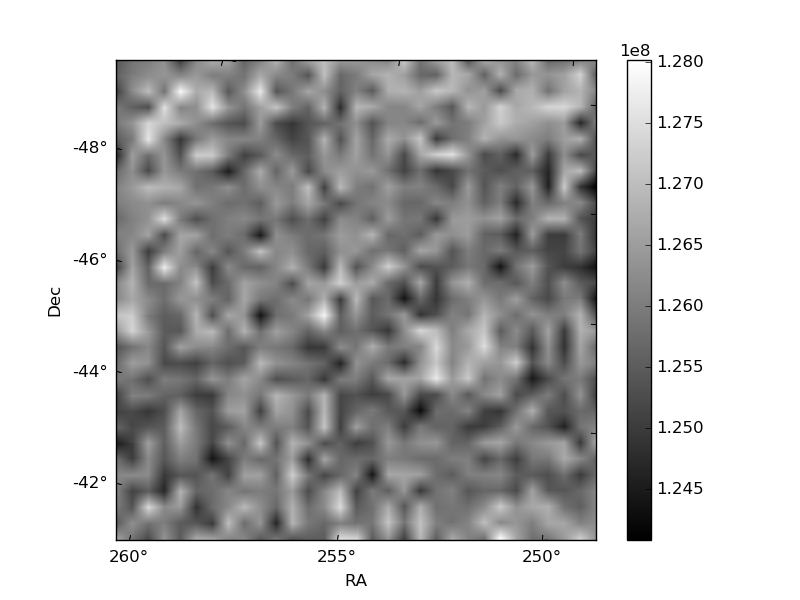
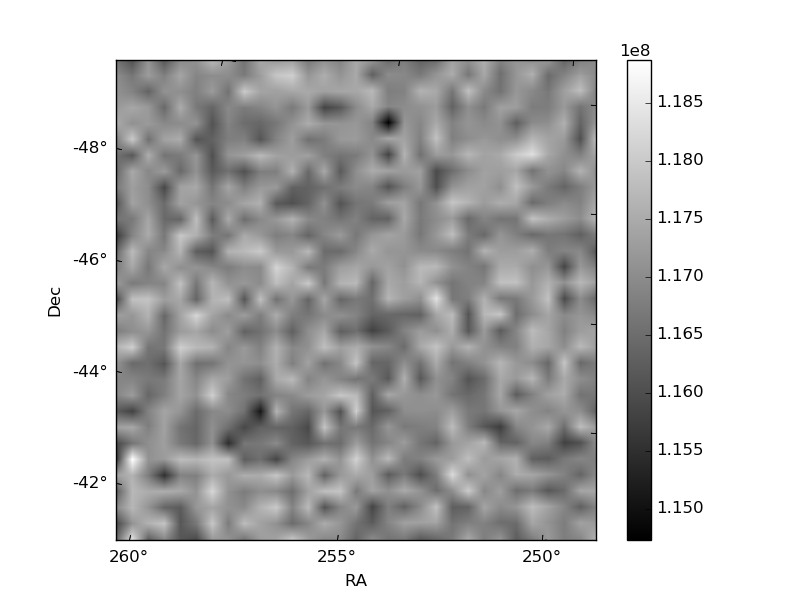
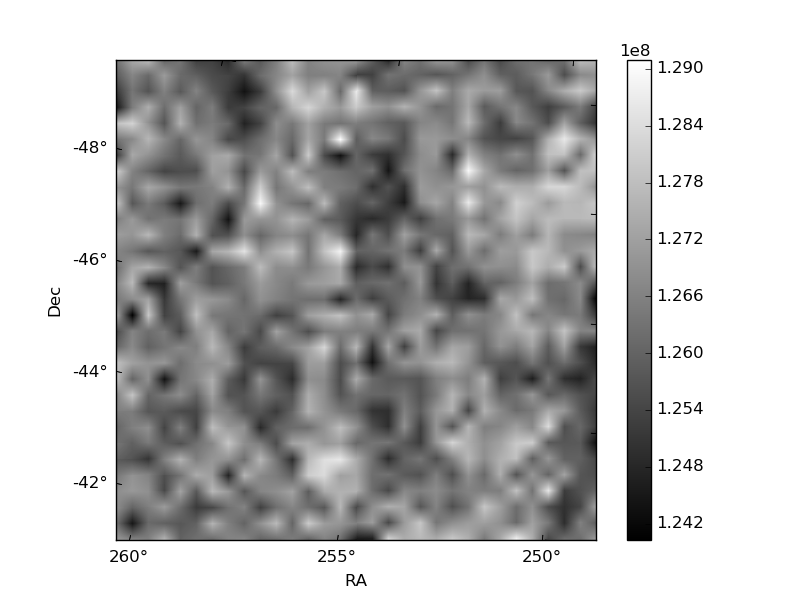
Histogram calculated using DETX and DETY for each event in the final _common_clean file
| Quadrant A | 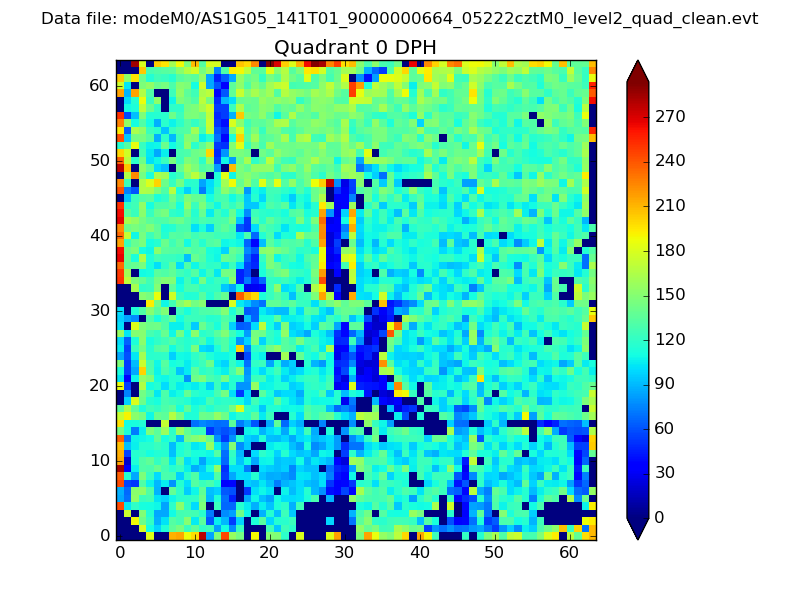 |
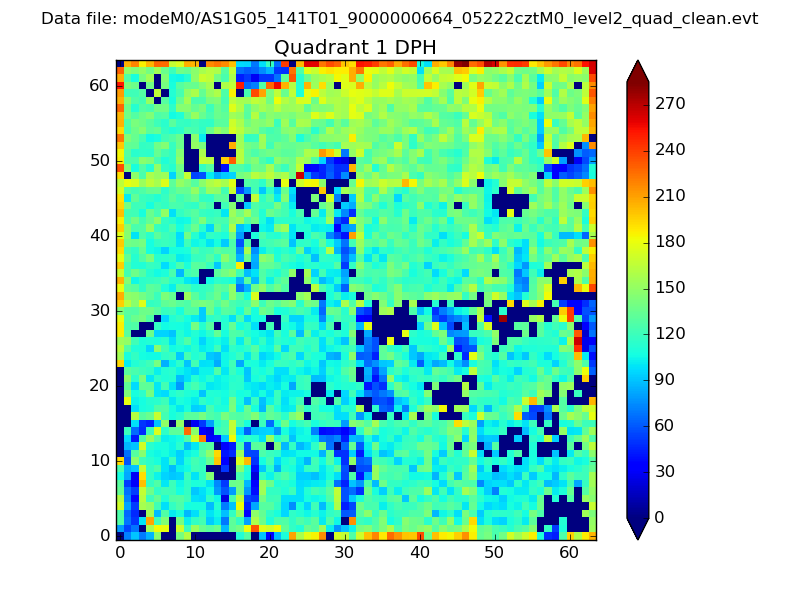 |
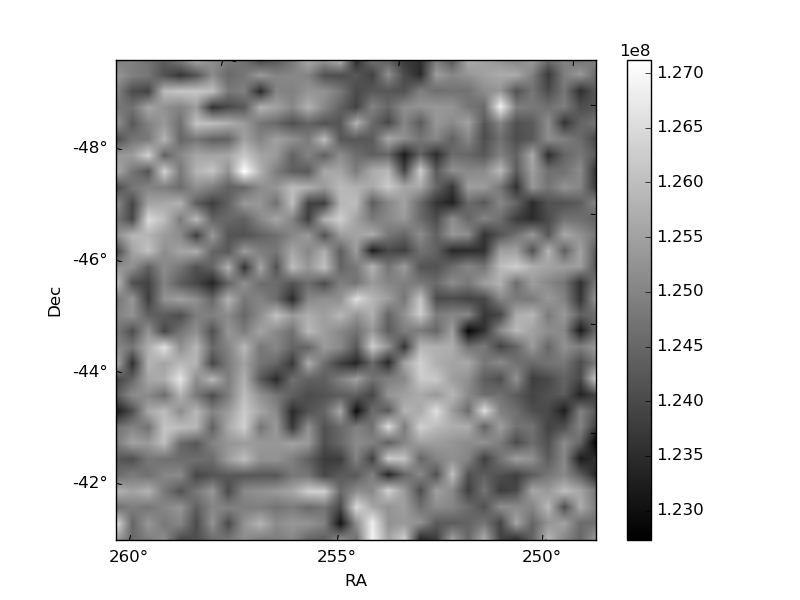
Quadrant B |
|---|---|---|---|
| Quadrant D | 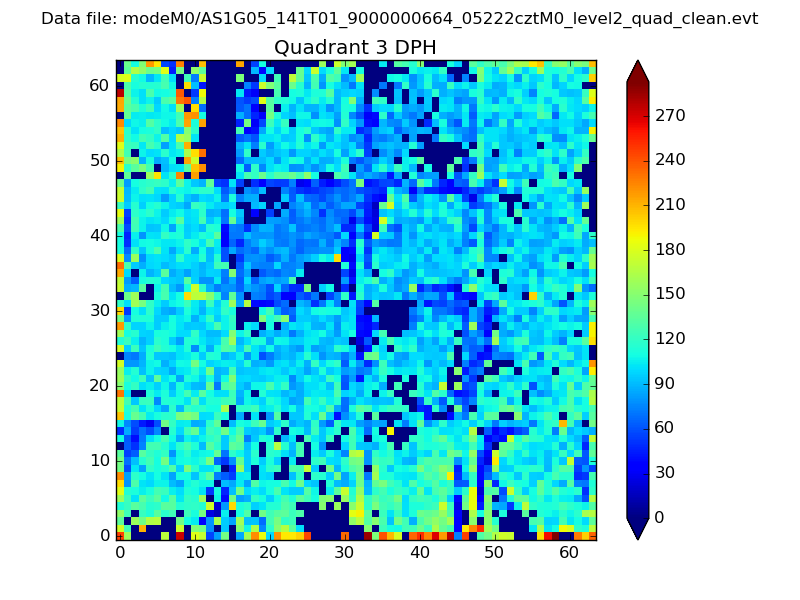 |
 |
Quadrant C |
| Plot type | Count rate plots | Images |
|---|---|---|
| Comparison with Poisson distribution Blue bars denote a histogram of data divided into 1 sec bins. Red curve is a Poisson curve with rate = median count rate of data. |
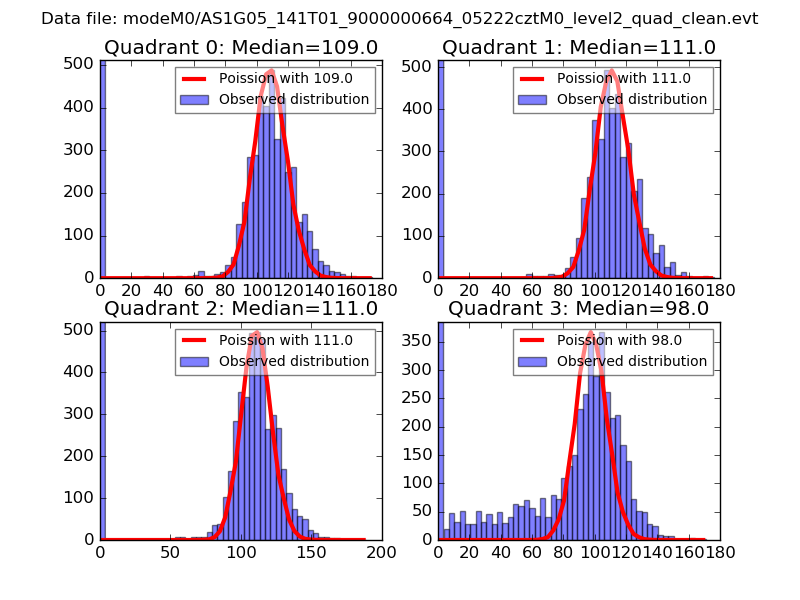 |
 |
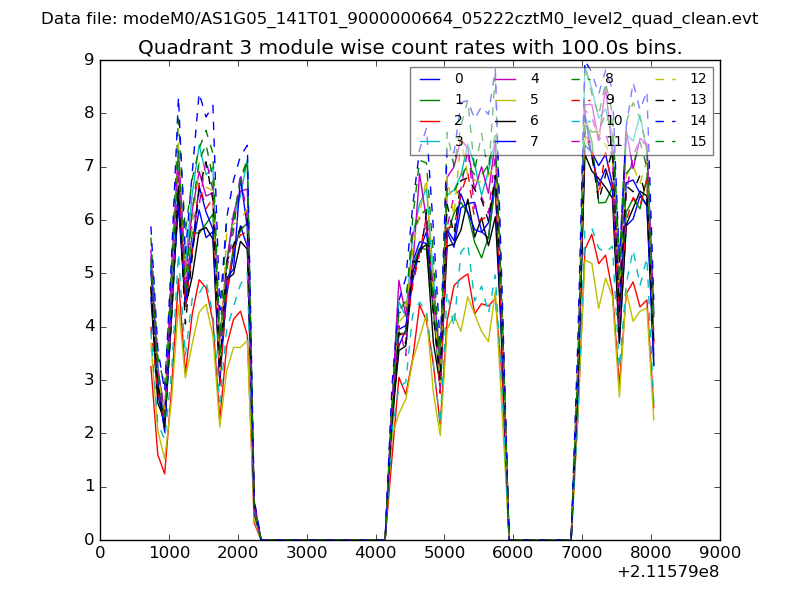
| Quadrant-wise count rates Data is divided into 100 sec bins |
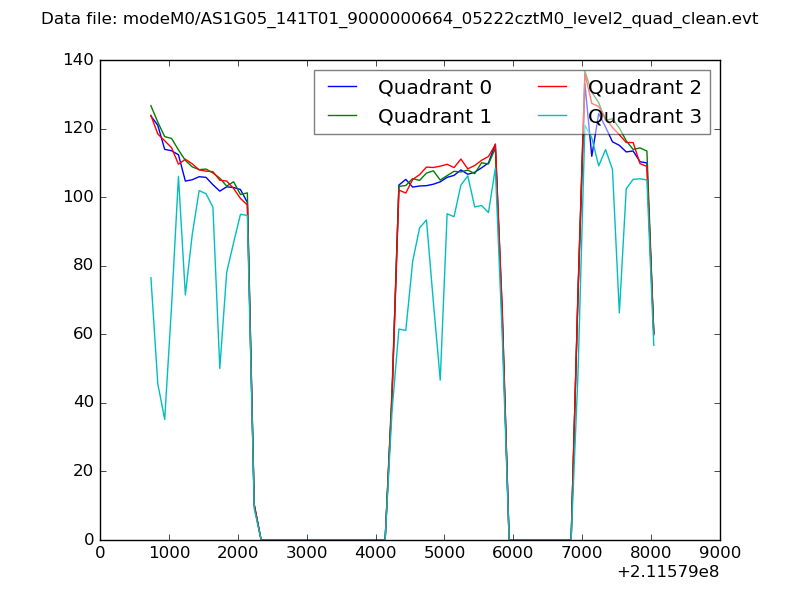 |
|
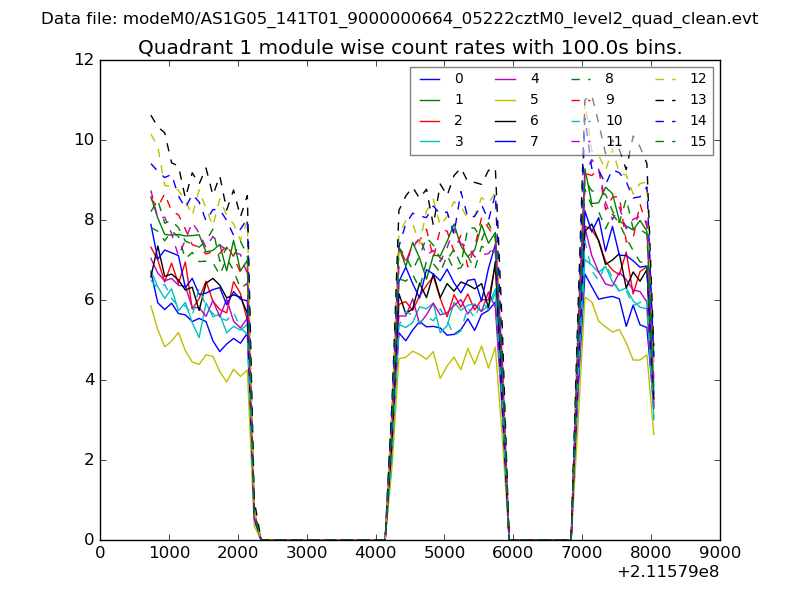
| Module-wise count rates for Quadrant A Data is divided into 100 sec bins |
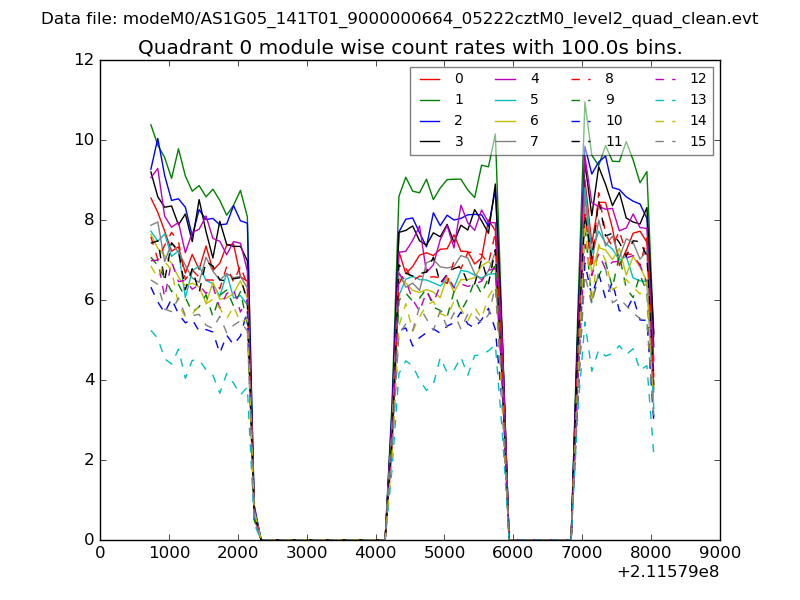 |
 |
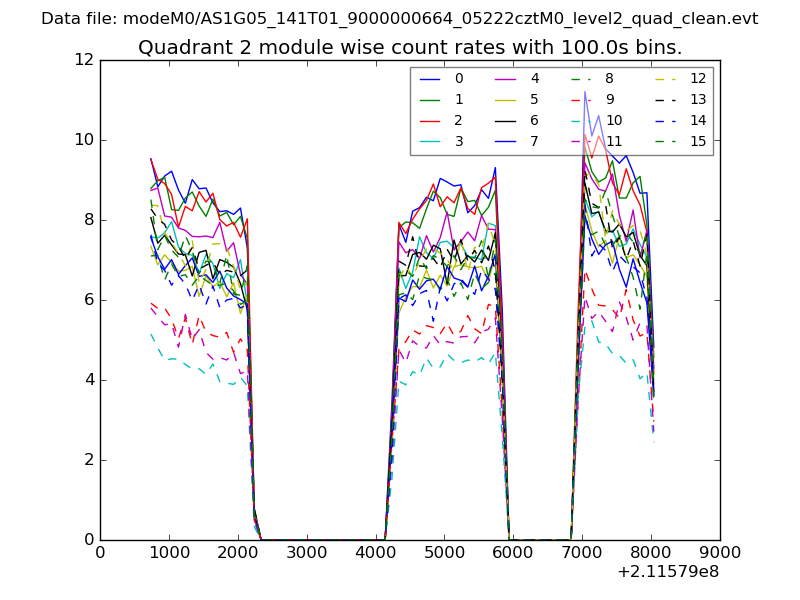
| Module-wise count rates for Quadrant B Data is divided into 100 sec bins |
 |
 |
| Module-wise count rates for Quadrant C Data is divided into 100 sec bins |
 |
 |
| Module-wise count rates for Quadrant D Data is divided into 100 sec bins |
 |
 |
| Parameter | Plot |
|---|---|
| CZT HV Monitor | 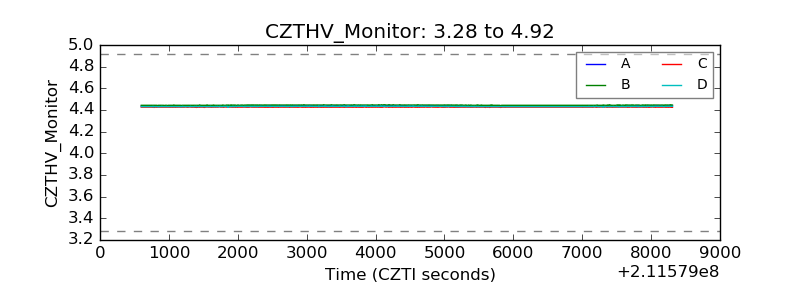 |
| D_VDD | 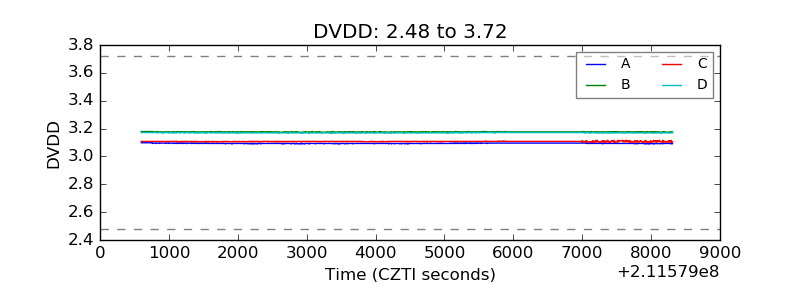 |
| Temperature 1 | 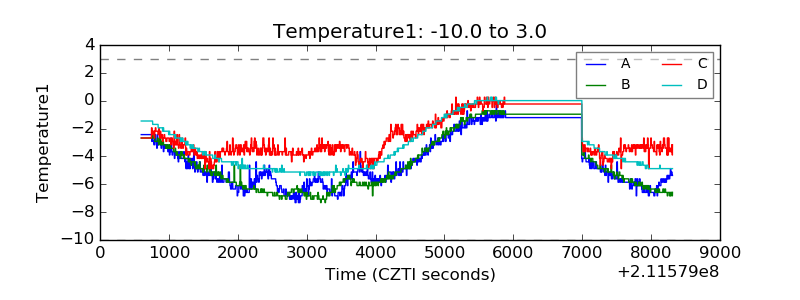 |
| Veto HV Monitor | 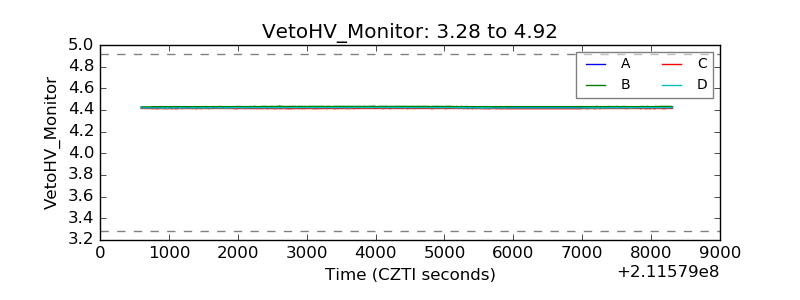 |
| Veto LLD | 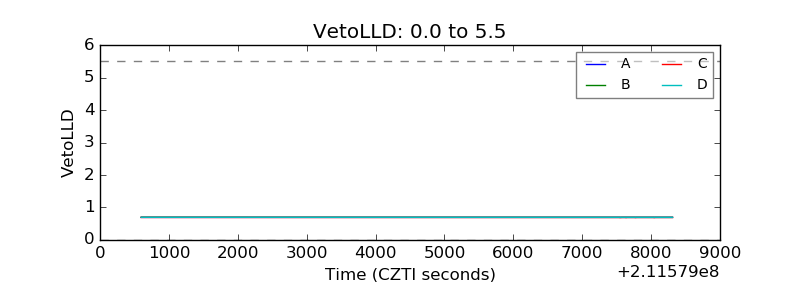 |
| Alpha Counter | 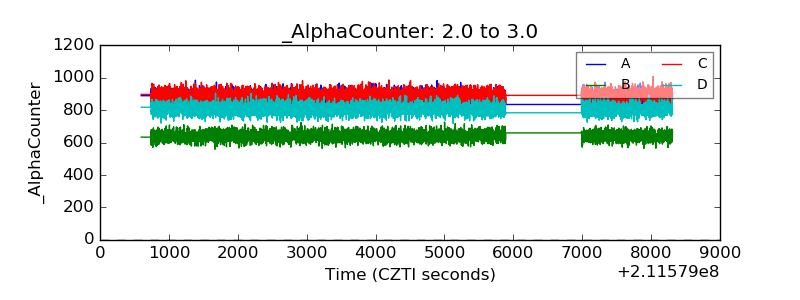 |
| _CPM_Rate | 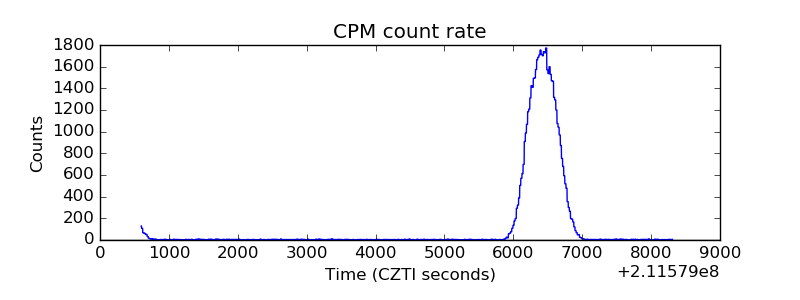 |
| CZT Counter | 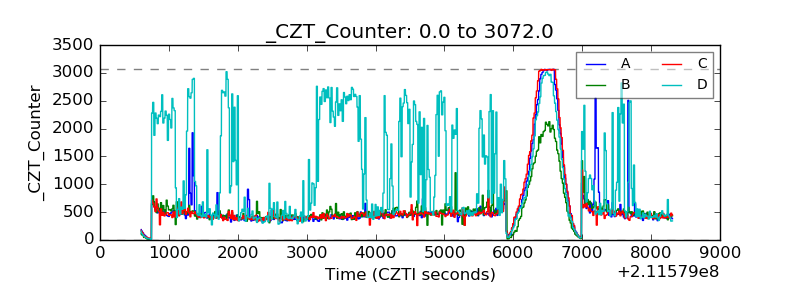 |
| +2.5 Volts monitor |  |
| +5 Volts monitor |  |
| _ROLL_ROT | 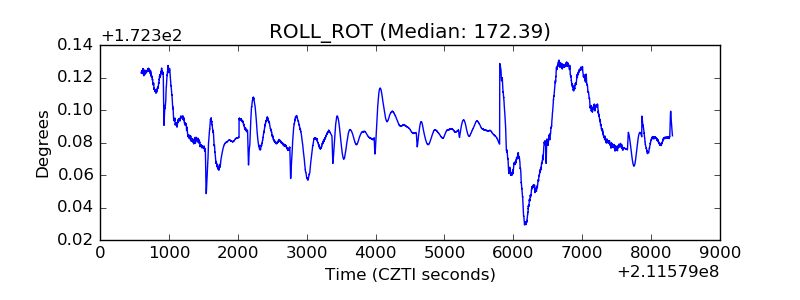 |
| _Roll_DEC | 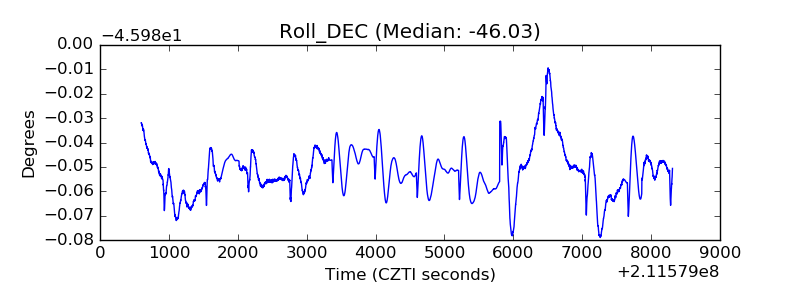 |
| _Roll_RA | 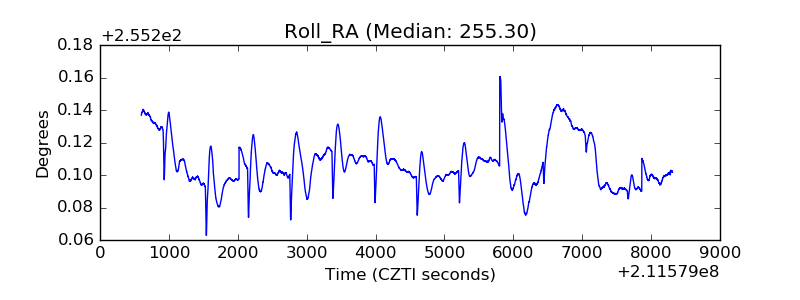 |
| Veto Counter | 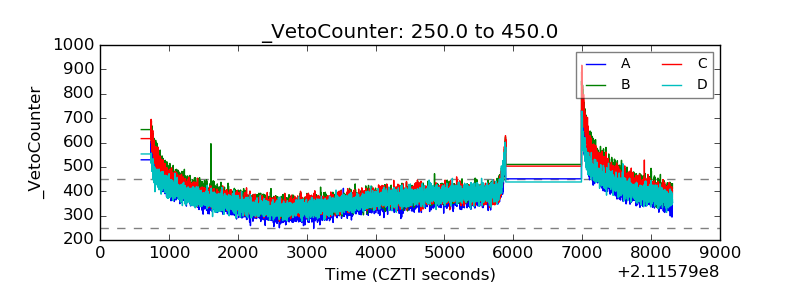 |