| Param | Original file | Final file |
|---|---|---|
| Filename | modeM0/AS1T01_136T01_9000000662cztM0_level2.fits | modeM0/AS1T01_136T01_9000000662cztM0_level2_quad_clean.evt |
| Size (bytes) | 297,501,120 | 252,527,040 |
| Size | 283.7 MB | 240.8 MB |
| Events in quadrant A | 1,787,952 | 1,420,468 |
| Events in quadrant B | 1,743,326 | 1,439,542 |
| Events in quadrant C | 1,791,080 | 1,378,995 |
| Events in quadrant D | 1,490,806 | 1,212,140 |
| Mode M9 | |||
|---|---|---|---|
| Quadrant | BADHDUFLAG | Total packets | Discarded packets |
| A | 0 | 59 | 0 |
| B | 0 | 59 | 0 |
| C | 0 | 59 | 0 |
| D | 0 | 59 | 0 |
| Mode SS | |||
|---|---|---|---|
| Quadrant | BADHDUFLAG | Total packets | Discarded packets |
| A | 0 | 646 | 0 |
| B | 0 | 650 | 0 |
| C | 0 | 652 | 0 |
| D | 0 | 648 | 0 |
| Mode M0 | |||
|---|---|---|---|
| Quadrant | BADHDUFLAG | Total packets | Discarded packets |
| A | 0 | 65871 | 0 |
| B | 0 | 66567 | 0 |
| C | 0 | 67113 | 0 |
| D | 0 | 81886 | 0 |
| Quadrant | Total seconds | Saturated seconds | Saturation percentage |
|---|---|---|---|
| A | 31954 | 584 | 1.827627% |
| B | 31958 | 586 | 1.833657% |
| C | 31966 | 464 | 1.451542% |
| D | 31941 | 2777 | 8.694155% |
Noise dominated data is calculated using 1-second bins in cleaned event files. If a bin has >2000 counts, and if more than 50% of those come from <1% of pixels, then it is considered to be noise-dominated and hence unusable.
| Quadrant | # 1 sec bins | Bins with >0 counts | Bins with >2000 counts | High rate bins dominated by noise | Noise dominated (total time) | Noise dominated (detector-on time) | Marked lightcurve |
|---|---|---|---|---|---|---|---|
| A | 37884 | 32057 | 0 | 0 | 0.00% | 0.00% |  |
| B | 37884 | 32052 | 0 | 0 | 0.00% | 0.00% |  |
| C | 37884 | 32055 | 0 | 0 | 0.00% | 0.00% |  |
| D | 37884 | 32037 | 0 | 0 | 0.00% | 0.00% |  |
Top three noisy pixels from each quadrant. If the there are fewer than three noisy pixels in the level2.evt file, extra rows are filled as -1
| Pixel properties | Quadrant properties | ||||||
|---|---|---|---|---|---|---|---|
| Quadrant | DetID | PixID | Counts | Sigma | Mean | Median | Sigma |
| A | 0 | 29 | 1745 | 10.79 | 464 | 431 | 121.7 |
| A | 7 | 110 | 1567 | 9.33 | 464 | 431 | 121.7 |
| A | 0 | 30 | 1401 | 7.97 | 464 | 431 | 121.7 |
| B | 2 | 9 | 1511 | 11.34 | 459 | 436 | 94.8 |
| B | 5 | 128 | 1196 | 8.02 | 459 | 436 | 94.8 |
| B | 3 | 17 | 1194 | 7.99 | 459 | 436 | 94.8 |
| C | 1 | 81 | 1291 | 6.84 | 472 | 438 | 124.7 |
| C | 1 | 80 | 1277 | 6.73 | 472 | 438 | 124.7 |
| C | 9 | 188 | 1261 | 6.6 | 472 | 438 | 124.7 |
| D | 11 | 82 | 1120 | 6.58 | 423 | 385 | 111.7 |
| D | 6 | 231 | 1113 | 6.52 | 423 | 385 | 111.7 |
| D | 7 | 5 | 1090 | 6.31 | 423 | 385 | 111.7 |
Histogram calculated using DETX and DETY for each event in the final _common_clean file
| Quadrant A | 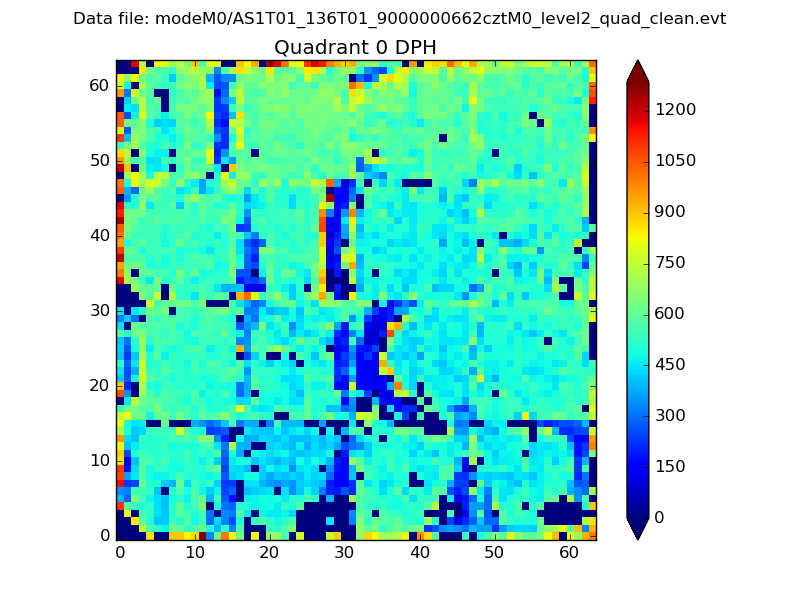 |
 |
Quadrant B |
|---|---|---|---|
| Quadrant D |  |
 |
Quadrant C |
| Plot type | Count rate plots | Images |
|---|---|---|
| Comparison with Poisson distribution Blue bars denote a histogram of data divided into 1 sec bins. Red curve is a Poisson curve with rate = median count rate of data. |
 |
 |
| Quadrant-wise count rates Data is divided into 100 sec bins |
 |
|
| Module-wise count rates for Quadrant A Data is divided into 100 sec bins |
 |
 |
| Module-wise count rates for Quadrant B Data is divided into 100 sec bins |
 |
 |
| Module-wise count rates for Quadrant C Data is divided into 100 sec bins |
 |
 |
| Module-wise count rates for Quadrant D Data is divided into 100 sec bins |
 |
 |
| Parameter | Plot |
|---|---|
| CZT HV Monitor |  |
| D_VDD |  |
| Temperature 1 |  |
| Veto HV Monitor |  |
| Veto LLD | 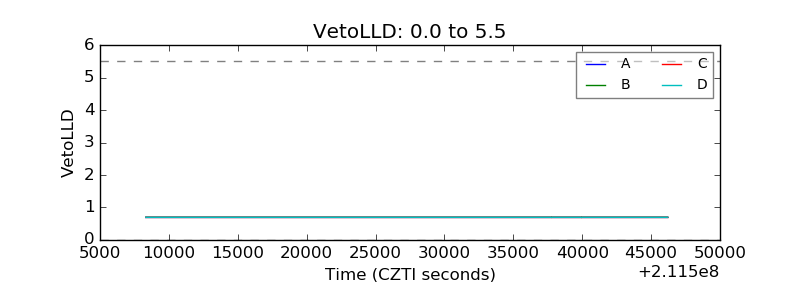 |
| Alpha Counter |  |
| _CPM_Rate |  |
| CZT Counter |  |
| +2.5 Volts monitor | 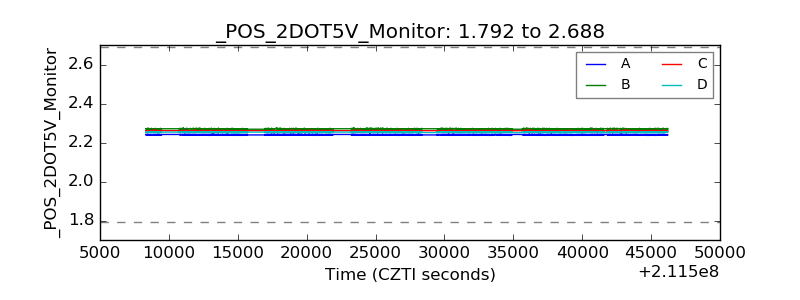 |
| +5 Volts monitor | 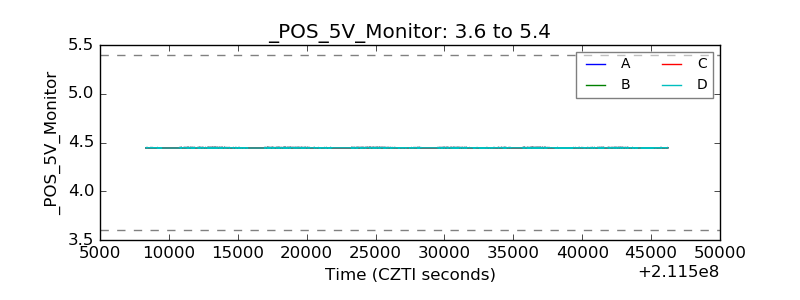 |
| _ROLL_ROT |  |
| _Roll_DEC |  |
| _Roll_RA |  |
| Veto Counter |  |