| Param | Original file | Final file |
|---|---|---|
| Filename | modeM0/AS1T01_136T01_9000000662_05209cztM0_level2.evt | modeM0/AS1T01_136T01_9000000662_05209cztM0_level2_quad_clean.evt |
| Size (bytes) | 190,699,200 | 32,503,680 |
| Size | 181.9 MB | 31.0 MB |
| Events in quadrant A | 1,343,893 | 196,215 |
| Events in quadrant B | 1,386,469 | 201,447 |
| Events in quadrant C | 1,510,055 | 199,161 |
| Events in quadrant D | 1,343,483 | 187,795 |
| Mode M9 | |||
|---|---|---|---|
| Quadrant | BADHDUFLAG | Total packets | Discarded packets |
| A | 0 | 13 | 0 |
| B | 0 | 13 | 0 |
| C | 0 | 13 | 0 |
| D | 0 | 13 | 0 |
| Mode SS | |||
|---|---|---|---|
| Quadrant | BADHDUFLAG | Total packets | Discarded packets |
| A | 0 | 56 | 0 |
| B | 0 | 56 | 0 |
| C | 0 | 56 | 0 |
| D | 0 | 56 | 0 |
| Mode M0 | |||
|---|---|---|---|
| Quadrant | BADHDUFLAG | Total packets | Discarded packets |
| A | 0 | 5753 | 2 |
| B | 0 | 5797 | 1 |
| C | 0 | 6144 | 1 |
| D | 0 | 5842 | 1 |
| Quadrant | Total seconds | Saturated seconds | Saturation percentage |
|---|---|---|---|
| A | 2789 | 15 | 0.537827% |
| B | 2789 | 17 | 0.609537% |
| C | 2789 | 18 | 0.645393% |
| D | 2789 | 11 | 0.394407% |
Noise dominated data is calculated using 1-second bins in cleaned event files. If a bin has >2000 counts, and if more than 50% of those come from <1% of pixels, then it is considered to be noise-dominated and hence unusable.
| Quadrant | # 1 sec bins | Bins with >0 counts | Bins with >2000 counts | High rate bins dominated by noise | Noise dominated (total time) | Noise dominated (detector-on time) | Marked lightcurve |
|---|---|---|---|---|---|---|---|
| A | 4049 | 2790 | 0 | 0 | 0.00% | 0.00% | 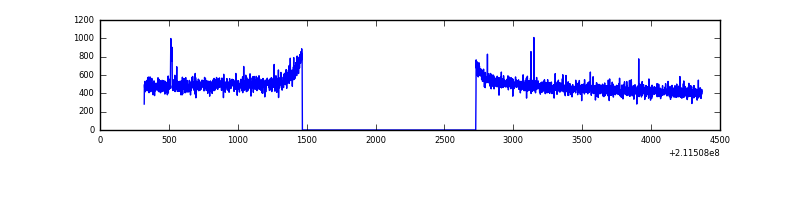 |
| B | 4049 | 2790 | 0 | 0 | 0.00% | 0.00% | 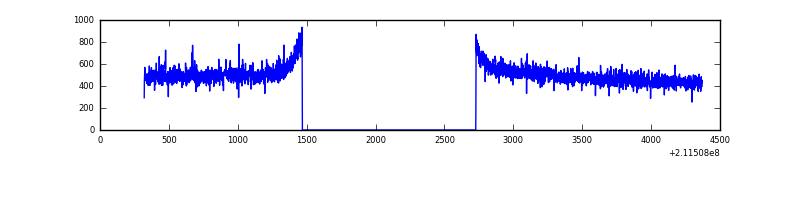 |
| C | 4049 | 2790 | 0 | 0 | 0.00% | 0.00% | 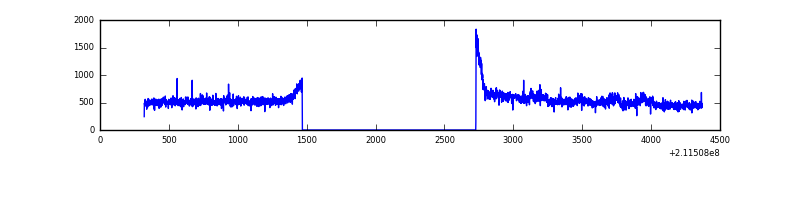 |
| D | 4049 | 2790 | 6 | 6 | 0.15% | 0.22% | 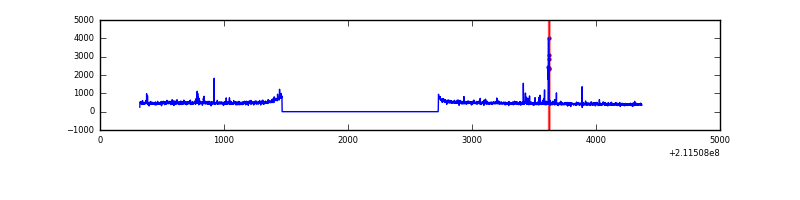 |
Top three noisy pixels from each quadrant. If the there are fewer than three noisy pixels in the level2.evt file, extra rows are filled as -1
| Pixel properties | Quadrant properties | ||||||
|---|---|---|---|---|---|---|---|
| Quadrant | DetID | PixID | Counts | Sigma | Mean | Median | Sigma |
| A | 0 | 50 | 4853 | 62.74 | 347 | 339 | 71.9 |
| A | 12 | 194 | 3349 | 41.84 | 347 | 339 | 71.9 |
| A | 0 | 226 | 3282 | 40.91 | 347 | 339 | 71.9 |
| B | 12 | 111 | 6099 | 83.98 | 355 | 347 | 68.5 |
| B | 4 | 48 | 6024 | 82.89 | 355 | 347 | 68.5 |
| B | 0 | 229 | 5312 | 72.49 | 355 | 347 | 68.5 |
| C | 1 | 16 | 163350 | 2023.89 | 344 | 346 | 80.5 |
| C | 13 | 61 | 2878 | 31.44 | 344 | 346 | 80.5 |
| C | 14 | 67 | 2107 | 21.86 | 344 | 346 | 80.5 |
| D | 2 | 206 | 33029 | 391.83 | 338 | 328 | 83.5 |
| D | 2 | 136 | 17517 | 205.96 | 338 | 328 | 83.5 |
| D | 8 | 195 | 7014 | 80.11 | 338 | 328 | 83.5 |
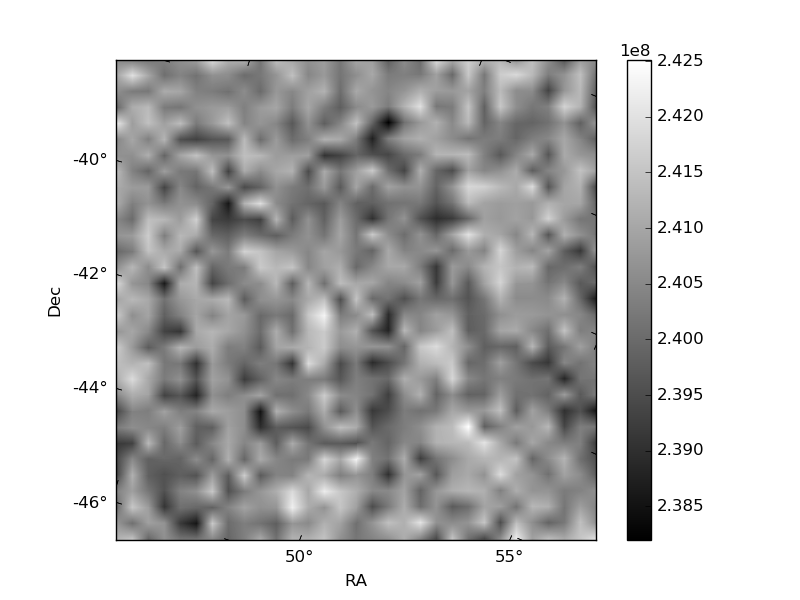
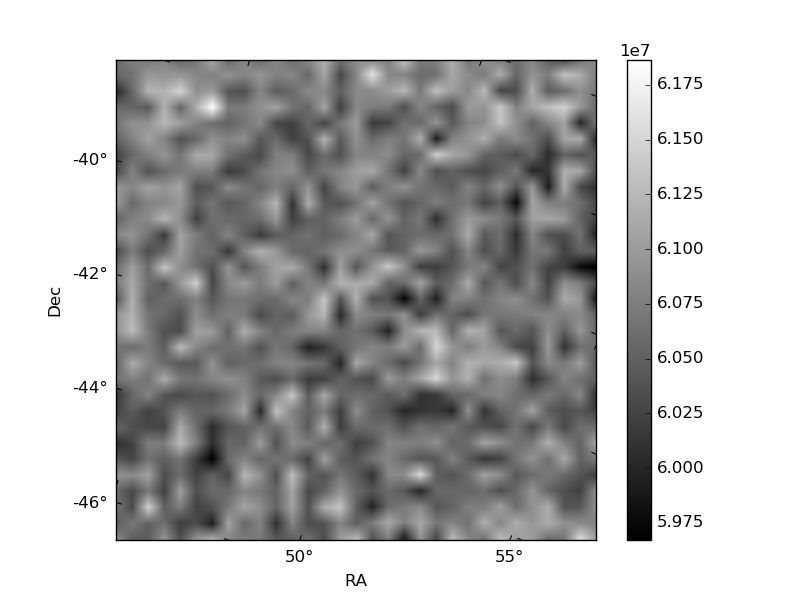
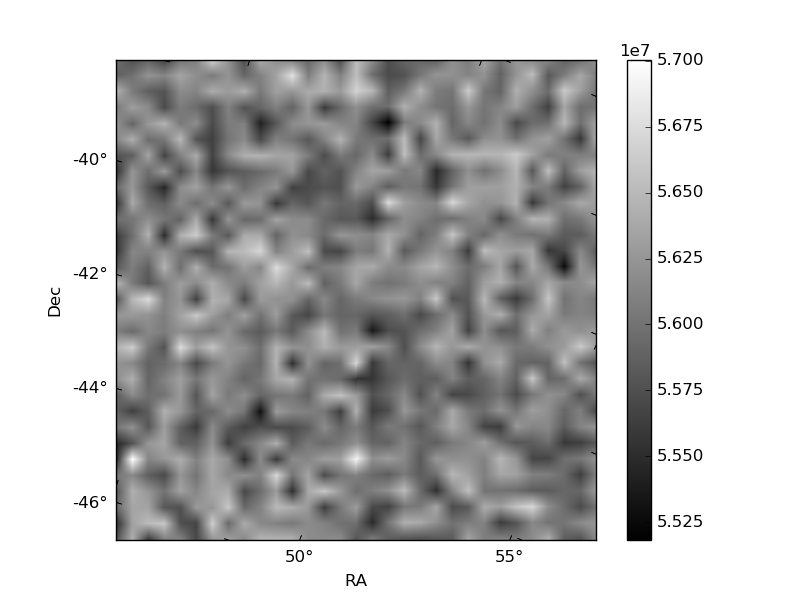
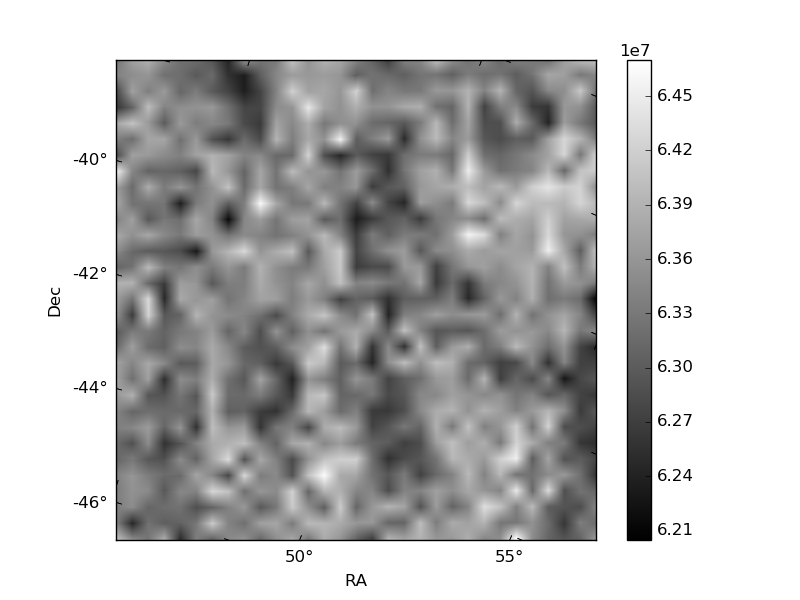
Histogram calculated using DETX and DETY for each event in the final _common_clean file
| Quadrant A | 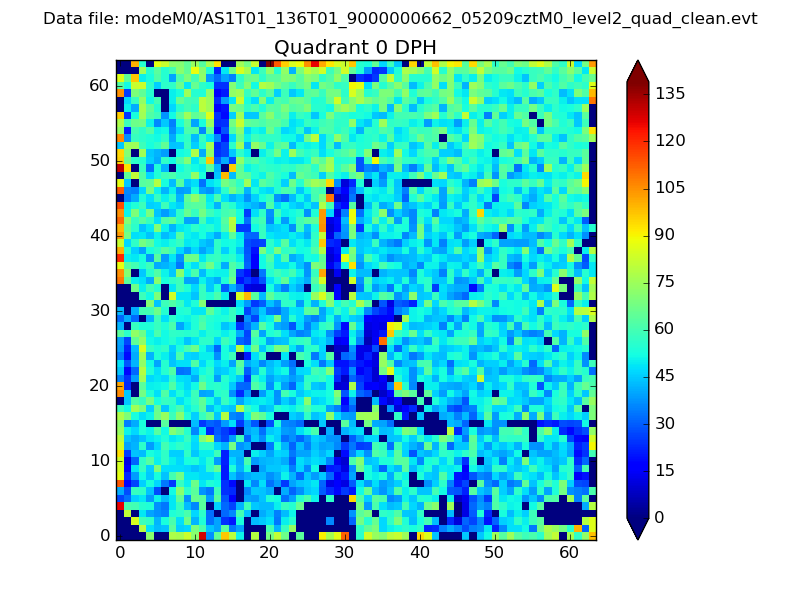 |
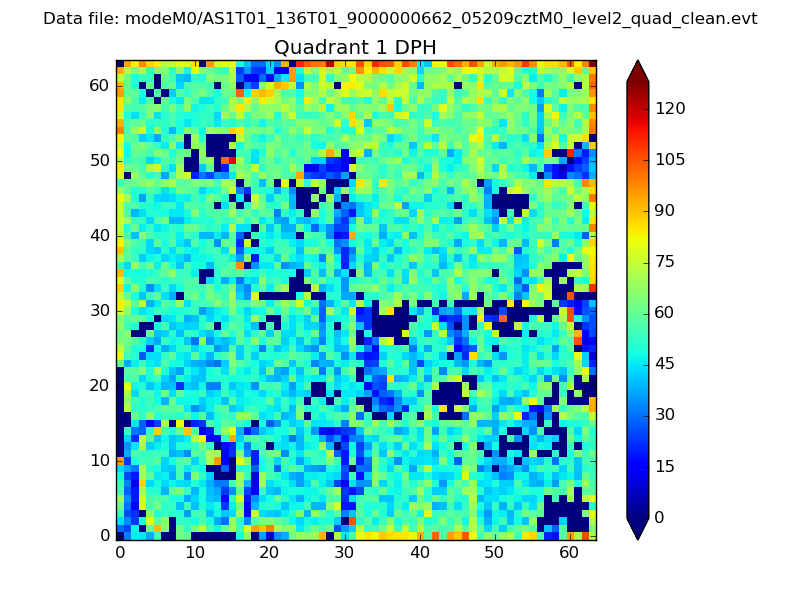 |
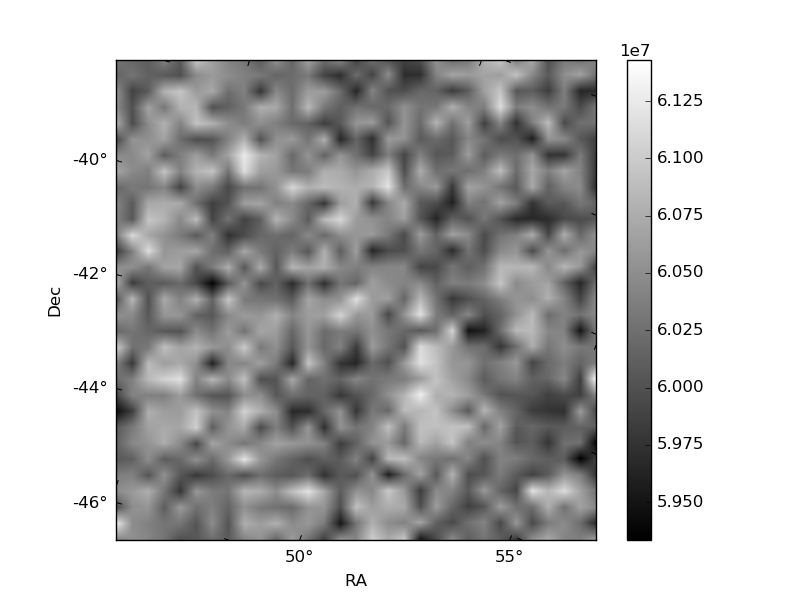
Quadrant B |
|---|---|---|---|
| Quadrant D | 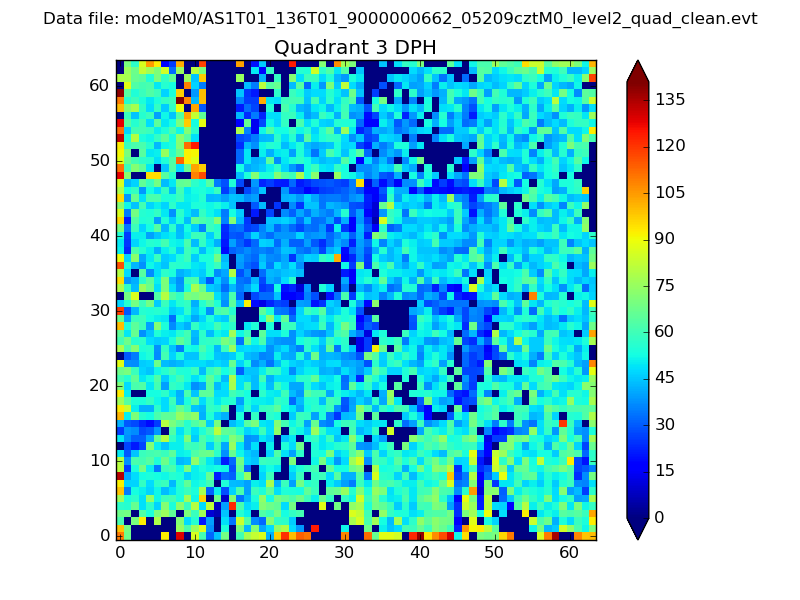 |
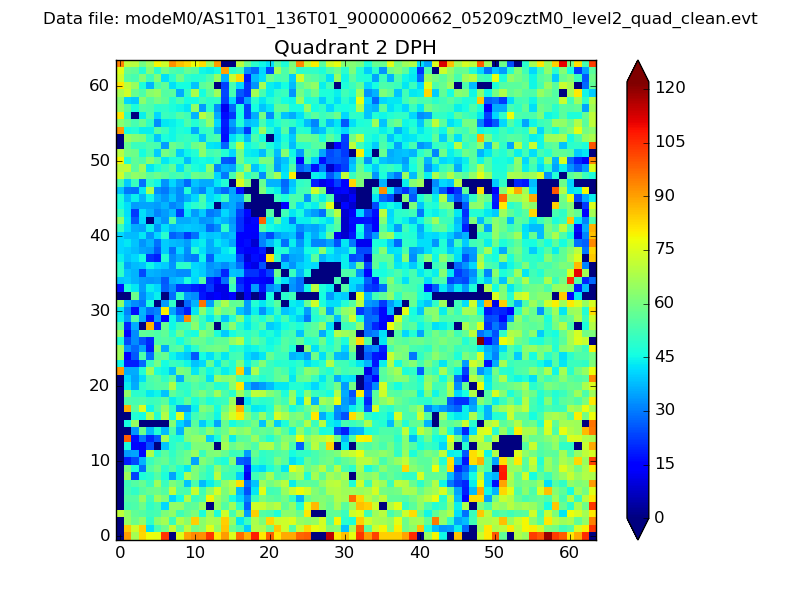 |
Quadrant C |
| Plot type | Count rate plots | Images |
|---|---|---|
| Comparison with Poisson distribution Blue bars denote a histogram of data divided into 1 sec bins. Red curve is a Poisson curve with rate = median count rate of data. |
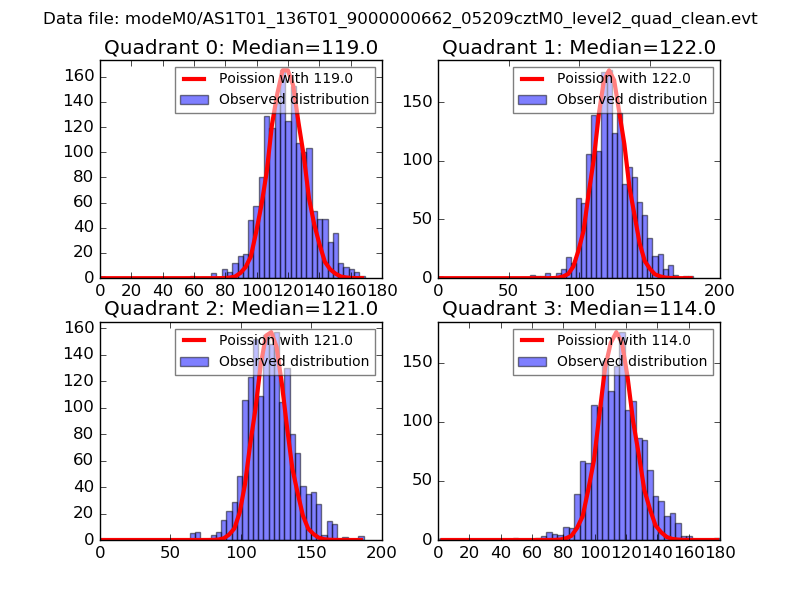 |
 |
| Quadrant-wise count rates Data is divided into 100 sec bins |
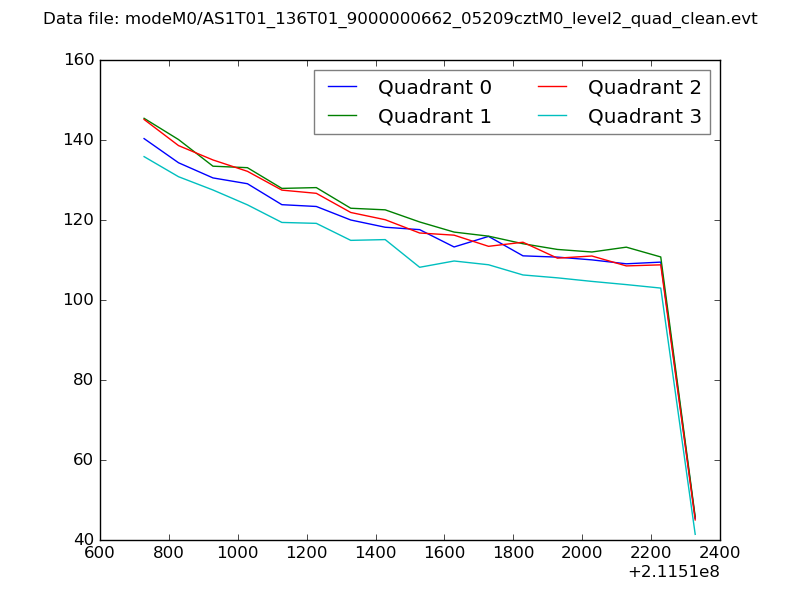 |
|
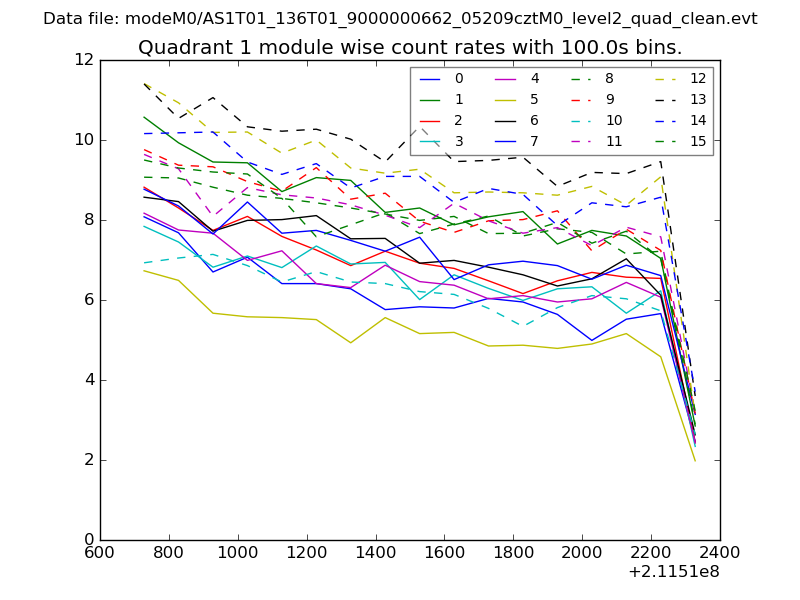
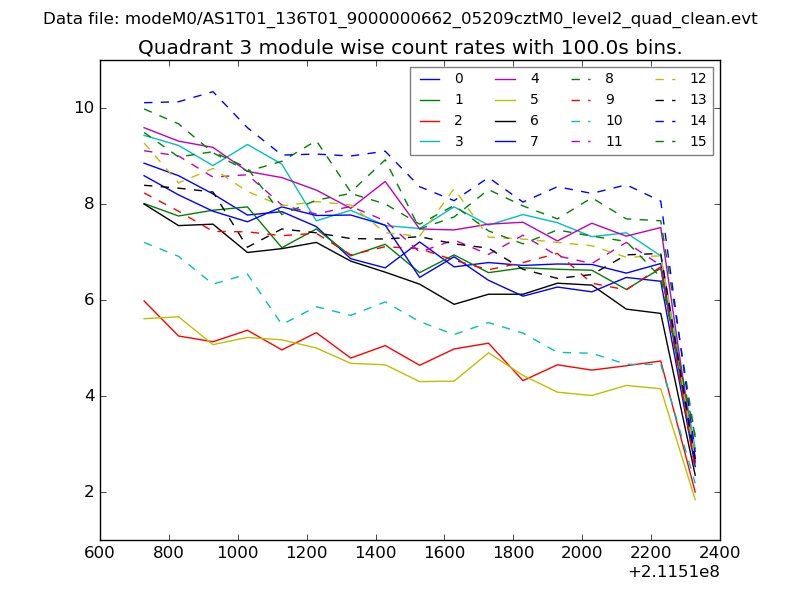
| Module-wise count rates for Quadrant A Data is divided into 100 sec bins |
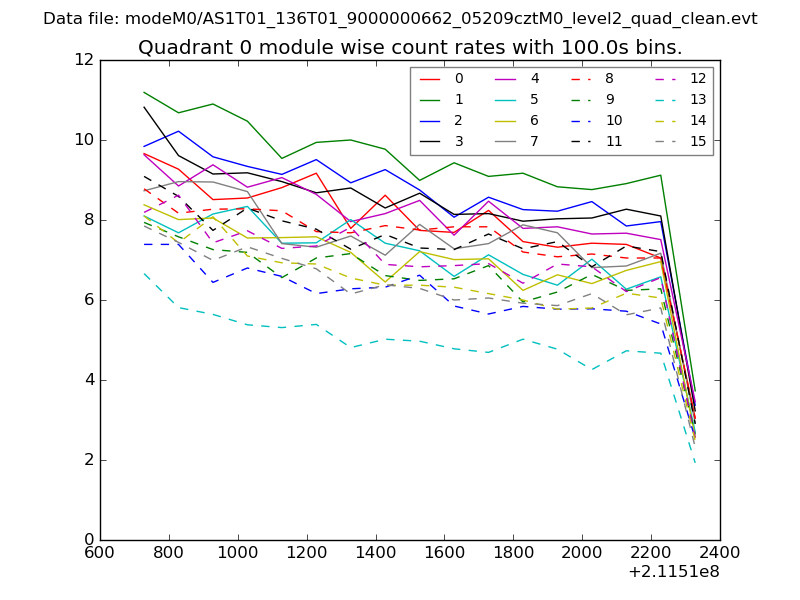 |
 |
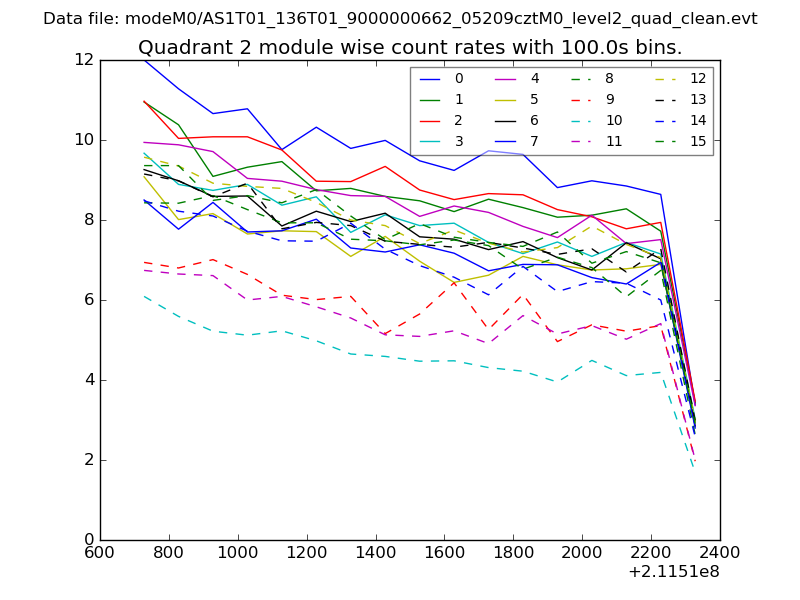
| Module-wise count rates for Quadrant B Data is divided into 100 sec bins |
 |
 |
| Module-wise count rates for Quadrant C Data is divided into 100 sec bins |
 |
 |
| Module-wise count rates for Quadrant D Data is divided into 100 sec bins |
 |
 |
| Parameter | Plot |
|---|---|
| CZT HV Monitor | 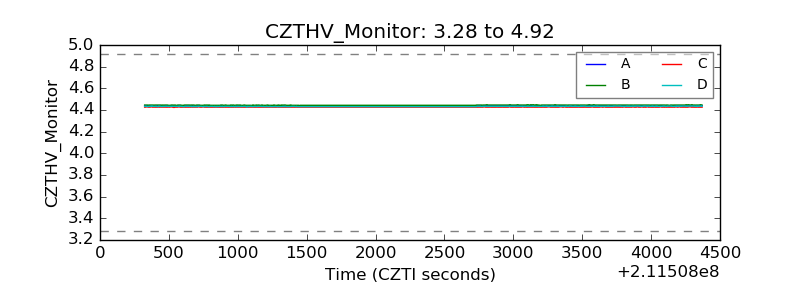 |
| D_VDD | 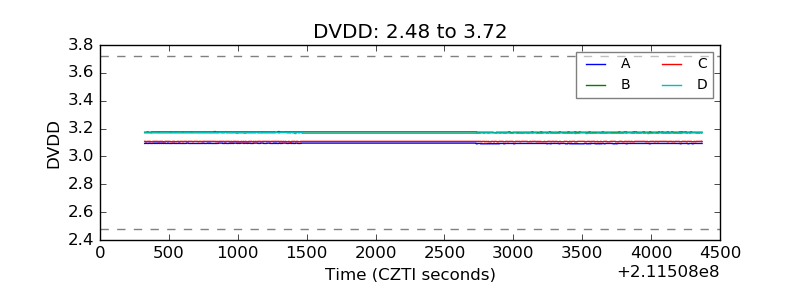 |
| Temperature 1 | 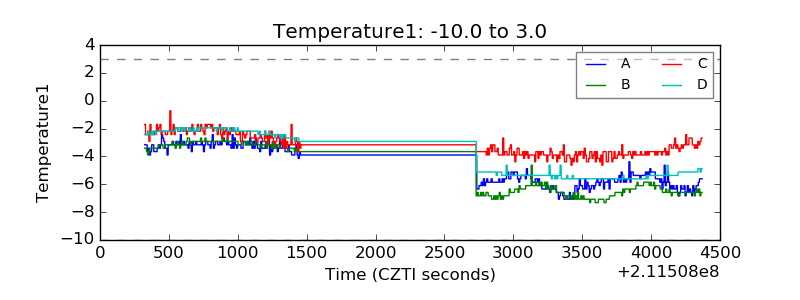 |
| Veto HV Monitor | 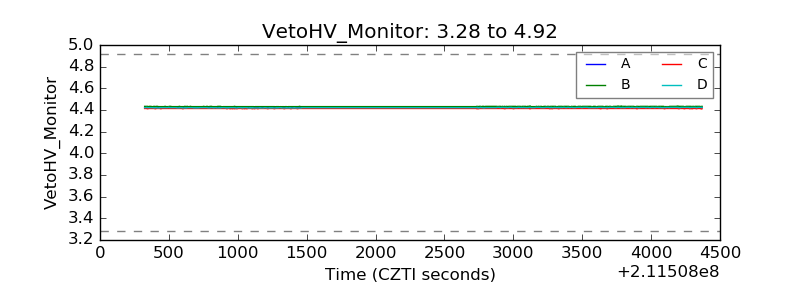 |
| Veto LLD | 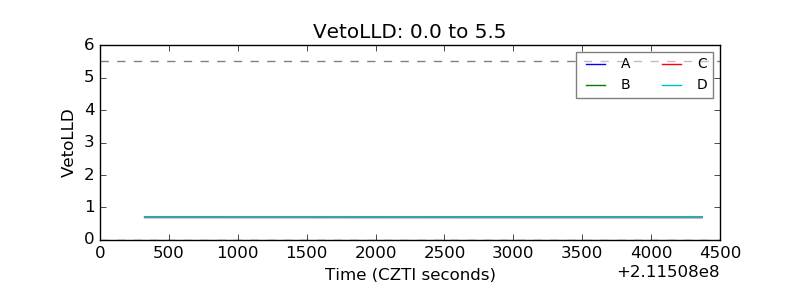 |
| Alpha Counter | 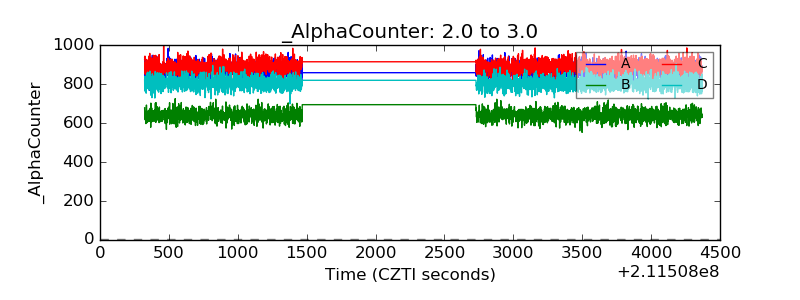 |
| _CPM_Rate | 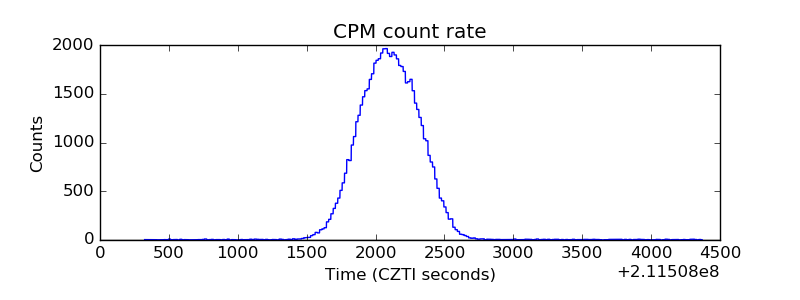 |
| CZT Counter | 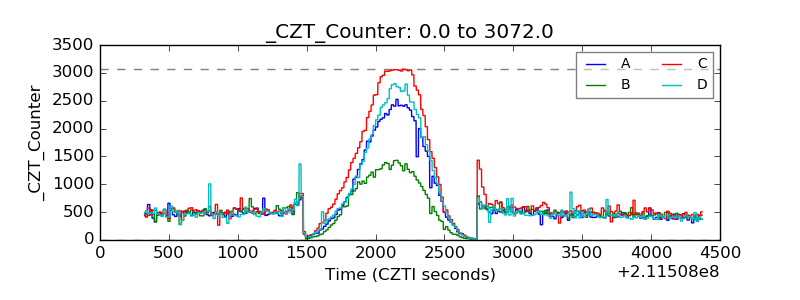 |
| +2.5 Volts monitor | 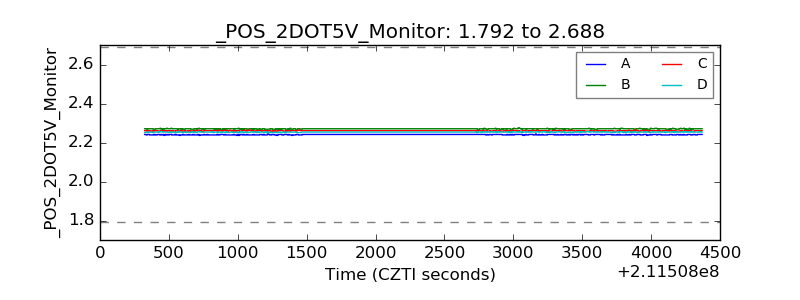 |
| +5 Volts monitor | 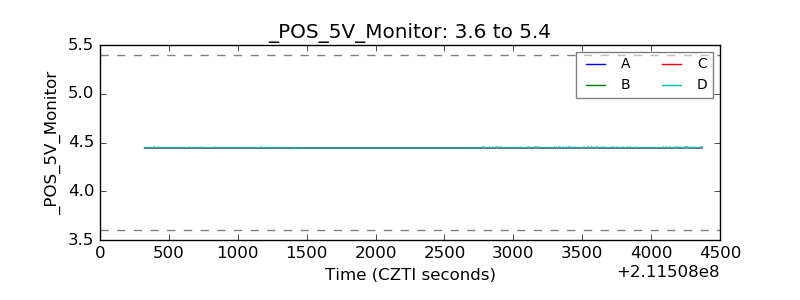 |
| _ROLL_ROT | 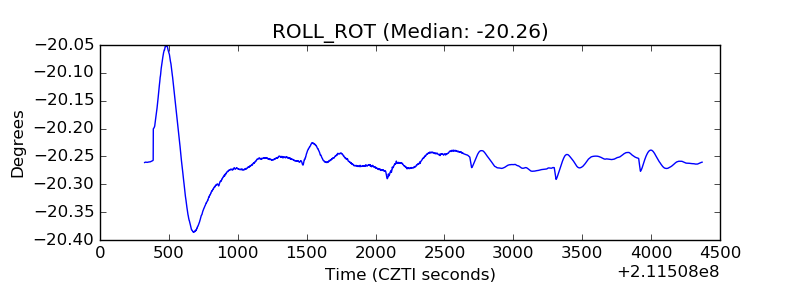 |
| _Roll_DEC | 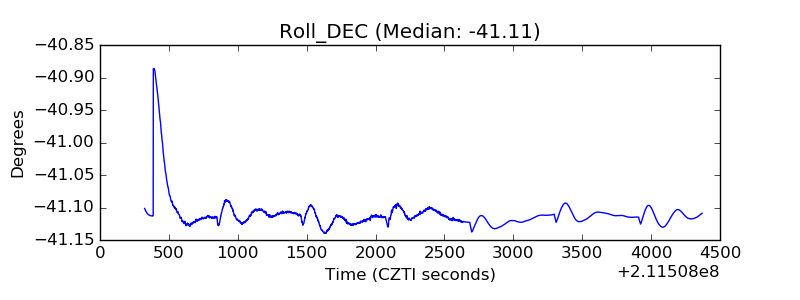 |
| _Roll_RA | 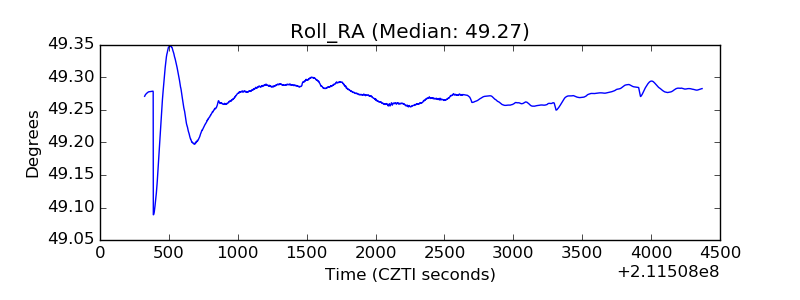 |
| Veto Counter | 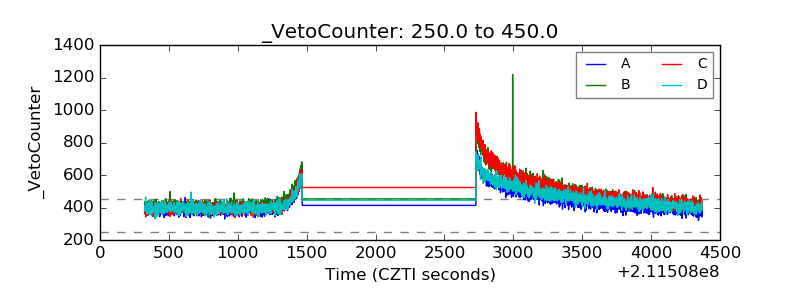 |