| Param | Original file | Final file |
|---|---|---|
| Filename | modeM0/AS1T01_136T01_9000000662_05211cztM0_level2.evt | modeM0/AS1T01_136T01_9000000662_05211cztM0_level2_quad_clean.evt |
| Size (bytes) | 454,512,960 | 78,076,800 |
| Size | 433.5 MB | 74.5 MB |
| Events in quadrant A | 2,960,848 | 484,294 |
| Events in quadrant B | 3,137,868 | 492,039 |
| Events in quadrant C | 3,275,668 | 489,142 |
| Events in quadrant D | 3,963,018 | 459,686 |
| Mode M9 | |||
|---|---|---|---|
| Quadrant | BADHDUFLAG | Total packets | Discarded packets |
| A | 0 | 16 | 0 |
| B | 0 | 16 | 0 |
| C | 0 | 16 | 0 |
| D | 0 | 17 | 0 |
| Mode SS | |||
|---|---|---|---|
| Quadrant | BADHDUFLAG | Total packets | Discarded packets |
| A | 0 | 128 | 0 |
| B | 0 | 128 | 0 |
| C | 0 | 128 | 0 |
| D | 0 | 128 | 2 |
| Mode M0 | |||
|---|---|---|---|
| Quadrant | BADHDUFLAG | Total packets | Discarded packets |
| A | 0 | 13028 | 10 |
| B | 0 | 13403 | 7 |
| C | 0 | 13745 | 14 |
| D | 0 | 16066 | 14 |
| Quadrant | Total seconds | Saturated seconds | Saturation percentage |
|---|---|---|---|
| A | 6293 | 42 | 0.667408% |
| B | 6294 | 57 | 0.905624% |
| C | 6292 | 30 | 0.476796% |
| D | 6290 | 367 | 5.834658% |
Noise dominated data is calculated using 1-second bins in cleaned event files. If a bin has >2000 counts, and if more than 50% of those come from <1% of pixels, then it is considered to be noise-dominated and hence unusable.
| Quadrant | # 1 sec bins | Bins with >0 counts | Bins with >2000 counts | High rate bins dominated by noise | Noise dominated (total time) | Noise dominated (detector-on time) | Marked lightcurve |
|---|---|---|---|---|---|---|---|
| A | 7581 | 6298 | 14 | 14 | 0.18% | 0.22% | 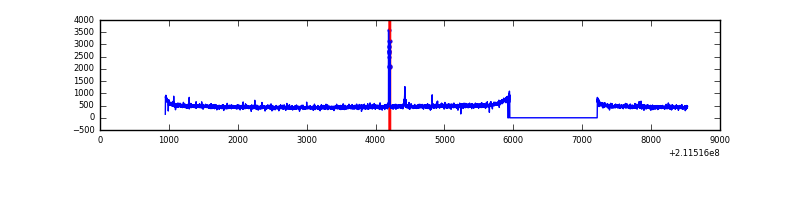 |
| B | 7581 | 6298 | 15 | 15 | 0.20% | 0.24% | 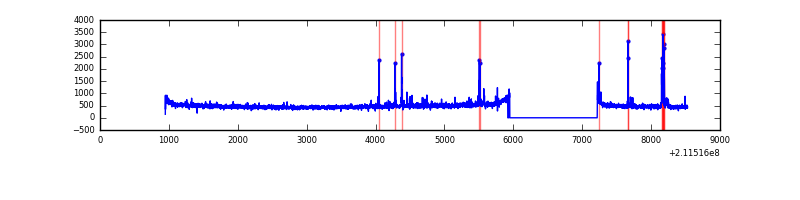 |
| C | 7581 | 6298 | 0 | 0 | 0.00% | 0.00% | 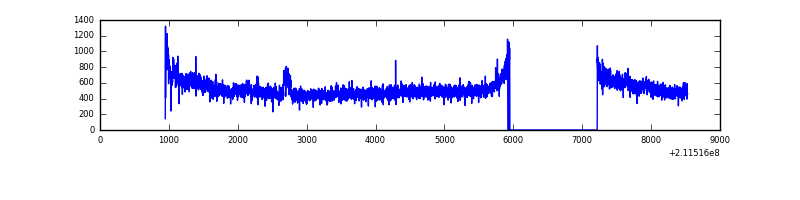 |
| D | 7581 | 6297 | 171 | 171 | 2.26% | 2.72% | 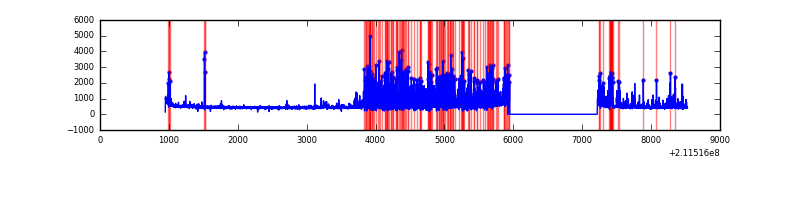 |
Top three noisy pixels from each quadrant. If the there are fewer than three noisy pixels in the level2.evt file, extra rows are filled as -1
| Pixel properties | Quadrant properties | ||||||
|---|---|---|---|---|---|---|---|
| Quadrant | DetID | PixID | Counts | Sigma | Mean | Median | Sigma |
| A | 0 | 50 | 54293 | 349.05 | 754 | 737 | 153.4 |
| A | 12 | 194 | 7426 | 43.59 | 754 | 737 | 153.4 |
| A | 0 | 226 | 7336 | 43.01 | 754 | 737 | 153.4 |
| B | 4 | 48 | 125889 | 865.66 | 765 | 746 | 144.6 |
| B | 4 | 80 | 22034 | 147.26 | 765 | 746 | 144.6 |
| B | 12 | 111 | 13120 | 85.6 | 765 | 746 | 144.6 |
| C | 1 | 16 | 329971 | 1885.04 | 754 | 759 | 174.6 |
| C | 13 | 61 | 6099 | 30.58 | 754 | 759 | 174.6 |
| C | 12 | 4 | 3901 | 17.99 | 754 | 759 | 174.6 |
| D | 1 | 239 | 941111 | 5307.63 | 729 | 708 | 177.2 |
| D | 1 | 31 | 133655 | 750.35 | 729 | 708 | 177.2 |
| D | 2 | 136 | 51639 | 287.45 | 729 | 708 | 177.2 |
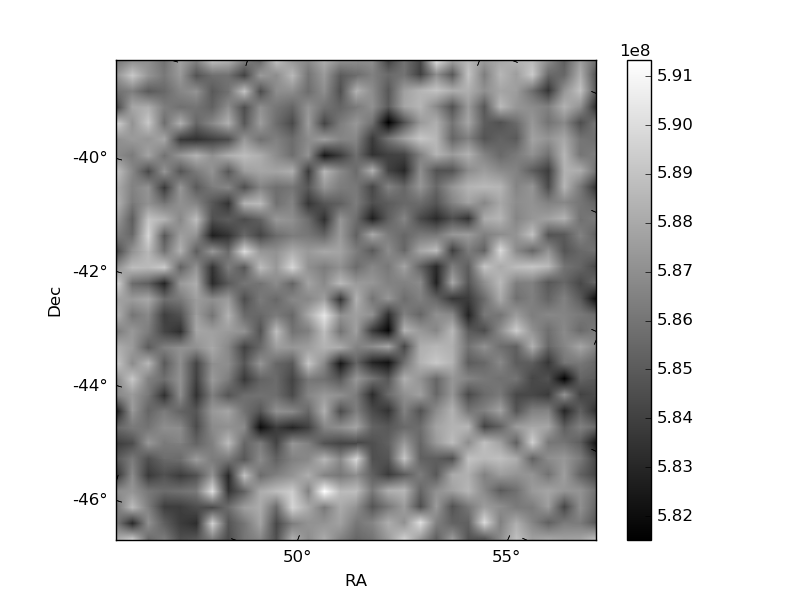
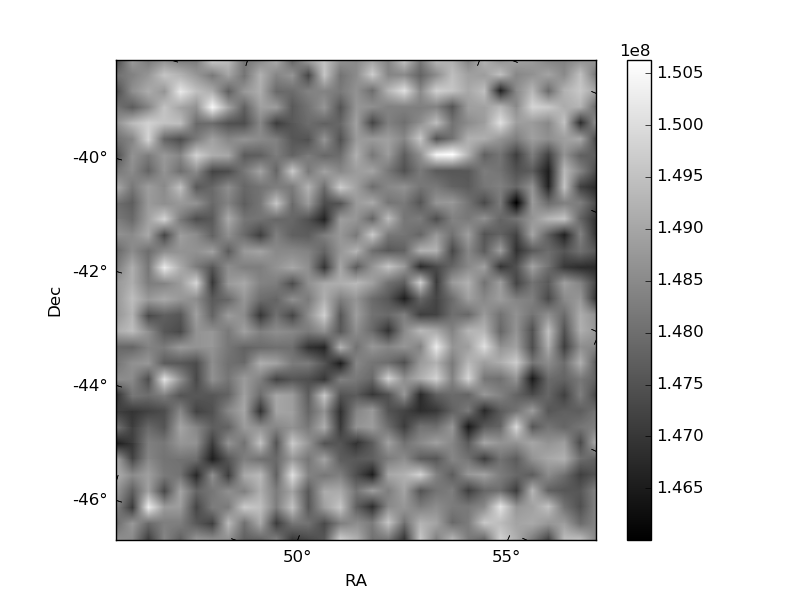
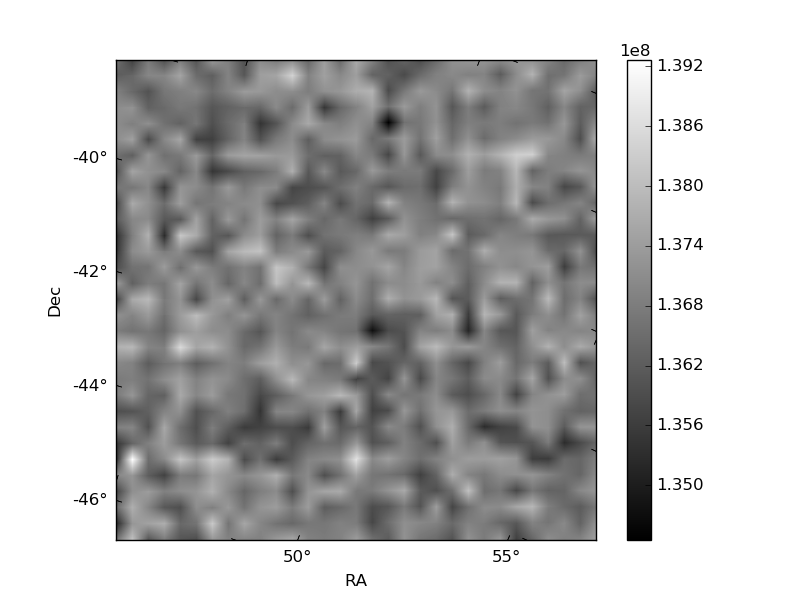
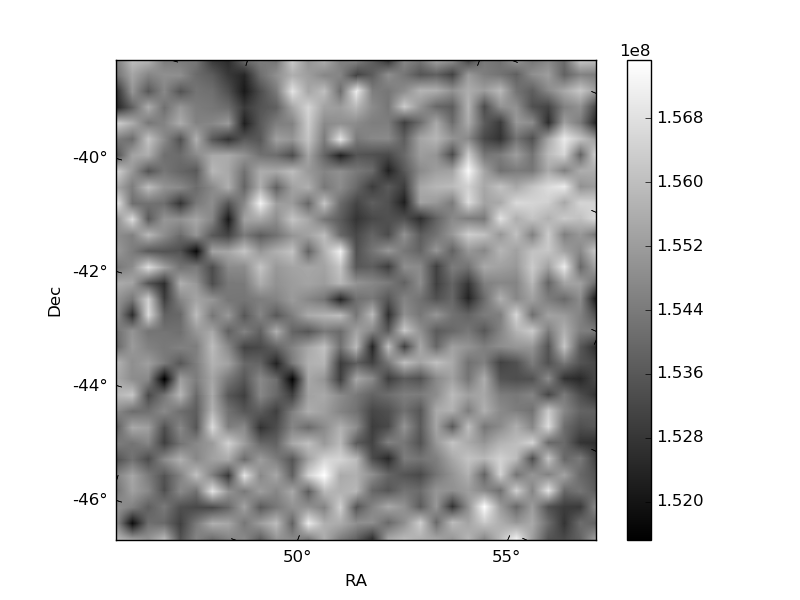
Histogram calculated using DETX and DETY for each event in the final _common_clean file
| Quadrant A | 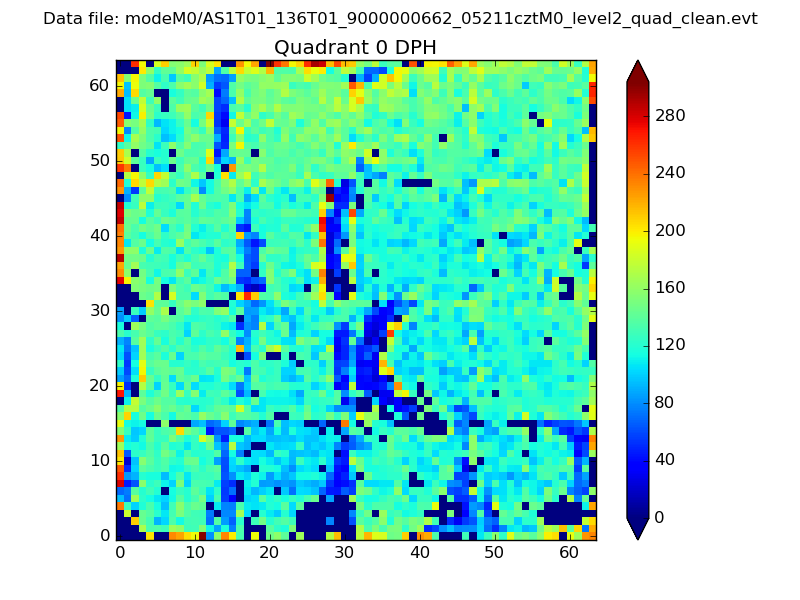 |
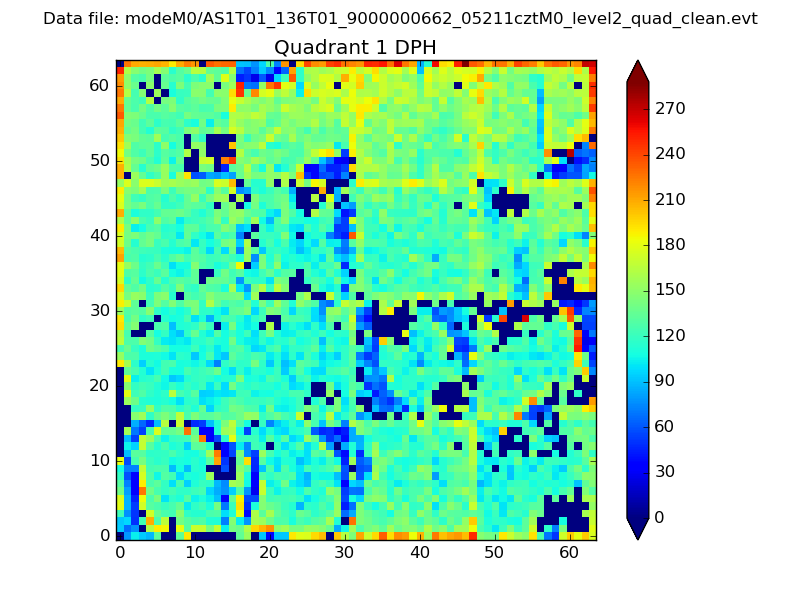 |
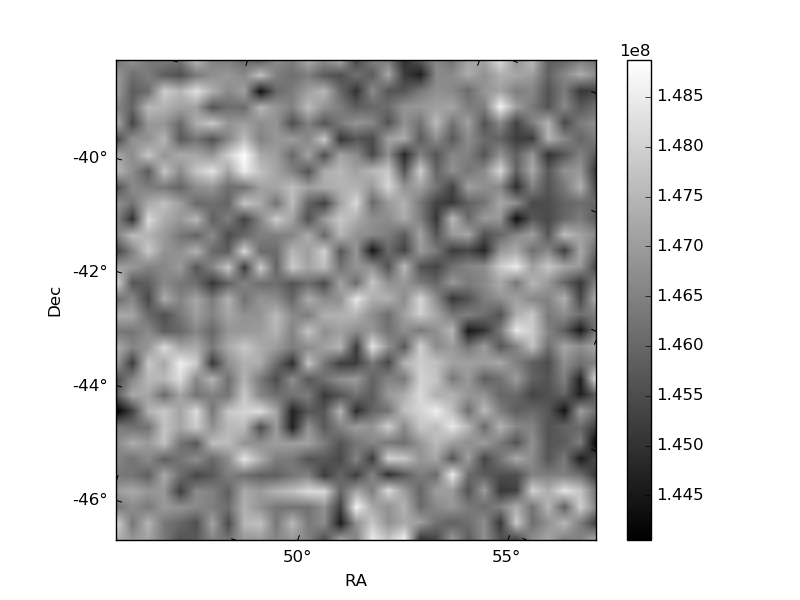
Quadrant B |
|---|---|---|---|
| Quadrant D | 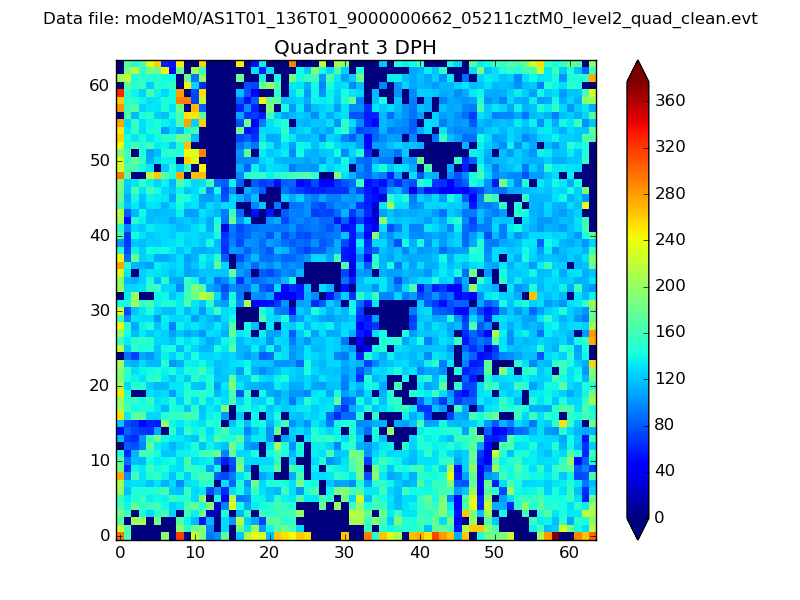 |
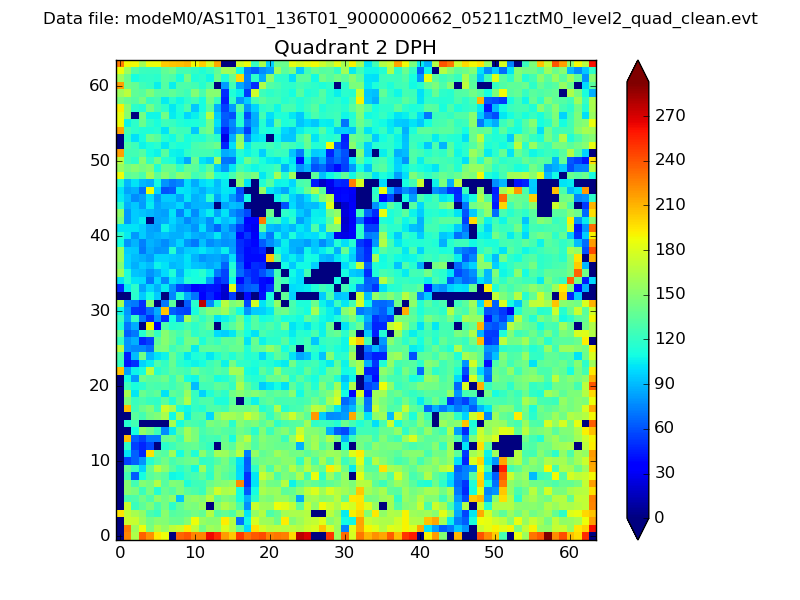 |
Quadrant C |
| Plot type | Count rate plots | Images |
|---|---|---|
| Comparison with Poisson distribution Blue bars denote a histogram of data divided into 1 sec bins. Red curve is a Poisson curve with rate = median count rate of data. |
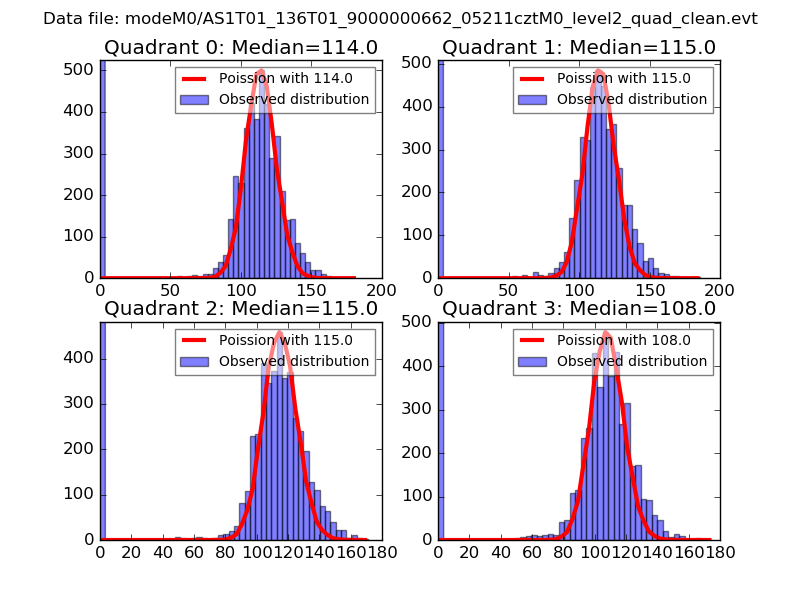 |
 |
| Quadrant-wise count rates Data is divided into 100 sec bins |
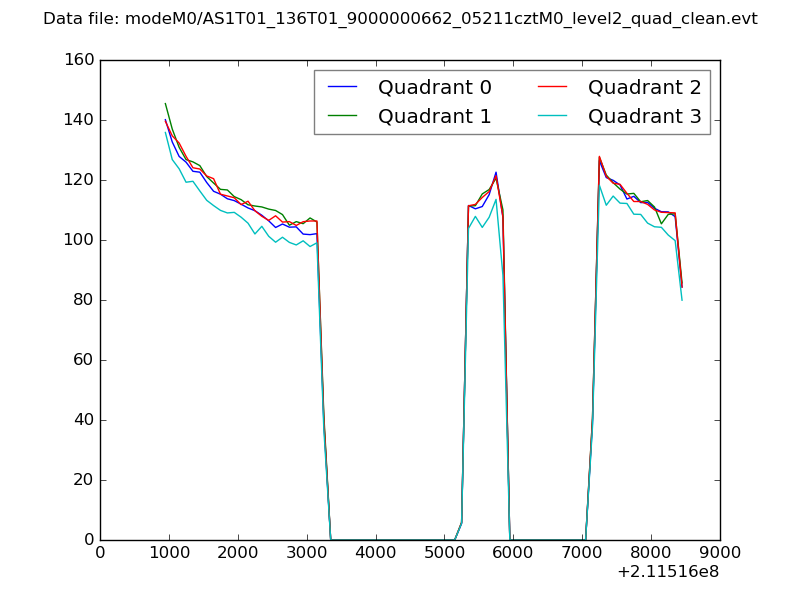 |
|
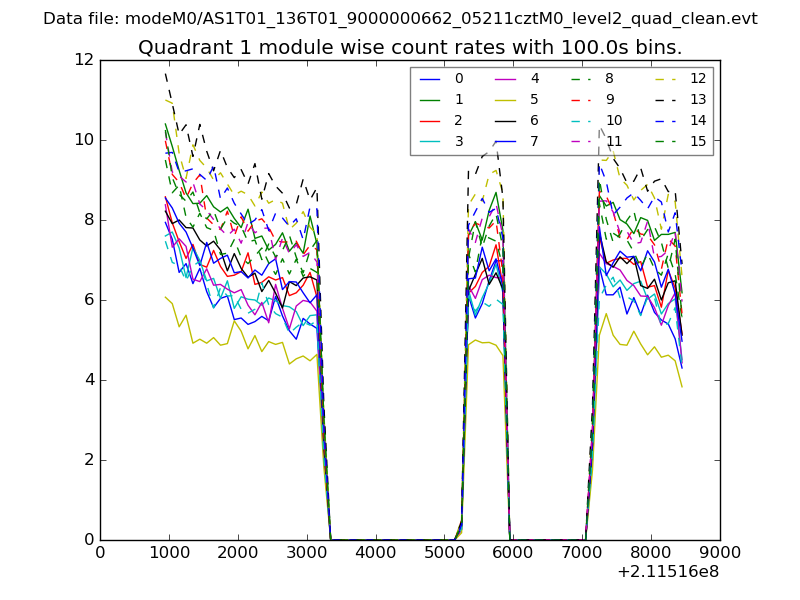
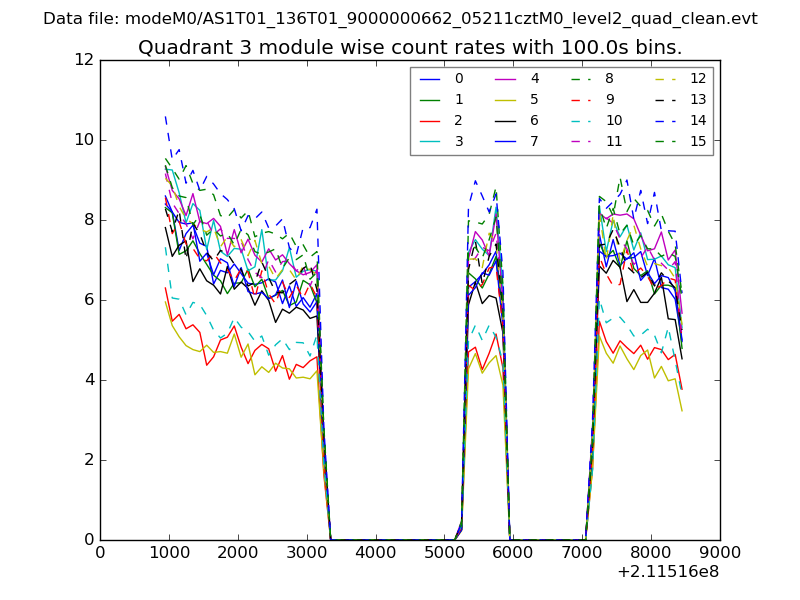
| Module-wise count rates for Quadrant A Data is divided into 100 sec bins |
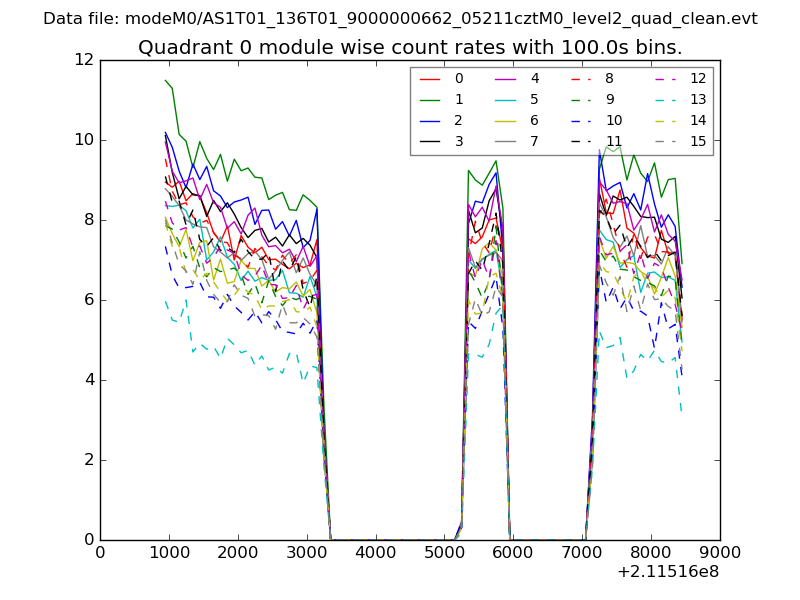 |
 |
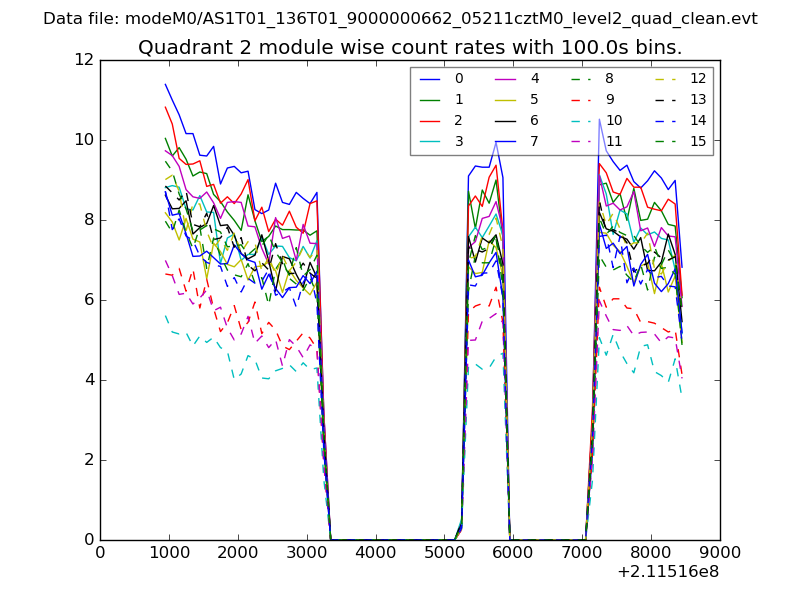
| Module-wise count rates for Quadrant B Data is divided into 100 sec bins |
 |
 |
| Module-wise count rates for Quadrant C Data is divided into 100 sec bins |
 |
 |
| Module-wise count rates for Quadrant D Data is divided into 100 sec bins |
 |
 |
| Parameter | Plot |
|---|---|
| CZT HV Monitor | 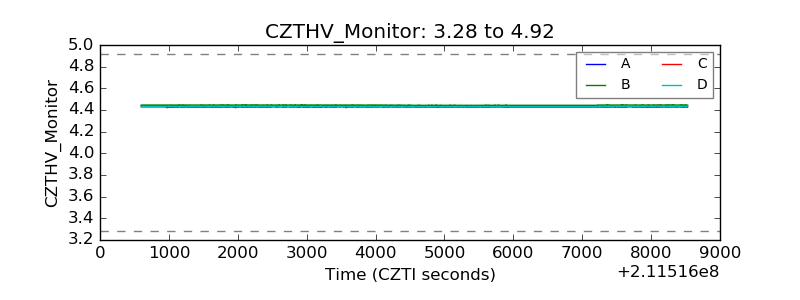 |
| D_VDD | 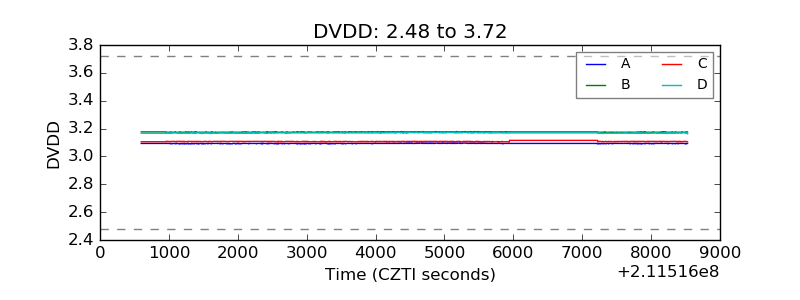 |
| Temperature 1 | 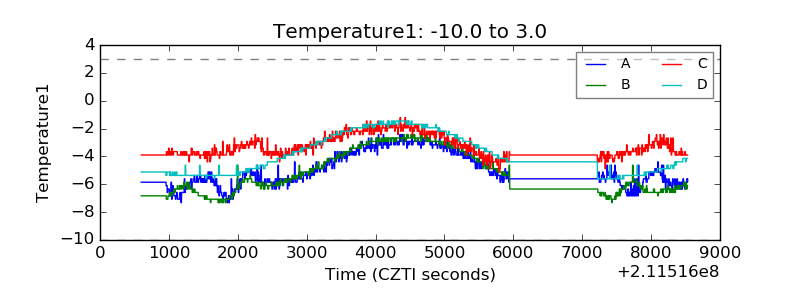 |
| Veto HV Monitor | 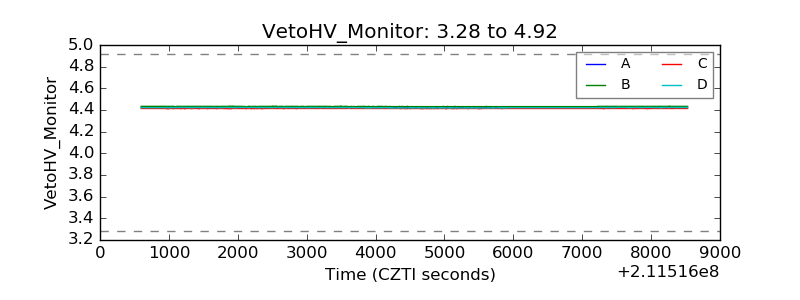 |
| Veto LLD | 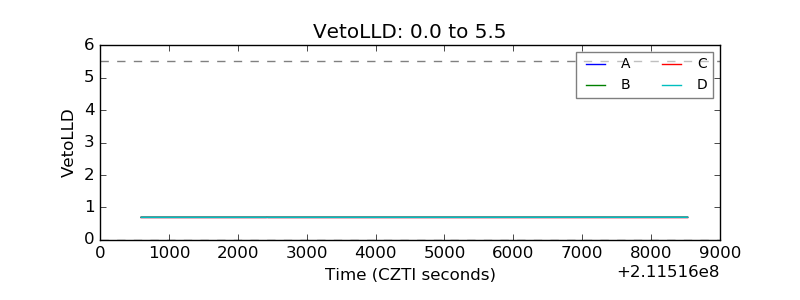 |
| Alpha Counter | 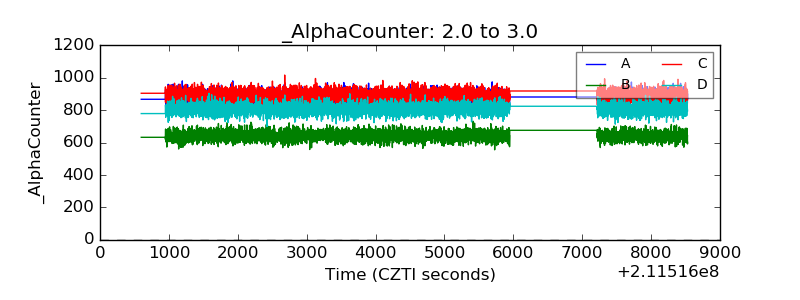 |
| _CPM_Rate | 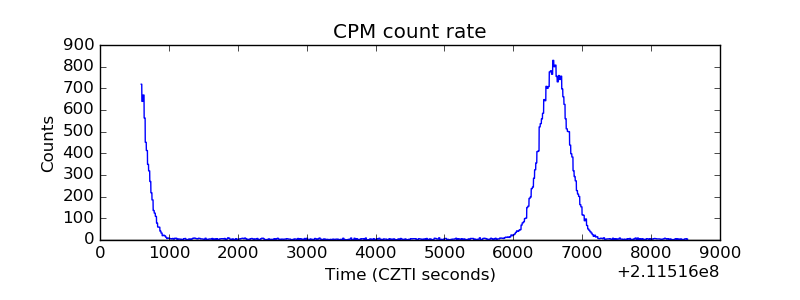 |
| CZT Counter | 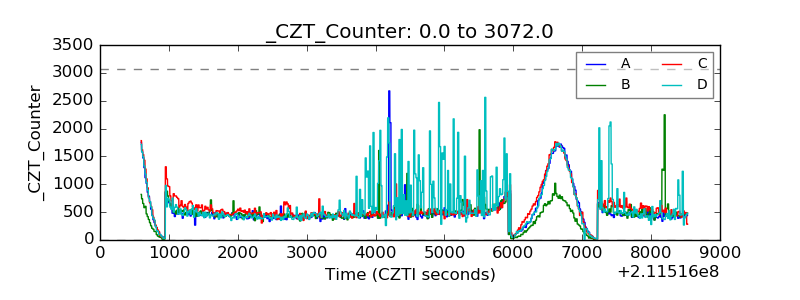 |
| +2.5 Volts monitor | 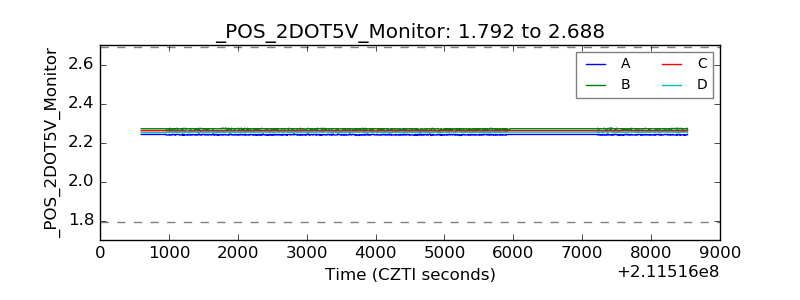 |
| +5 Volts monitor |  |
| _ROLL_ROT | 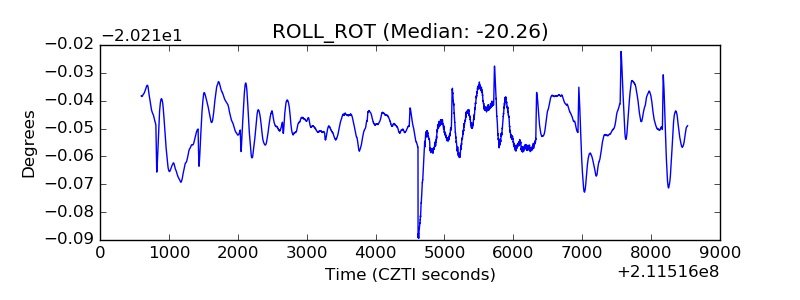 |
| _Roll_DEC | 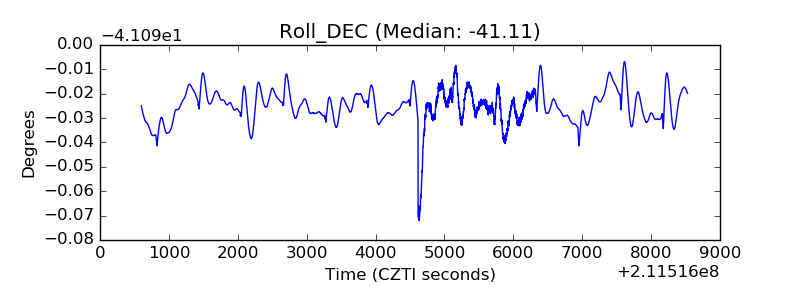 |
| _Roll_RA | 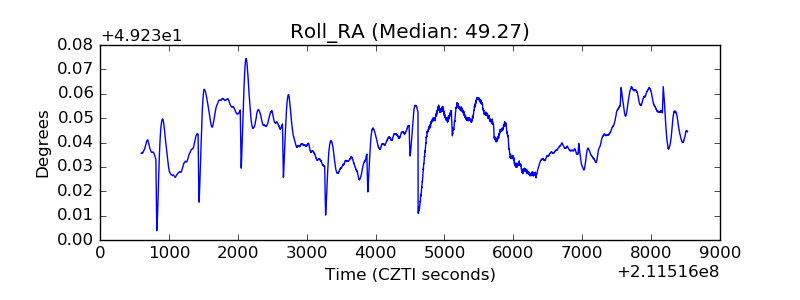 |
| Veto Counter | 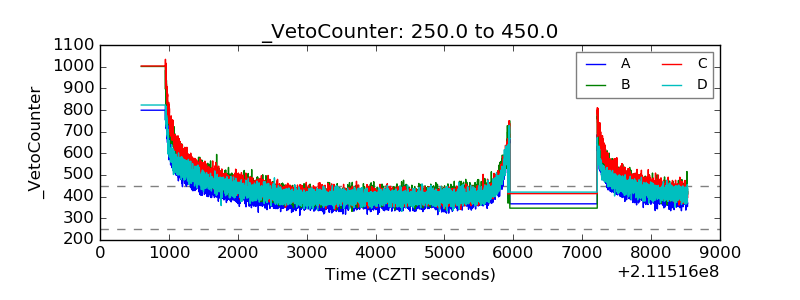 |