| Param | Original file | Final file |
|---|---|---|
| Filename | modeM0/AS1T01_136T01_9000000662_05215cztM0_level2.evt | modeM0/AS1T01_136T01_9000000662_05215cztM0_level2_quad_clean.evt |
| Size (bytes) | 236,583,360 | 35,596,800 |
| Size | 225.6 MB | 33.9 MB |
| Events in quadrant A | 1,665,265 | 200,941 |
| Events in quadrant B | 1,769,345 | 202,492 |
| Events in quadrant C | 1,696,571 | 202,808 |
| Events in quadrant D | 1,765,726 | 195,312 |
| Mode SS | |||
|---|---|---|---|
| Quadrant | BADHDUFLAG | Total packets | Discarded packets |
| A | 0 | 84 | 12 |
| B | 0 | 84 | 4 |
| C | 0 | 84 | 4 |
| D | 0 | 84 | 2 |
| Mode M0 | |||
|---|---|---|---|
| Quadrant | BADHDUFLAG | Total packets | Discarded packets |
| A | 0 | 8309 | 477 |
| B | 0 | 8338 | 443 |
| C | 0 | 8267 | 389 |
| D | 0 | 8673 | 512 |
| Quadrant | Total seconds | Saturated seconds | Saturation percentage |
|---|---|---|---|
| A | 3889 | 4 | 0.102854% |
| B | 3907 | 4 | 0.102380% |
| C | 3932 | 1 | 0.025432% |
| D | 3891 | 5 | 0.128502% |
Noise dominated data is calculated using 1-second bins in cleaned event files. If a bin has >2000 counts, and if more than 50% of those come from <1% of pixels, then it is considered to be noise-dominated and hence unusable.
| Quadrant | # 1 sec bins | Bins with >0 counts | Bins with >2000 counts | High rate bins dominated by noise | Noise dominated (total time) | Noise dominated (detector-on time) | Marked lightcurve |
|---|---|---|---|---|---|---|---|
| A | 4128 | 4093 | 0 | 0 | 0.00% | 0.00% | 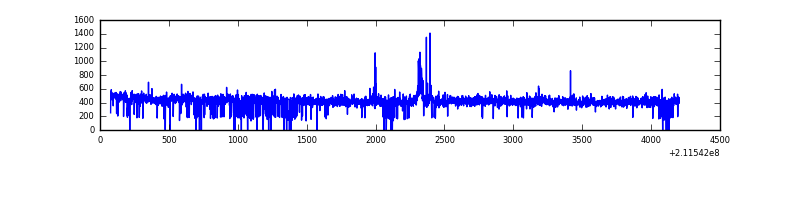 |
| B | 4128 | 4096 | 0 | 0 | 0.00% | 0.00% | 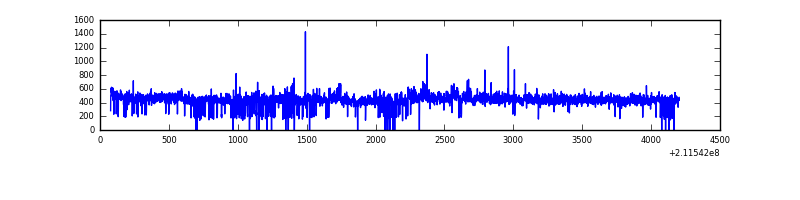 |
| C | 4128 | 4095 | 0 | 0 | 0.00% | 0.00% | 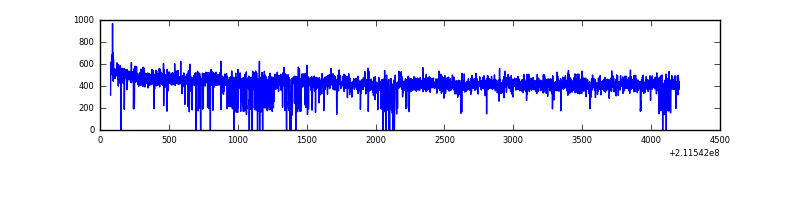 |
| D | 4128 | 4096 | 2 | 2 | 0.05% | 0.05% | 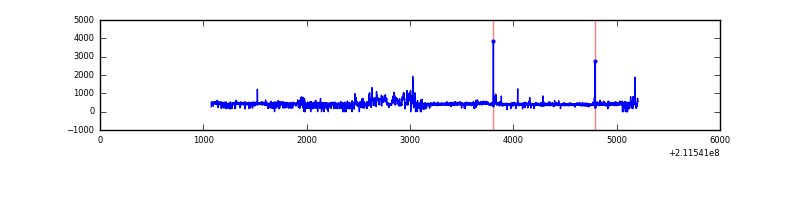 |
Top three noisy pixels from each quadrant. If the there are fewer than three noisy pixels in the level2.evt file, extra rows are filled as -1
| Pixel properties | Quadrant properties | ||||||
|---|---|---|---|---|---|---|---|
| Quadrant | DetID | PixID | Counts | Sigma | Mean | Median | Sigma |
| A | 0 | 50 | 14459 | 158.2 | 426 | 417 | 88.8 |
| A | 14 | 111 | 11624 | 126.26 | 426 | 417 | 88.8 |
| A | 12 | 194 | 4134 | 41.88 | 426 | 417 | 88.8 |
| B | 15 | 204 | 56803 | 667.47 | 431 | 420 | 84.5 |
| B | 0 | 219 | 13566 | 155.62 | 431 | 420 | 84.5 |
| B | 0 | 229 | 13063 | 149.67 | 431 | 420 | 84.5 |
| C | 1 | 16 | 34698 | 347.26 | 420 | 421 | 98.7 |
| C | 8 | 128 | 12099 | 118.31 | 420 | 421 | 98.7 |
| C | 8 | 112 | 5024 | 46.63 | 420 | 421 | 98.7 |
| D | 13 | 53 | 105371 | 1018.21 | 415 | 402 | 103.1 |
| D | 2 | 234 | 30558 | 292.52 | 415 | 402 | 103.1 |
| D | 2 | 136 | 28876 | 276.2 | 415 | 402 | 103.1 |
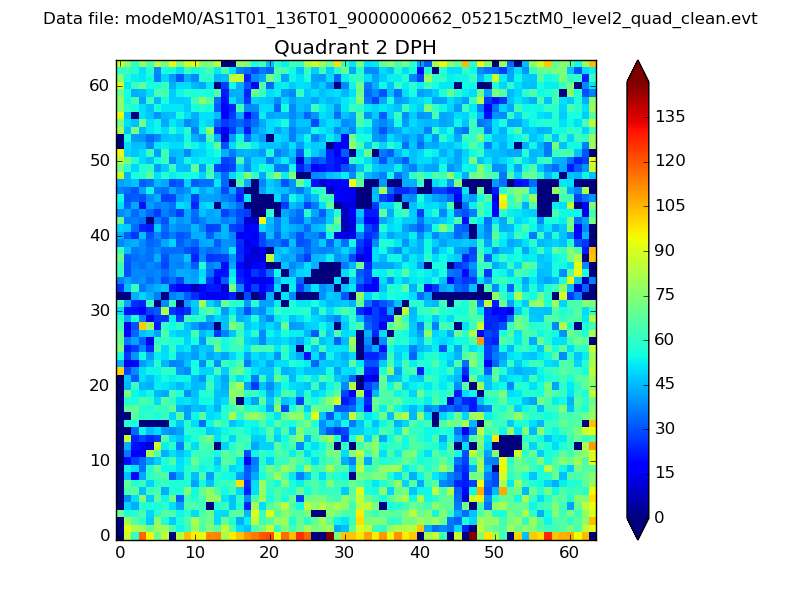
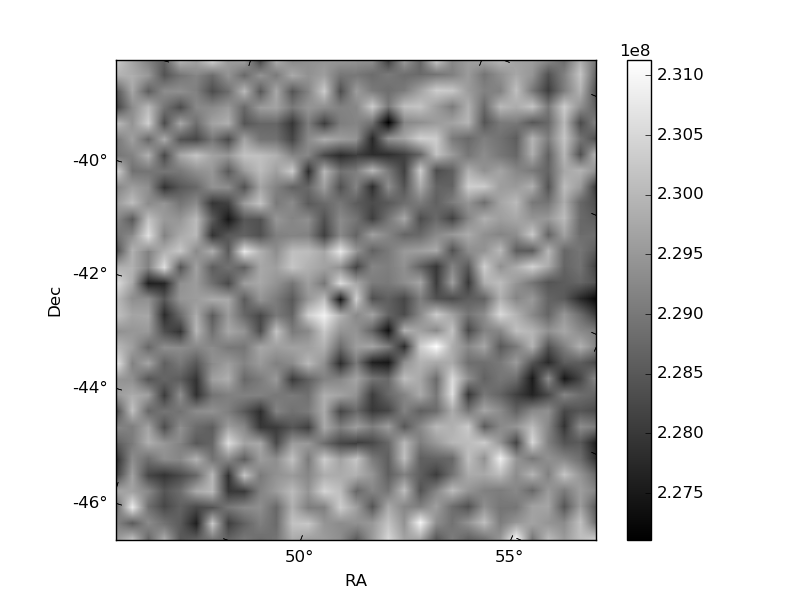
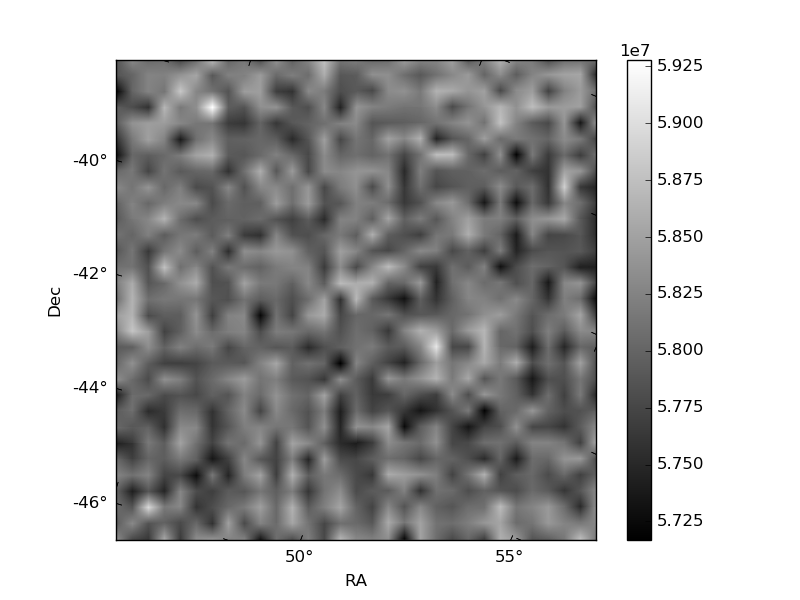
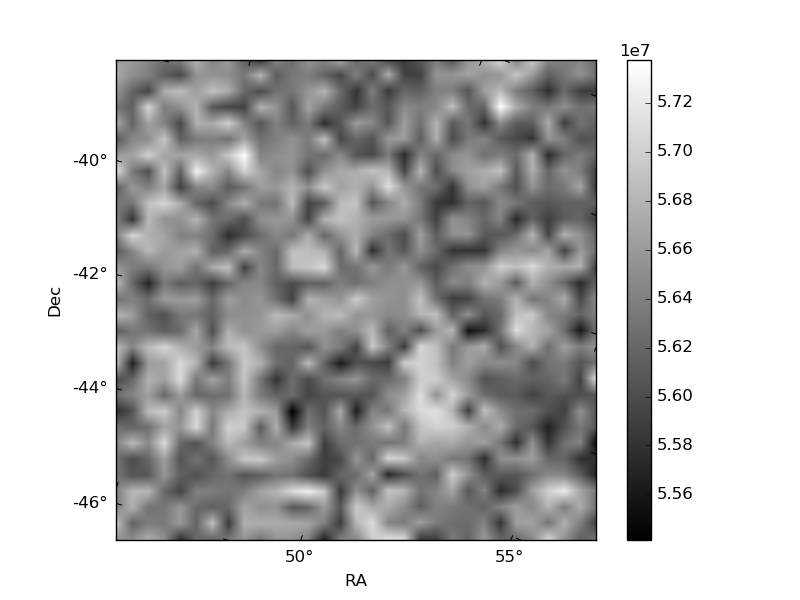
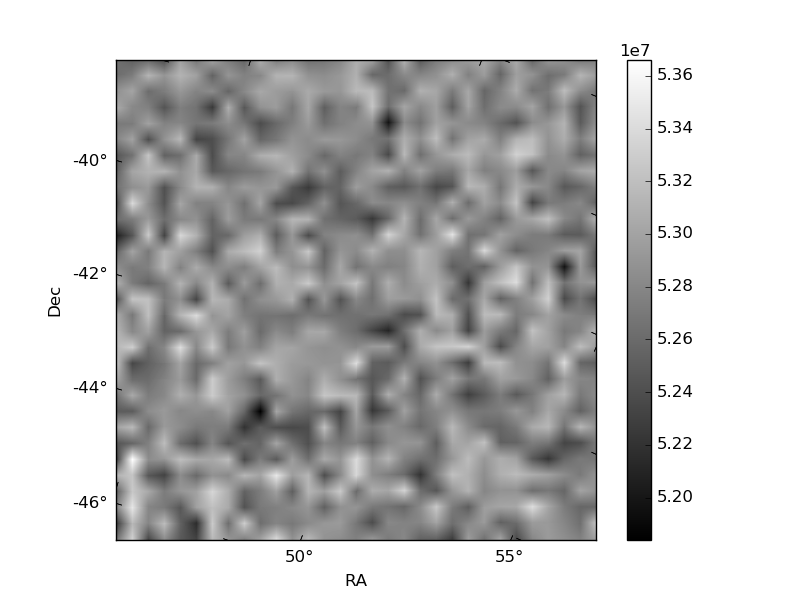
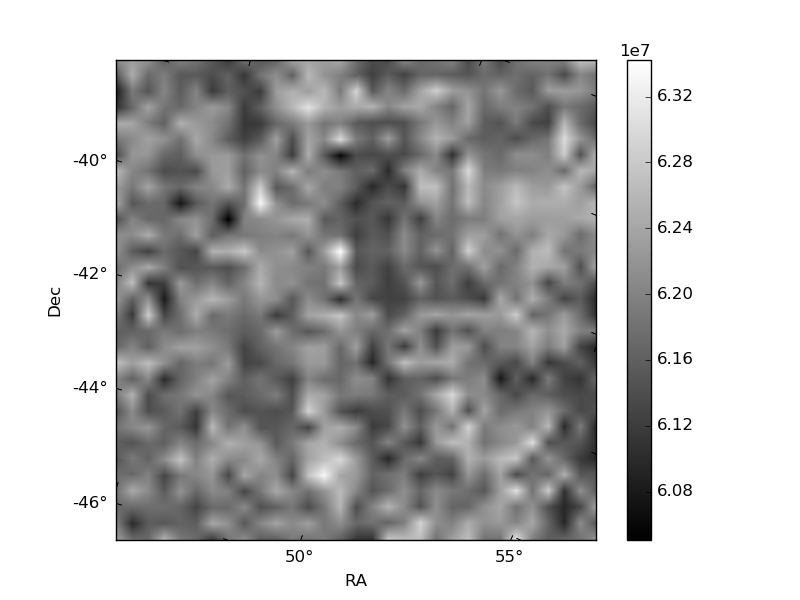
Histogram calculated using DETX and DETY for each event in the final _common_clean file
| Quadrant A | 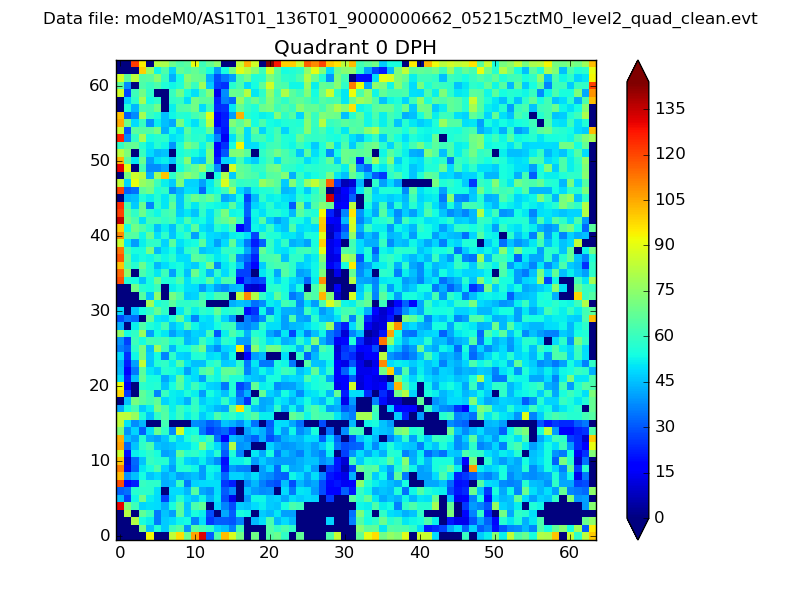 |
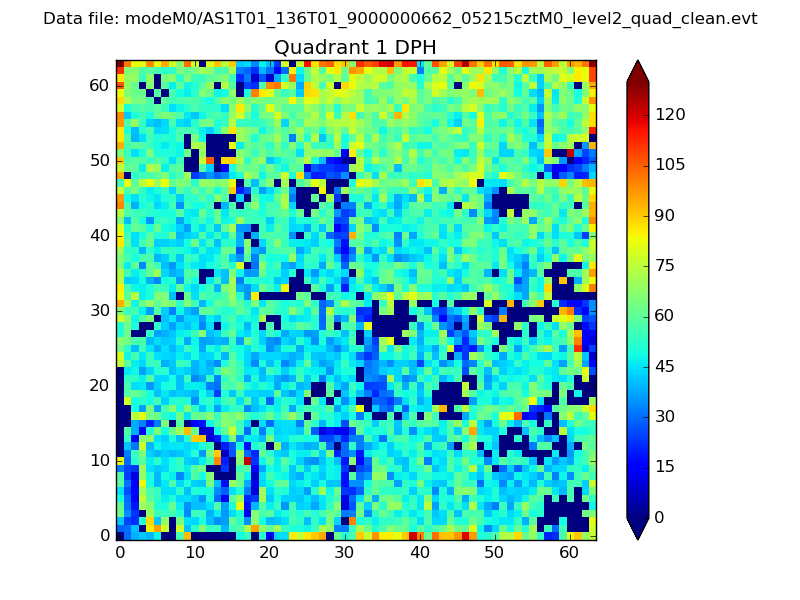 |
Quadrant B |
|---|---|---|---|
| Quadrant D | 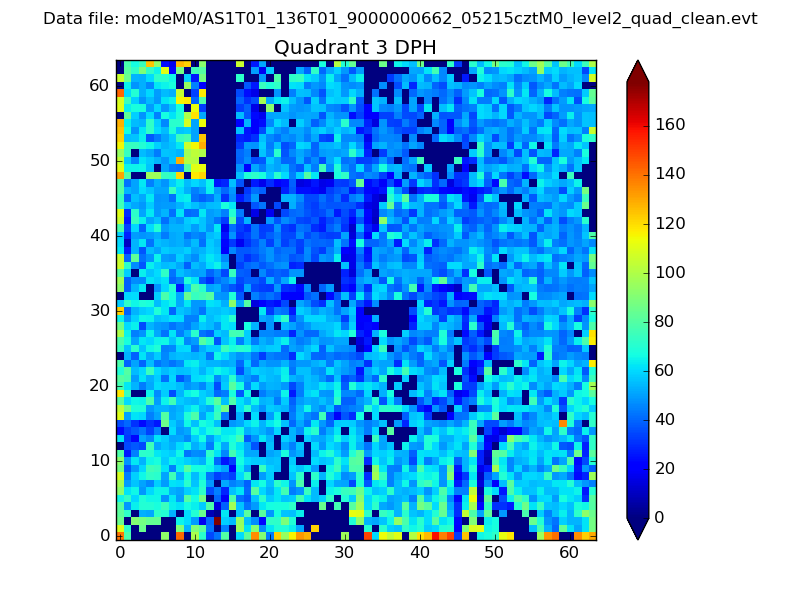 |
 |
Quadrant C |
| Plot type | Count rate plots | Images |
|---|---|---|
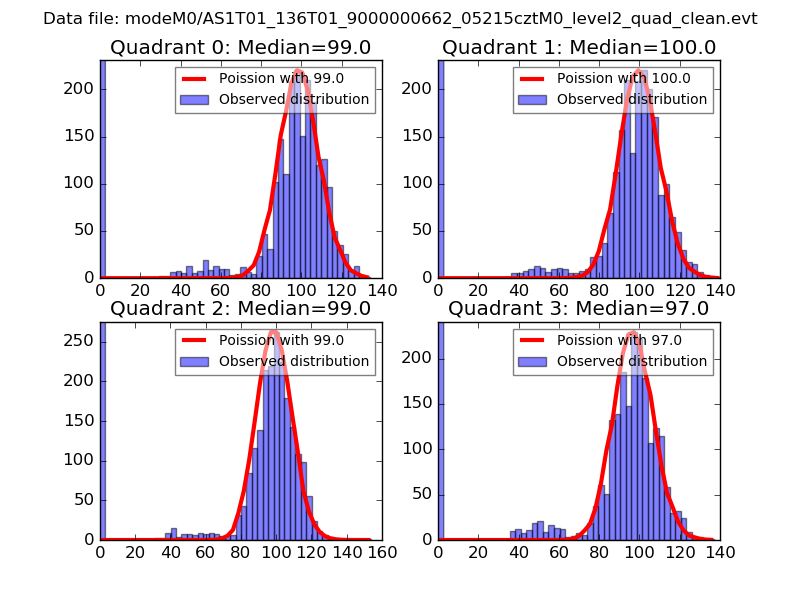
| Comparison with Poisson distribution Blue bars denote a histogram of data divided into 1 sec bins. Red curve is a Poisson curve with rate = median count rate of data. |
 |
 |
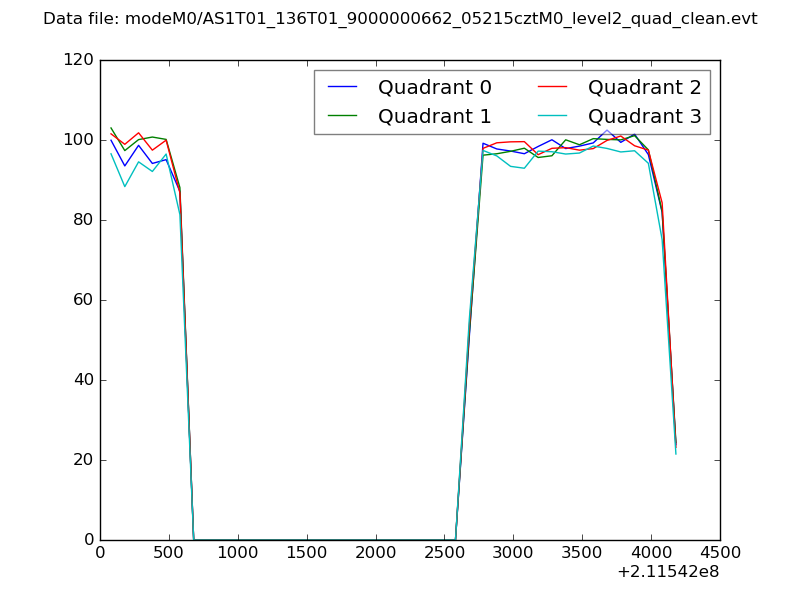
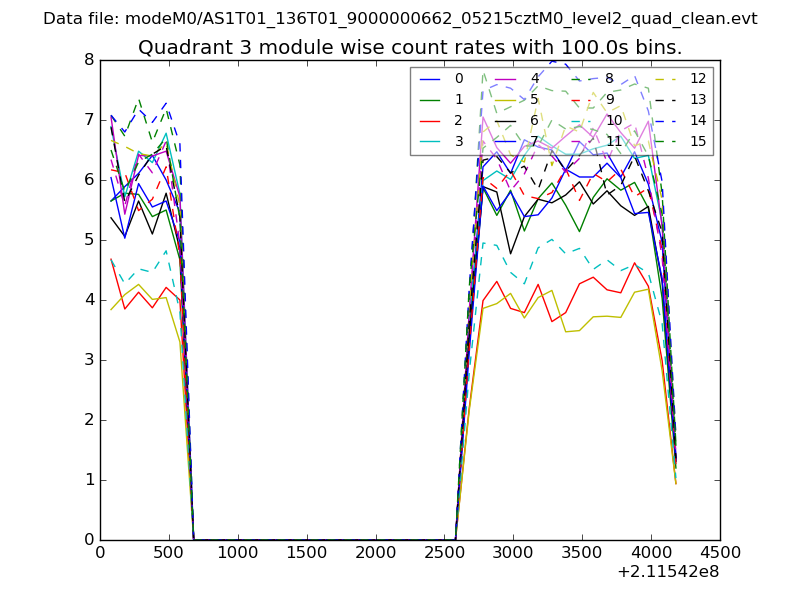
| Quadrant-wise count rates Data is divided into 100 sec bins |
 |
|
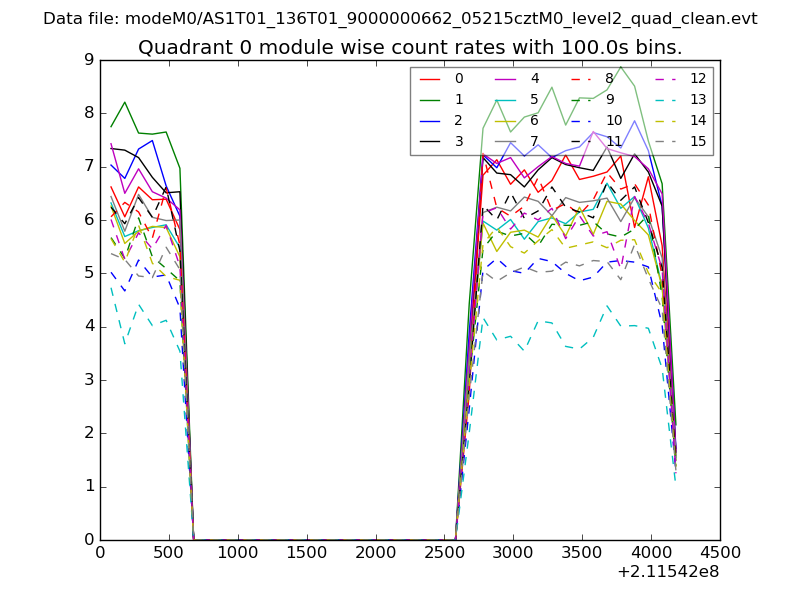
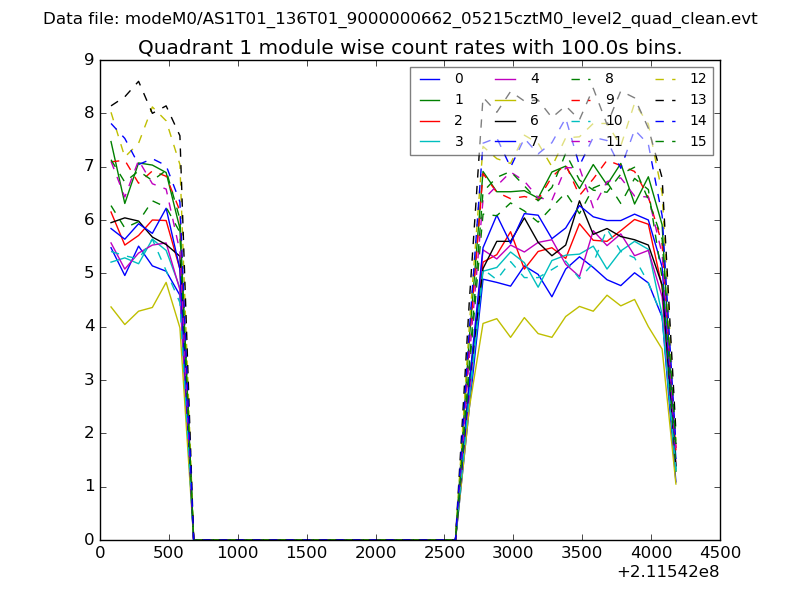
| Module-wise count rates for Quadrant A Data is divided into 100 sec bins |
 |
 |
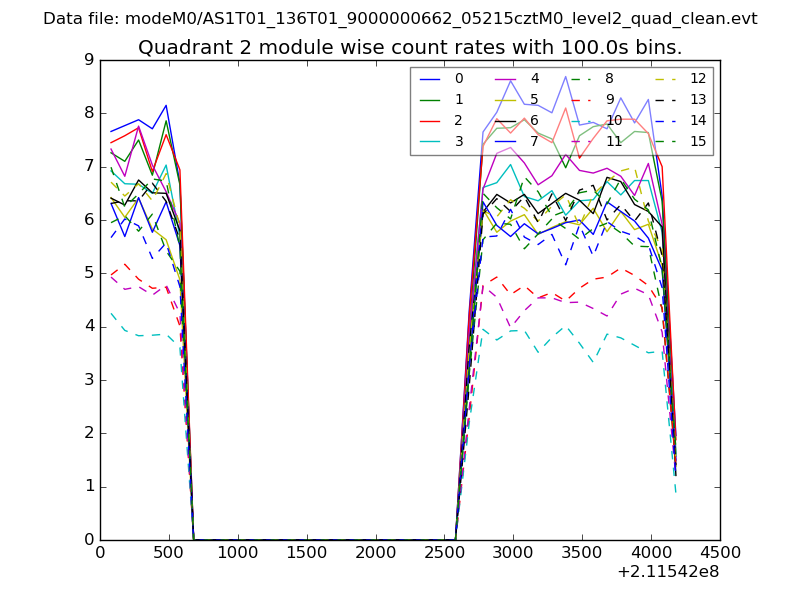
| Module-wise count rates for Quadrant B Data is divided into 100 sec bins |
 |
 |
| Module-wise count rates for Quadrant C Data is divided into 100 sec bins |
 |
 |
| Module-wise count rates for Quadrant D Data is divided into 100 sec bins |
 |
 |
| Parameter | Plot |
|---|---|
| CZT HV Monitor | 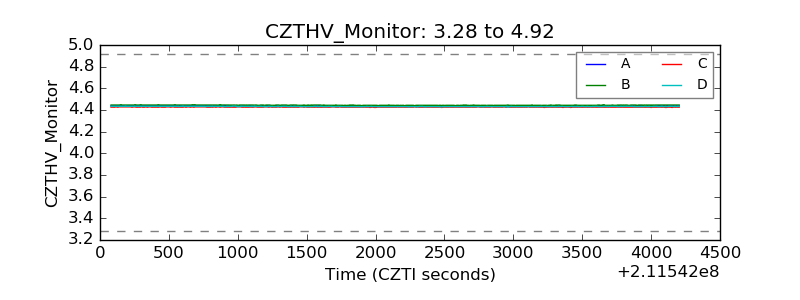 |
| D_VDD | 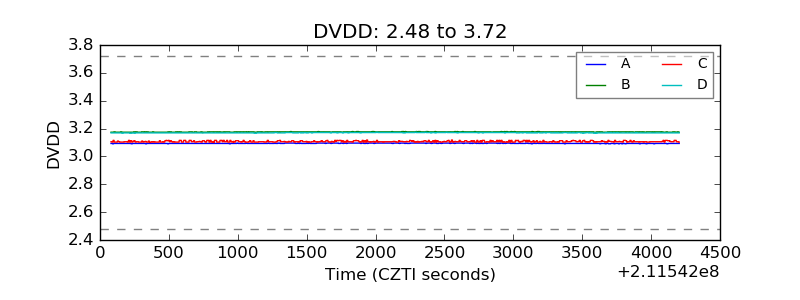 |
| Temperature 1 |  |
| Veto HV Monitor | 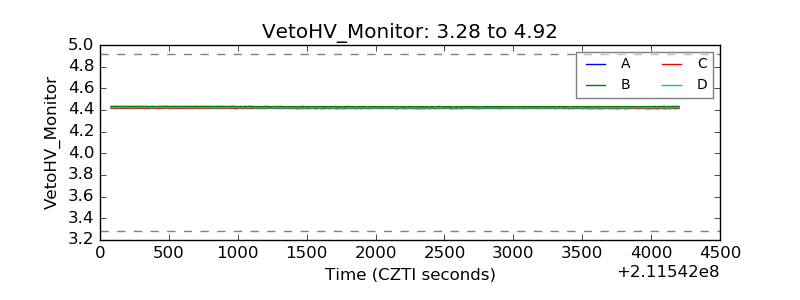 |
| Veto LLD | 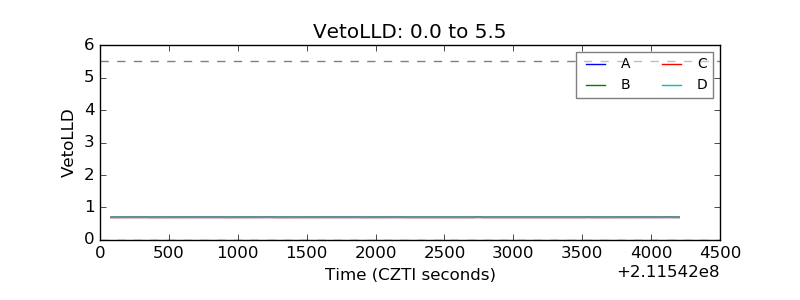 |
| Alpha Counter | 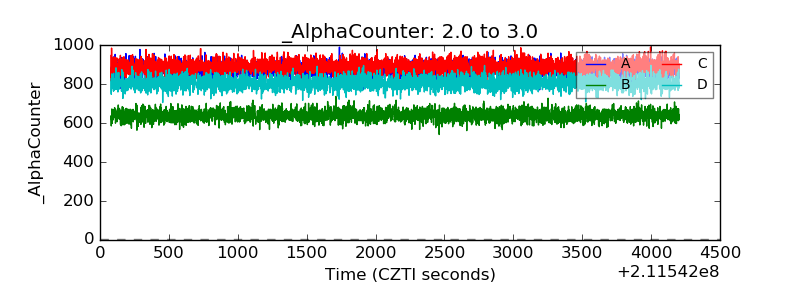 |
| _CPM_Rate | 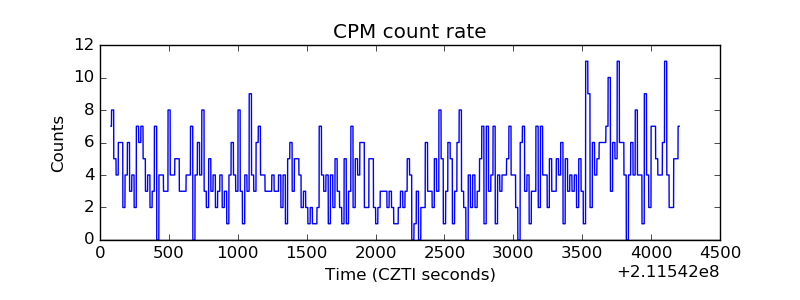 |
| CZT Counter | 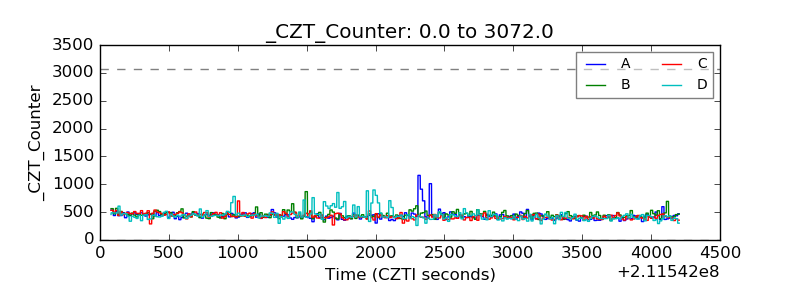 |
| +2.5 Volts monitor |  |
| +5 Volts monitor |  |
| _ROLL_ROT | 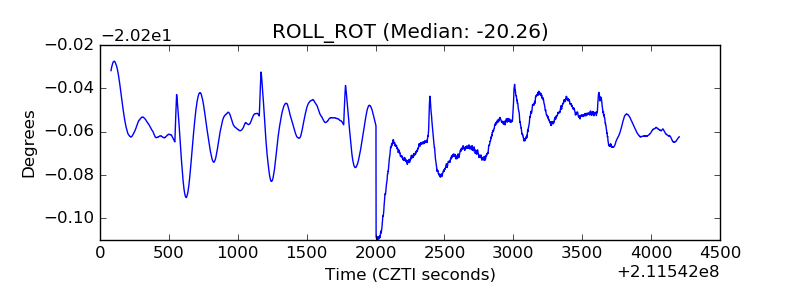 |
| _Roll_DEC | 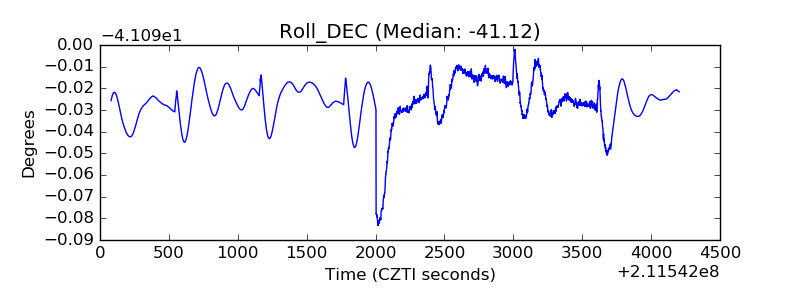 |
| _Roll_RA | 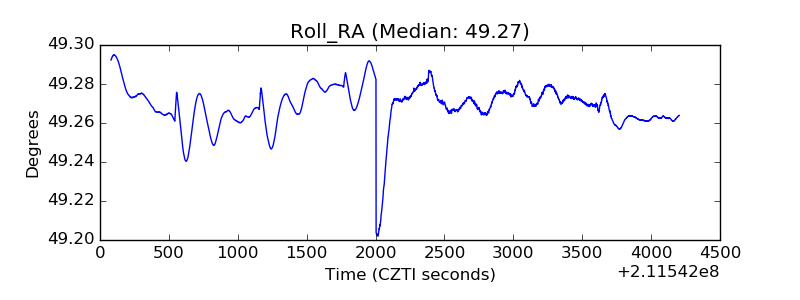 |
| Veto Counter | 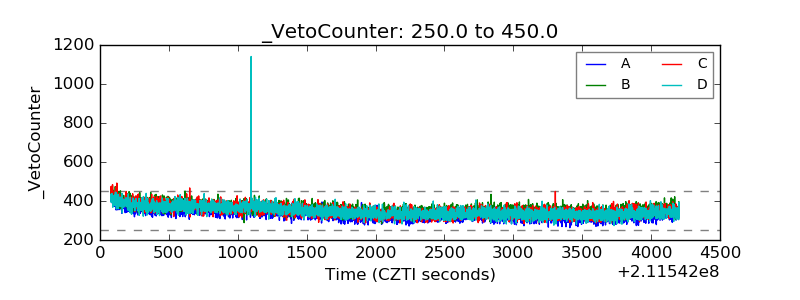 |