| Param | Original file | Final file |
|---|---|---|
| Filename | modeM0/AS1C01_015T01_9000000668cztM0_level2.fits | modeM0/AS1C01_015T01_9000000668cztM0_level2_quad_clean.evt |
| Size (bytes) | 852,223,680 | 799,577,280 |
| Size | 812.7 MB | 762.5 MB |
| Events in quadrant A | 5,205,470 | 4,772,880 |
| Events in quadrant B | 5,047,846 | 4,767,192 |
| Events in quadrant C | 5,094,852 | 4,527,563 |
| Events in quadrant D | 3,962,948 | 3,656,393 |
| Mode SS | |||
|---|---|---|---|
| Quadrant | BADHDUFLAG | Total packets | Discarded packets |
| A | 0 | 1930 | 0 |
| B | 0 | 1930 | 0 |
| C | 0 | 1930 | 0 |
| D | 0 | 1930 | 0 |
| Mode M9 | |||
|---|---|---|---|
| Quadrant | BADHDUFLAG | Total packets | Discarded packets |
| A | 0 | 143 | 0 |
| B | 0 | 143 | 0 |
| C | 0 | 143 | 0 |
| D | 0 | 143 | 0 |
| Mode M0 | |||
|---|---|---|---|
| Quadrant | BADHDUFLAG | Total packets | Discarded packets |
| A | 0 | 194083 | 0 |
| B | 0 | 194931 | 0 |
| C | 0 | 195203 | 0 |
| D | 0 | 344848 | 0 |
| Quadrant | Total seconds | Saturated seconds | Saturation percentage |
|---|---|---|---|
| A | 94685 | 1163 | 1.228283% |
| B | 94683 | 1222 | 1.290622% |
| C | 94685 | 907 | 0.957913% |
| D | 94683 | 17240 | 18.208126% |
Noise dominated data is calculated using 1-second bins in cleaned event files. If a bin has >2000 counts, and if more than 50% of those come from <1% of pixels, then it is considered to be noise-dominated and hence unusable.
| Quadrant | # 1 sec bins | Bins with >0 counts | Bins with >2000 counts | High rate bins dominated by noise | Noise dominated (total time) | Noise dominated (detector-on time) | Marked lightcurve |
|---|---|---|---|---|---|---|---|
| A | 109064 | 94687 | 0 | 0 | 0.00% | 0.00% |  |
| B | 109064 | 94687 | 0 | 0 | 0.00% | 0.00% |  |
| C | 109064 | 94688 | 0 | 0 | 0.00% | 0.00% | 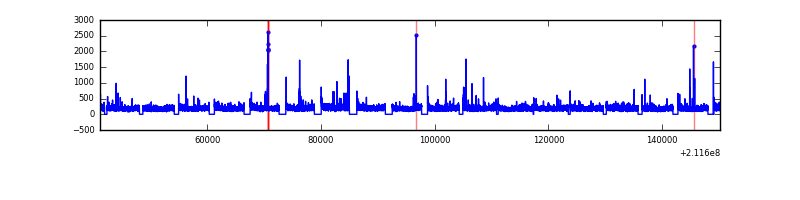 |
| D | 109064 | 93990 | 0 | 0 | 0.00% | 0.00% |  |
Top three noisy pixels from each quadrant. If the there are fewer than three noisy pixels in the level2.evt file, extra rows are filled as -1
| Pixel properties | Quadrant properties | ||||||
|---|---|---|---|---|---|---|---|
| Quadrant | DetID | PixID | Counts | Sigma | Mean | Median | Sigma |
| A | 14 | 188 | 5084 | 10.99 | 1348 | 1250 | 348.9 |
| A | 0 | 29 | 5014 | 10.79 | 1348 | 1250 | 348.9 |
| A | 14 | 204 | 4486 | 9.27 | 1348 | 1250 | 348.9 |
| B | 2 | 9 | 4382 | 11.46 | 1327 | 1253 | 273.1 |
| B | 12 | 226 | 3483 | 8.17 | 1327 | 1253 | 273.1 |
| B | 14 | 254 | 3427 | 7.96 | 1327 | 1253 | 273.1 |
| C | 1 | 80 | 3573 | 6.49 | 1346 | 1238 | 359.6 |
| C | 1 | 81 | 3508 | 6.31 | 1346 | 1238 | 359.6 |
| C | 2 | 191 | 3357 | 5.89 | 1346 | 1238 | 359.6 |
| D | 3 | 14 | 3173 | 7.16 | 1127 | 1020 | 300.8 |
| D | 1 | 19 | 2946 | 6.4 | 1127 | 1020 | 300.8 |
| D | 1 | 3 | 2930 | 6.35 | 1127 | 1020 | 300.8 |
Histogram calculated using DETX and DETY for each event in the final _common_clean file
| Quadrant A |  |
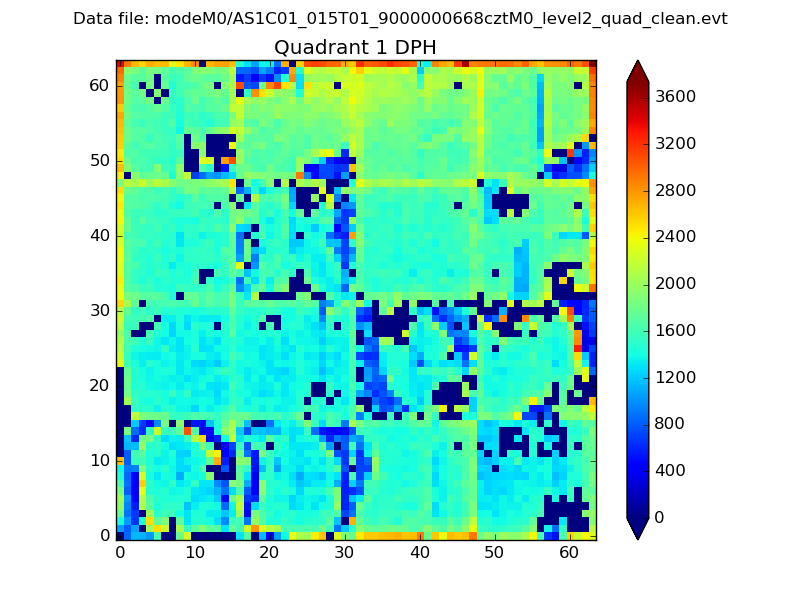 |
Quadrant B |
|---|---|---|---|
| Quadrant D |  |
 |
Quadrant C |
| Plot type | Count rate plots | Images |
|---|---|---|
| Comparison with Poisson distribution Blue bars denote a histogram of data divided into 1 sec bins. Red curve is a Poisson curve with rate = median count rate of data. |
 |
 |
| Quadrant-wise count rates Data is divided into 100 sec bins |
 |
|
| Module-wise count rates for Quadrant A Data is divided into 100 sec bins |
 |
 |
| Module-wise count rates for Quadrant B Data is divided into 100 sec bins |
 |
 |
| Module-wise count rates for Quadrant C Data is divided into 100 sec bins |
 |
 |
| Module-wise count rates for Quadrant D Data is divided into 100 sec bins |
 |
 |
| Parameter | Plot |
|---|---|
| CZT HV Monitor |  |
| D_VDD | 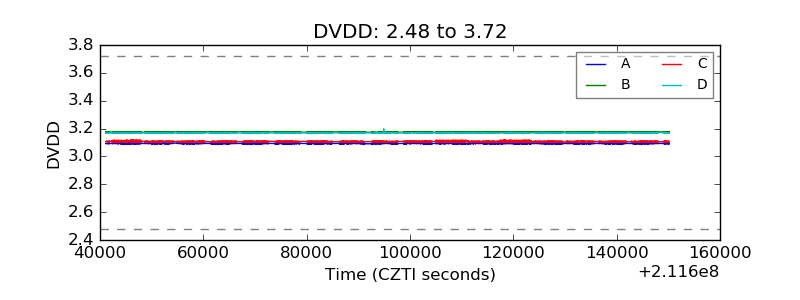 |
| Temperature 1 |  |
| Veto HV Monitor |  |
| Veto LLD |  |
| Alpha Counter |  |
| _CPM_Rate |  |
| CZT Counter |  |
| +2.5 Volts monitor |  |
| +5 Volts monitor |  |
| _ROLL_ROT |  |
| _Roll_DEC |  |
| _Roll_RA |  |
| Veto Counter |  |