| Param | Original file | Final file |
|---|---|---|
| Filename | modeM0/AS1C01_015T01_9000000668_05234cztM0_level2.evt | modeM0/AS1C01_015T01_9000000668_05234cztM0_level2_quad_clean.evt |
| Size (bytes) | 728,398,080 | 84,689,280 |
| Size | 694.7 MB | 80.8 MB |
| Events in quadrant A | 3,522,735 | 539,204 |
| Events in quadrant B | 3,556,024 | 540,867 |
| Events in quadrant C | 3,551,974 | 532,585 |
| Events in quadrant D | 10,916,467 | 424,689 |
| Mode SS | |||
|---|---|---|---|
| Quadrant | BADHDUFLAG | Total packets | Discarded packets |
| A | 0 | 156 | 0 |
| B | 0 | 156 | 0 |
| C | 0 | 156 | 0 |
| D | 0 | 156 | 0 |
| Mode M9 | |||
|---|---|---|---|
| Quadrant | BADHDUFLAG | Total packets | Discarded packets |
| A | 0 | 13 | 0 |
| B | 0 | 12 | 0 |
| C | 0 | 12 | 0 |
| D | 0 | 13 | 0 |
| Mode M0 | |||
|---|---|---|---|
| Quadrant | BADHDUFLAG | Total packets | Discarded packets |
| A | 0 | 15667 | 2 |
| B | 0 | 15630 | 2 |
| C | 0 | 15690 | 2 |
| D | 0 | 37571 | 12 |
| Quadrant | Total seconds | Saturated seconds | Saturation percentage |
|---|---|---|---|
| A | 7563 | 115 | 1.520561% |
| B | 7563 | 108 | 1.428005% |
| C | 7563 | 98 | 1.295782% |
| D | 7561 | 2583 | 34.162148% |
Noise dominated data is calculated using 1-second bins in cleaned event files. If a bin has >2000 counts, and if more than 50% of those come from <1% of pixels, then it is considered to be noise-dominated and hence unusable.
| Quadrant | # 1 sec bins | Bins with >0 counts | Bins with >2000 counts | High rate bins dominated by noise | Noise dominated (total time) | Noise dominated (detector-on time) | Marked lightcurve |
|---|---|---|---|---|---|---|---|
| A | 21523 | 7565 | 12 | 12 | 0.06% | 0.16% | 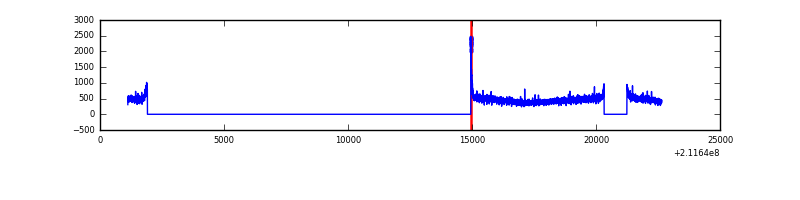 |
| B | 21523 | 7565 | 0 | 0 | 0.00% | 0.00% | 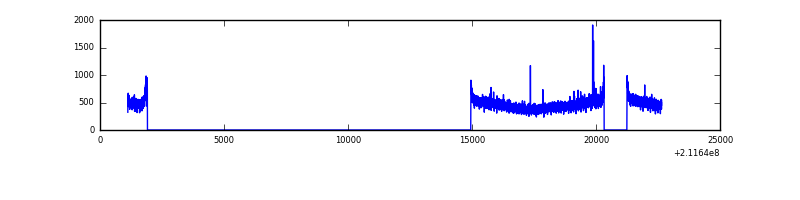 |
| C | 21523 | 7565 | 0 | 0 | 0.00% | 0.00% | 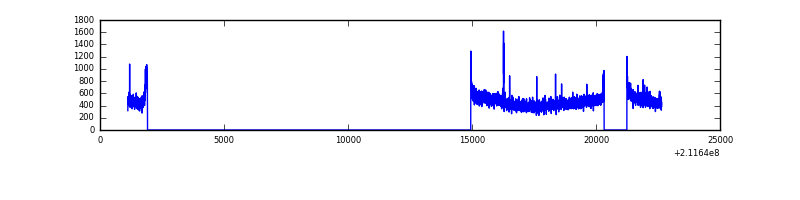 |
| D | 21522 | 7564 | 2238 | 2238 | 10.40% | 29.59% | 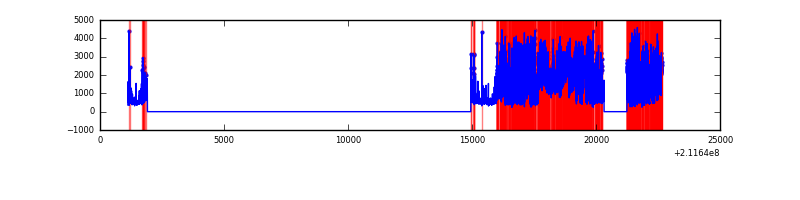 |
Top three noisy pixels from each quadrant. If the there are fewer than three noisy pixels in the level2.evt file, extra rows are filled as -1
| Pixel properties | Quadrant properties | ||||||
|---|---|---|---|---|---|---|---|
| Quadrant | DetID | PixID | Counts | Sigma | Mean | Median | Sigma |
| A | 0 | 247 | 51124 | 270.19 | 901 | 878 | 186.0 |
| A | 0 | 226 | 13298 | 66.79 | 901 | 878 | 186.0 |
| A | 12 | 194 | 8933 | 43.31 | 901 | 878 | 186.0 |
| B | 12 | 111 | 17156 | 91.03 | 912 | 888 | 178.7 |
| B | 11 | 111 | 13701 | 71.69 | 912 | 888 | 178.7 |
| B | 0 | 219 | 9884 | 50.34 | 912 | 888 | 178.7 |
| C | 1 | 16 | 86201 | 413.35 | 882 | 886 | 206.4 |
| C | 12 | 4 | 16483 | 75.57 | 882 | 886 | 206.4 |
| C | 14 | 67 | 8772 | 38.21 | 882 | 886 | 206.4 |
| D | 11 | 145 | 5430953 | 29350.18 | 752 | 729 | 185.0 |
| D | 2 | 206 | 1007683 | 5442.55 | 752 | 729 | 185.0 |
| D | 12 | 212 | 717028 | 3871.57 | 752 | 729 | 185.0 |
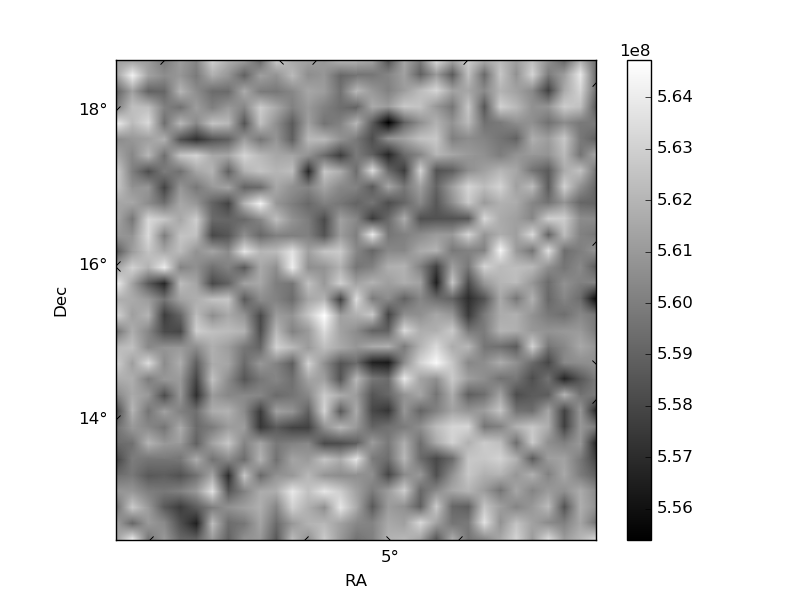
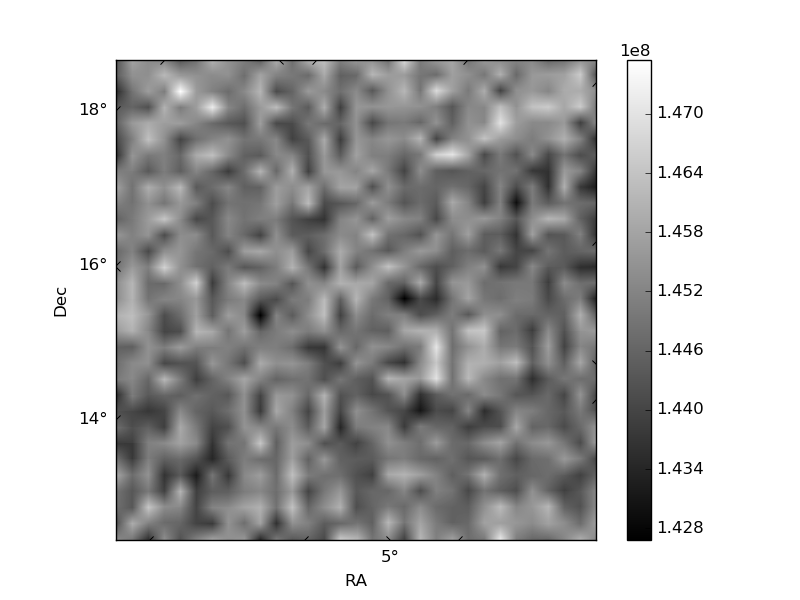
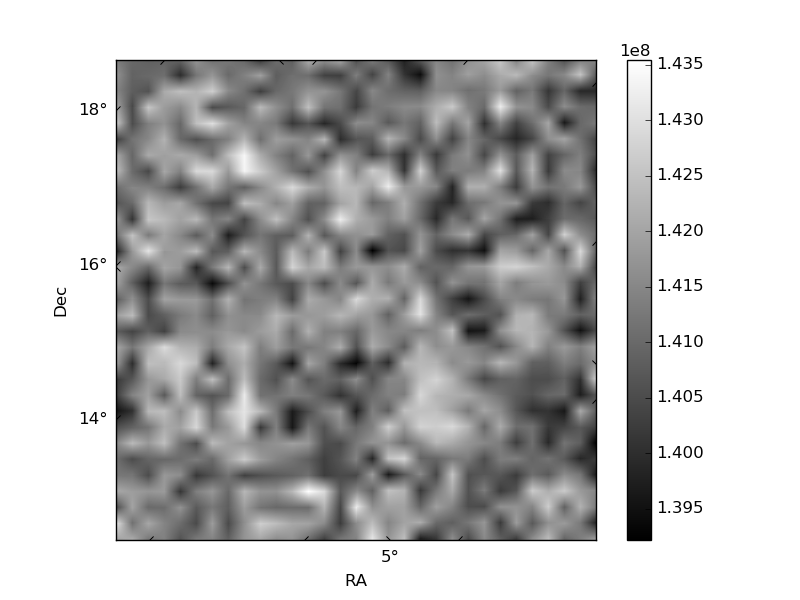
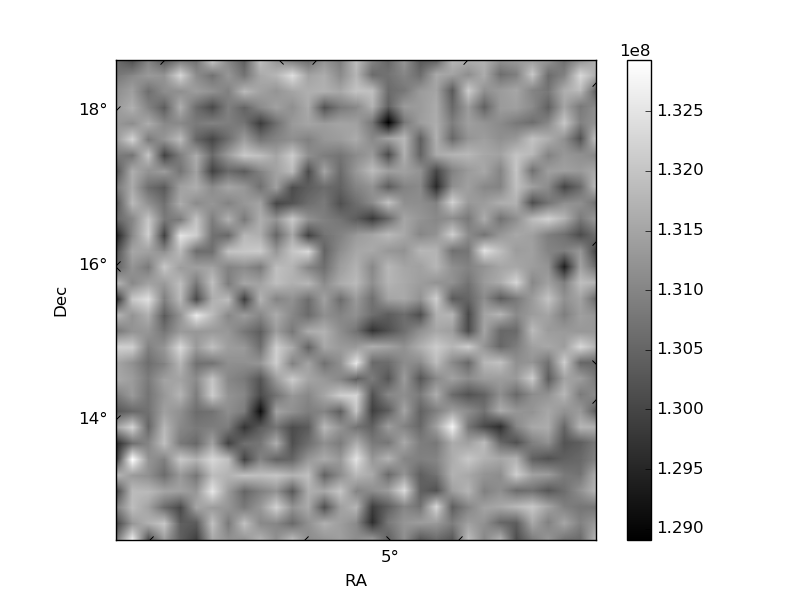
Histogram calculated using DETX and DETY for each event in the final _common_clean file
| Quadrant A | 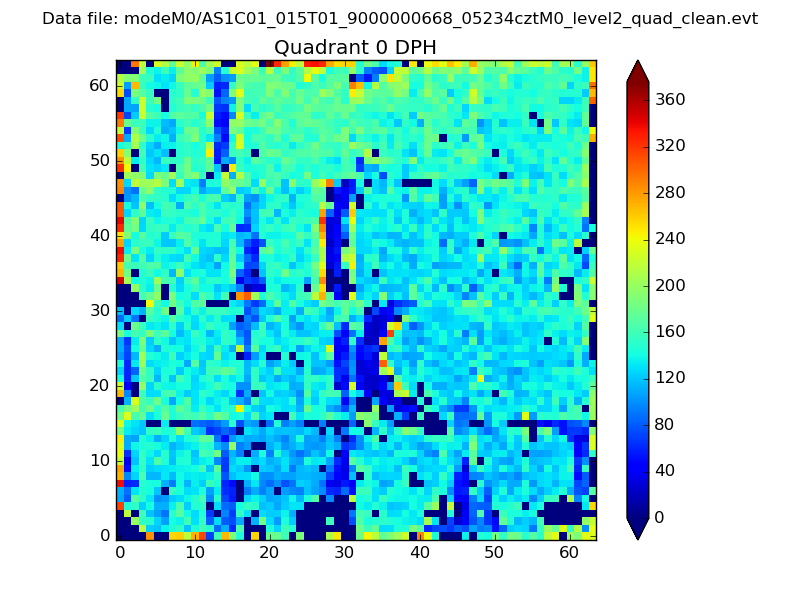 |
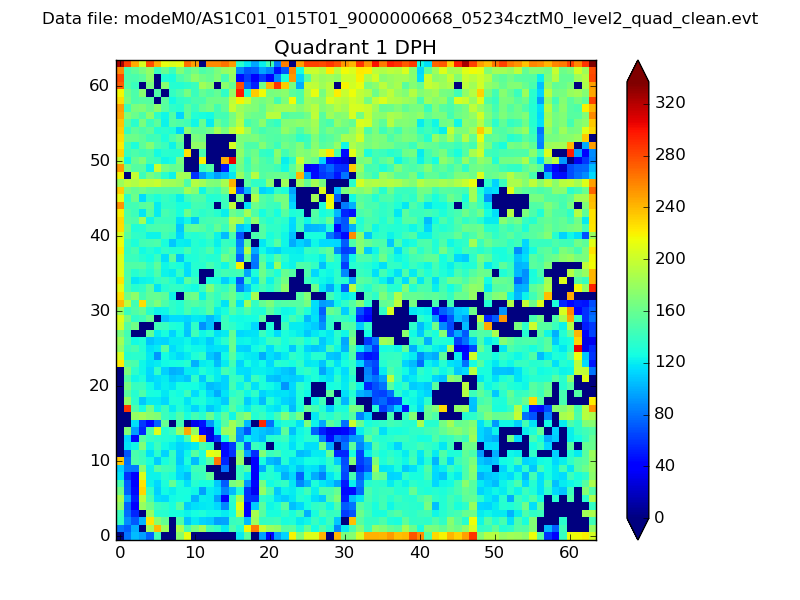 |
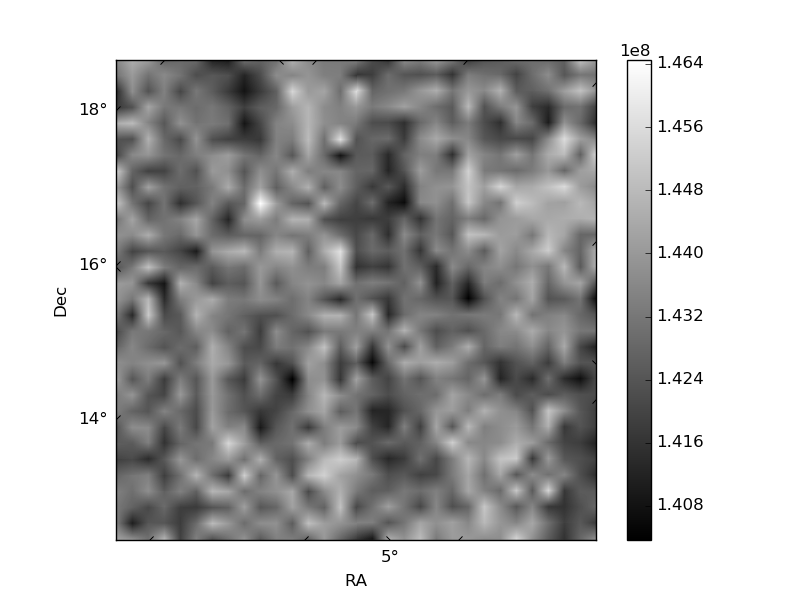
Quadrant B |
|---|---|---|---|
| Quadrant D | 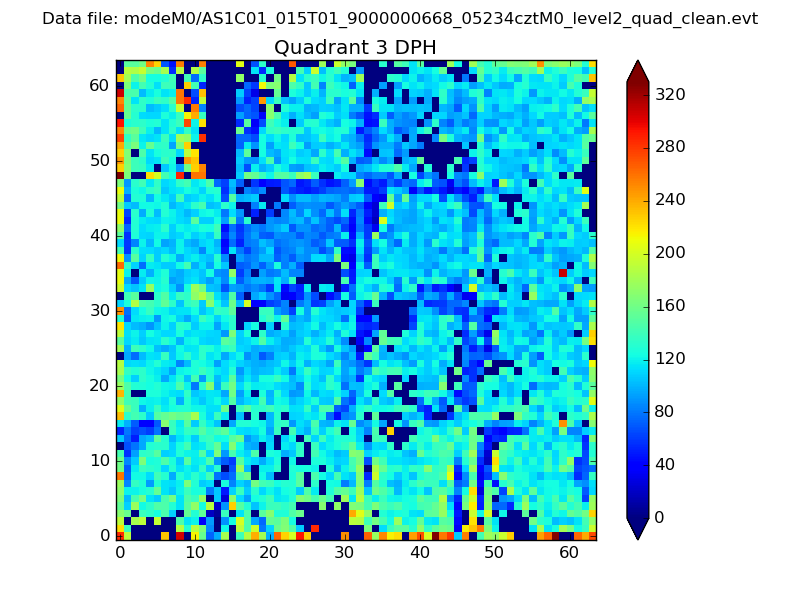 |
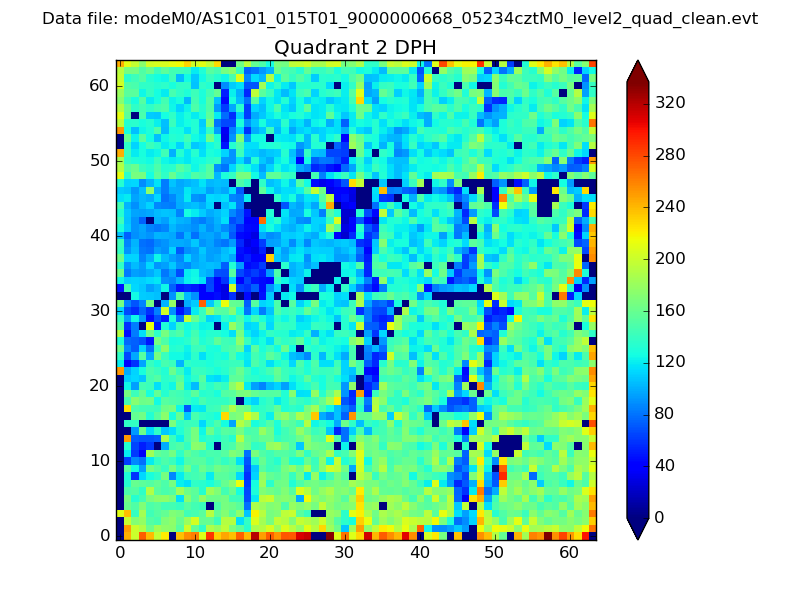 |
Quadrant C |
| Plot type | Count rate plots | Images |
|---|---|---|
| Comparison with Poisson distribution Blue bars denote a histogram of data divided into 1 sec bins. Red curve is a Poisson curve with rate = median count rate of data. |
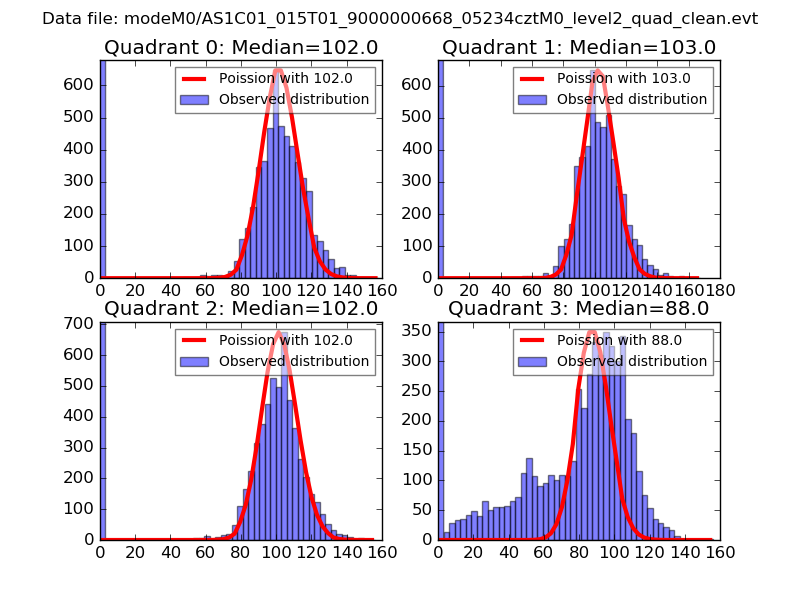 |
 |
| Quadrant-wise count rates Data is divided into 100 sec bins |
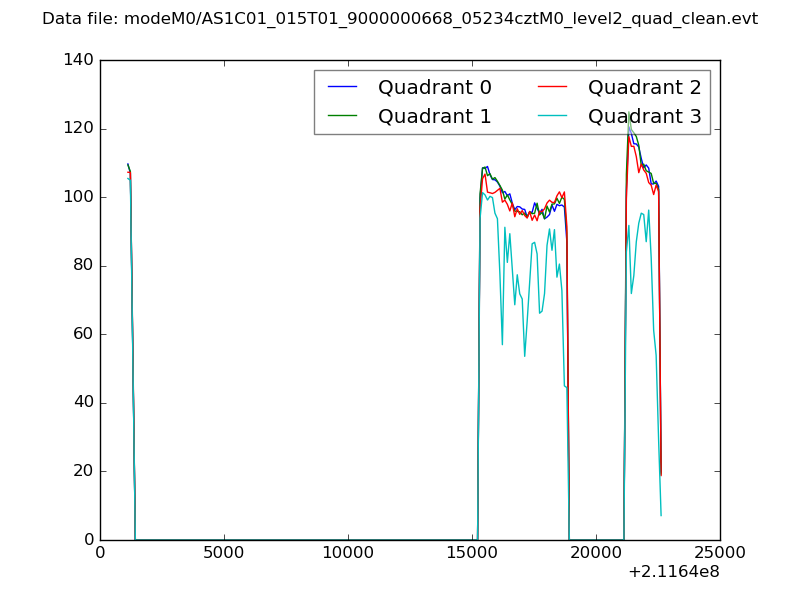 |
|
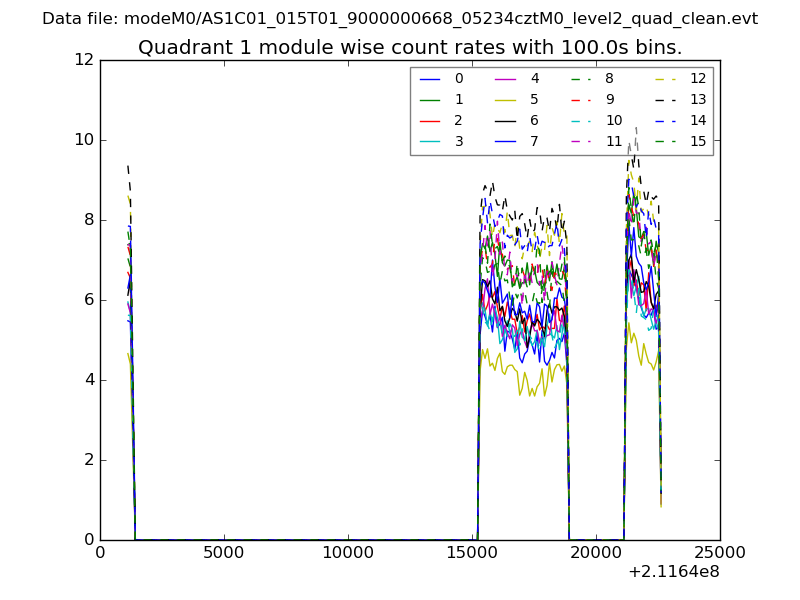
| Module-wise count rates for Quadrant A Data is divided into 100 sec bins |
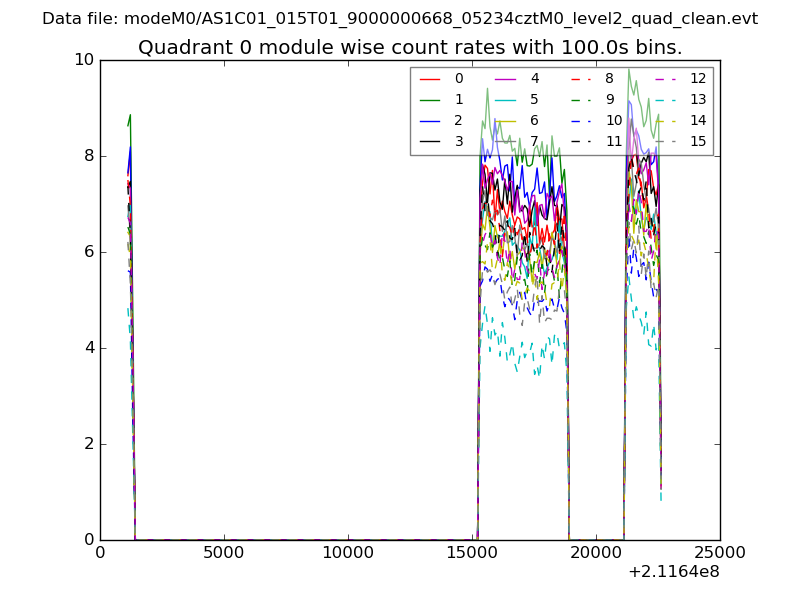 |
 |
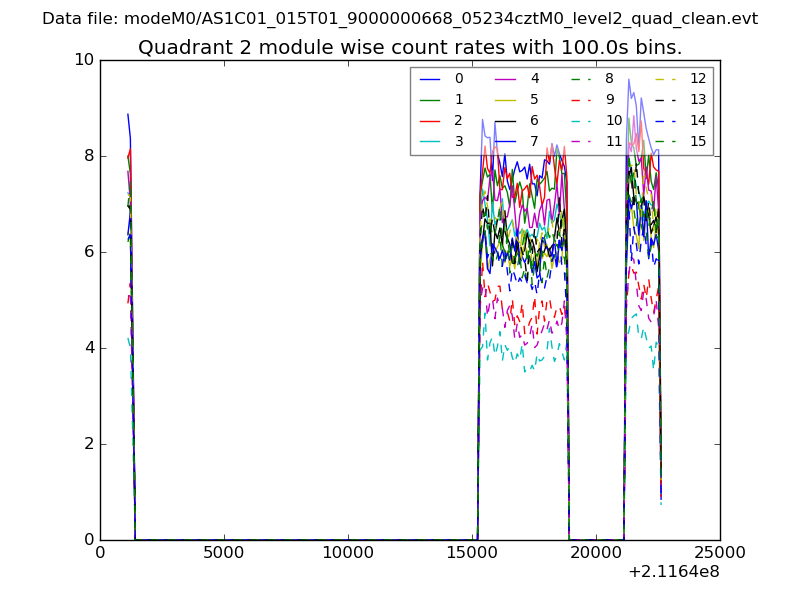
| Module-wise count rates for Quadrant B Data is divided into 100 sec bins |
 |
 |
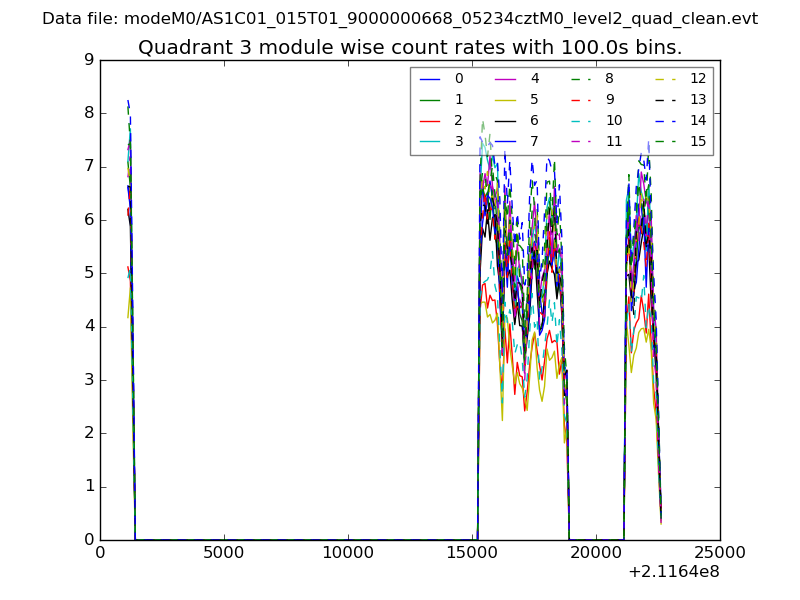
| Module-wise count rates for Quadrant C Data is divided into 100 sec bins |
 |
 |
| Module-wise count rates for Quadrant D Data is divided into 100 sec bins |
 |
 |
| Parameter | Plot |
|---|---|
| CZT HV Monitor | 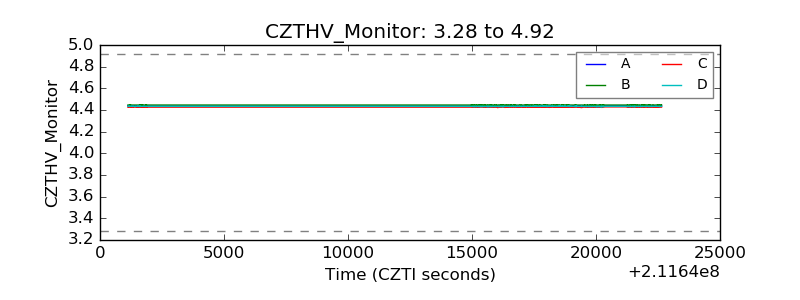 |
| D_VDD | 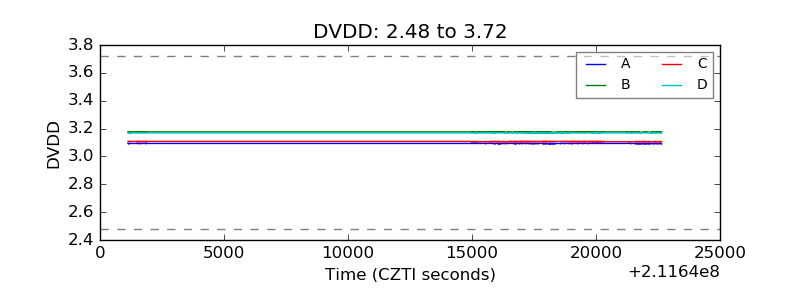 |
| Temperature 1 |  |
| Veto HV Monitor | 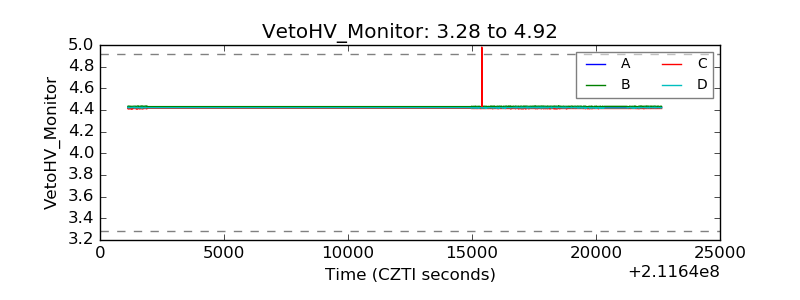 |
| Veto LLD | 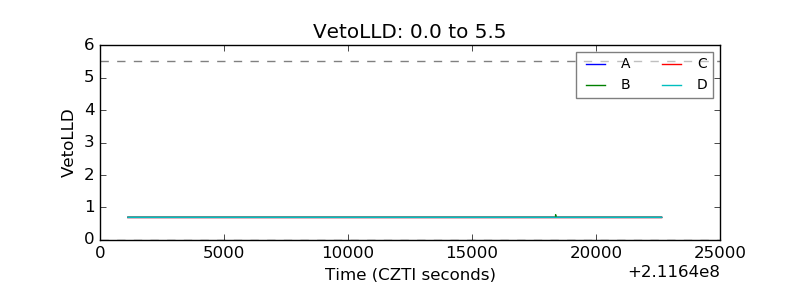 |
| Alpha Counter | 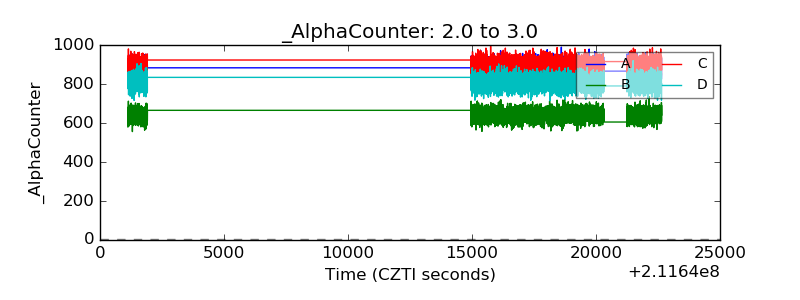 |
| _CPM_Rate | 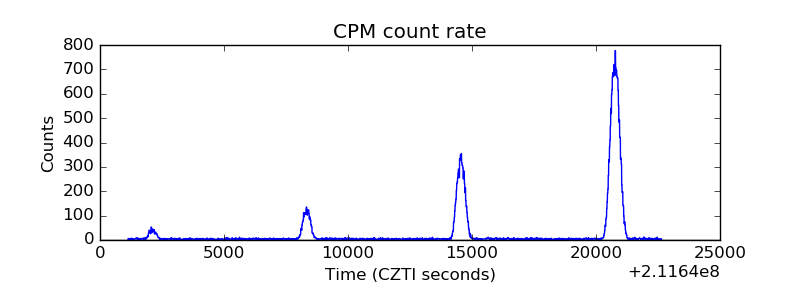 |
| CZT Counter | 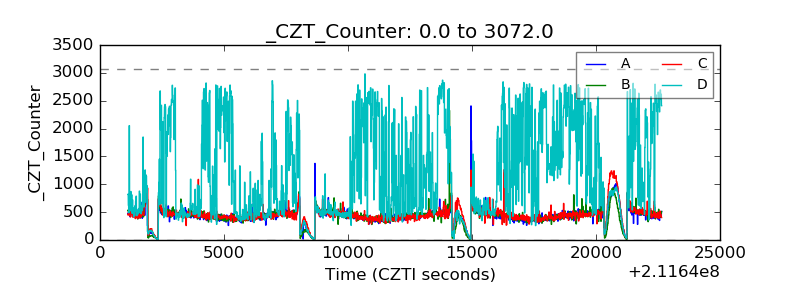 |
| +2.5 Volts monitor |  |
| +5 Volts monitor | 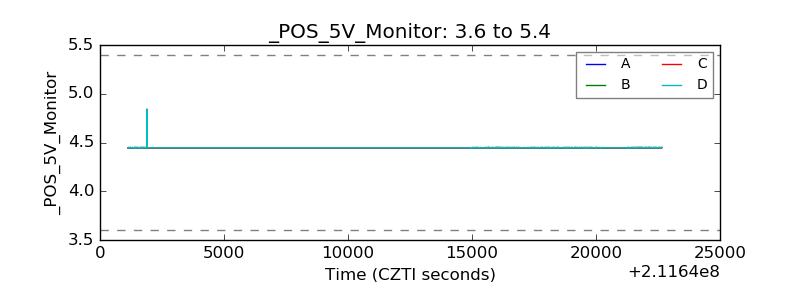 |
| _ROLL_ROT |  |
| _Roll_DEC |  |
| _Roll_RA | 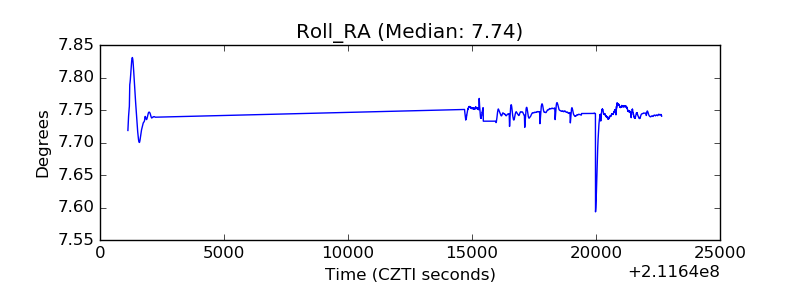 |
| Veto Counter | 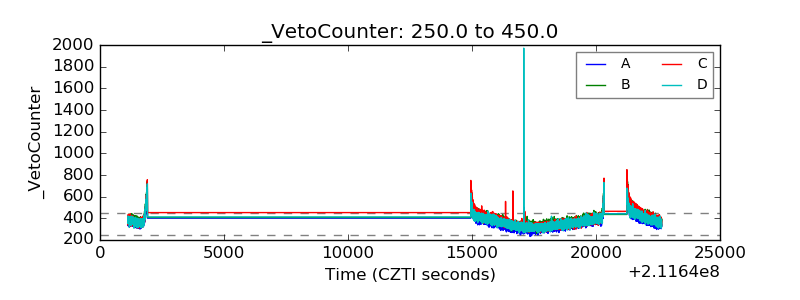 |