| Param | Original file | Final file |
|---|---|---|
| Filename | modeM0/AS1C01_015T01_9000000668_05237cztM0_level2.evt | modeM0/AS1C01_015T01_9000000668_05237cztM0_level2_quad_clean.evt |
| Size (bytes) | 566,752,320 | 74,640,960 |
| Size | 540.5 MB | 71.2 MB |
| Events in quadrant A | 2,905,005 | 481,395 |
| Events in quadrant B | 2,984,127 | 488,964 |
| Events in quadrant C | 3,070,844 | 480,040 |
| Events in quadrant D | 7,774,872 | 367,684 |
| Mode SS | |||
|---|---|---|---|
| Quadrant | BADHDUFLAG | Total packets | Discarded packets |
| A | 0 | 128 | 0 |
| B | 0 | 128 | 0 |
| C | 0 | 128 | 0 |
| D | 0 | 128 | 0 |
| Mode M9 | |||
|---|---|---|---|
| Quadrant | BADHDUFLAG | Total packets | Discarded packets |
| A | 0 | 13 | 0 |
| B | 0 | 13 | 0 |
| C | 0 | 13 | 0 |
| D | 0 | 14 | 0 |
| Mode M0 | |||
|---|---|---|---|
| Quadrant | BADHDUFLAG | Total packets | Discarded packets |
| A | 0 | 12941 | 3 |
| B | 0 | 13088 | 2 |
| C | 0 | 13375 | 2 |
| D | 0 | 27541 | 2 |
| Quadrant | Total seconds | Saturated seconds | Saturation percentage |
|---|---|---|---|
| A | 6326 | 18 | 0.284540% |
| B | 6326 | 21 | 0.331963% |
| C | 6326 | 16 | 0.252924% |
| D | 6326 | 1856 | 29.339235% |
Noise dominated data is calculated using 1-second bins in cleaned event files. If a bin has >2000 counts, and if more than 50% of those come from <1% of pixels, then it is considered to be noise-dominated and hence unusable.
| Quadrant | # 1 sec bins | Bins with >0 counts | Bins with >2000 counts | High rate bins dominated by noise | Noise dominated (total time) | Noise dominated (detector-on time) | Marked lightcurve |
|---|---|---|---|---|---|---|---|
| A | 7526 | 6327 | 0 | 0 | 0.00% | 0.00% | 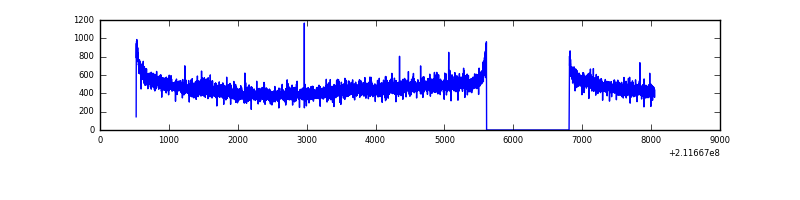 |
| B | 7526 | 6327 | 0 | 0 | 0.00% | 0.00% | 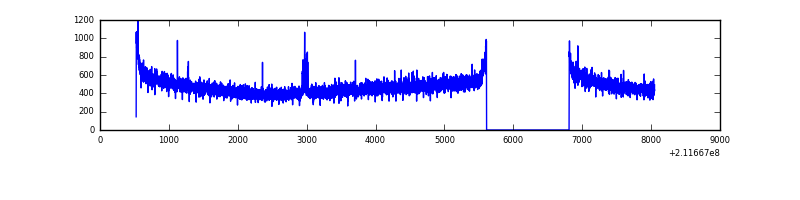 |
| C | 7526 | 6327 | 8 | 8 | 0.11% | 0.13% | 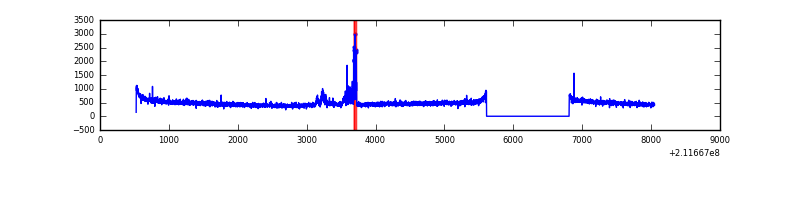 |
| D | 7526 | 6327 | 1504 | 1504 | 19.98% | 23.77% | 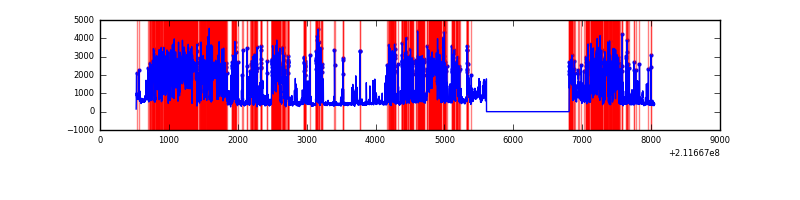 |
Top three noisy pixels from each quadrant. If the there are fewer than three noisy pixels in the level2.evt file, extra rows are filled as -1
| Pixel properties | Quadrant properties | ||||||
|---|---|---|---|---|---|---|---|
| Quadrant | DetID | PixID | Counts | Sigma | Mean | Median | Sigma |
| A | 13 | 251 | 10397 | 62.81 | 753 | 736 | 153.8 |
| A | 12 | 194 | 7280 | 42.54 | 753 | 736 | 153.8 |
| A | 0 | 226 | 7196 | 42.0 | 753 | 736 | 153.8 |
| B | 7 | 252 | 17893 | 117.4 | 763 | 746 | 146.1 |
| B | 12 | 111 | 14053 | 91.11 | 763 | 746 | 146.1 |
| B | 11 | 111 | 11124 | 71.05 | 763 | 746 | 146.1 |
| C | 7 | 159 | 115828 | 673.77 | 737 | 742 | 170.8 |
| C | 1 | 16 | 65887 | 381.39 | 737 | 742 | 170.8 |
| C | 7 | 158 | 11368 | 62.21 | 737 | 742 | 170.8 |
| D | 11 | 145 | 5272282 | 34610.74 | 622 | 603 | 152.3 |
| D | 8 | 195 | 77477 | 504.71 | 622 | 603 | 152.3 |
| D | 2 | 136 | 24474 | 156.72 | 622 | 603 | 152.3 |
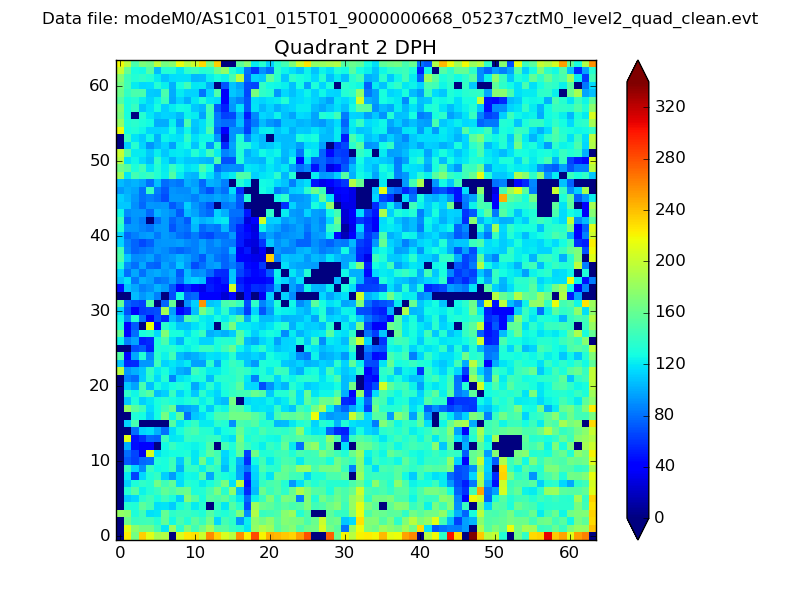
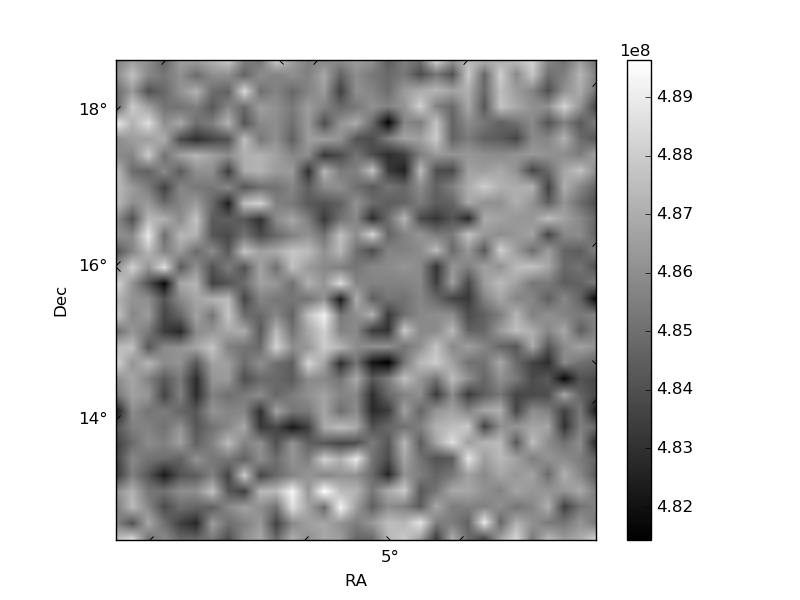
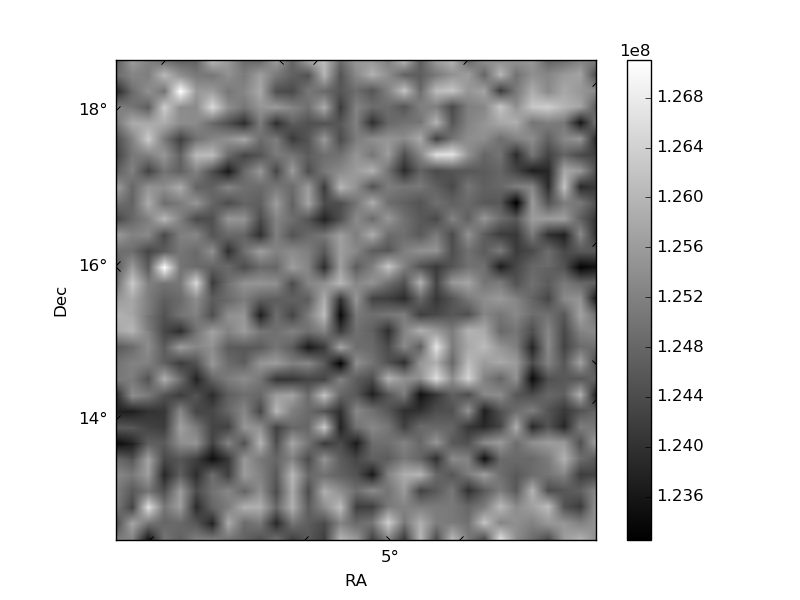
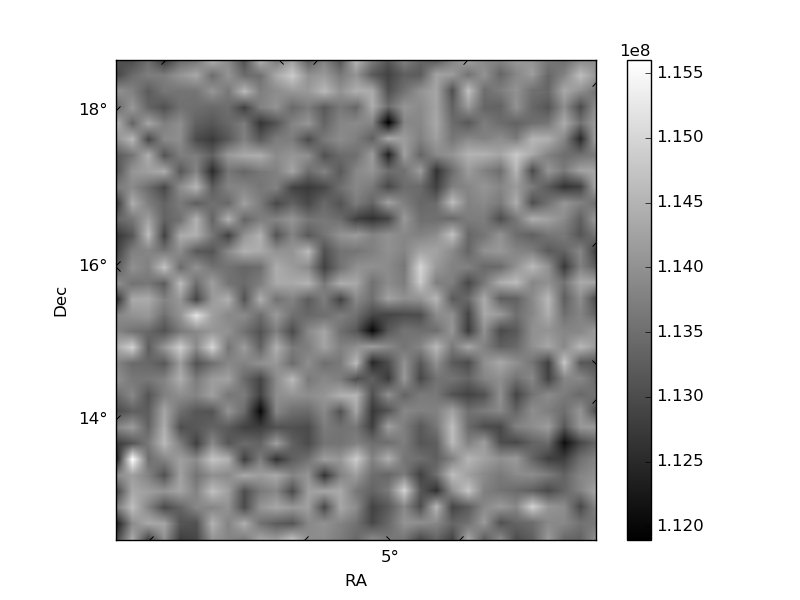
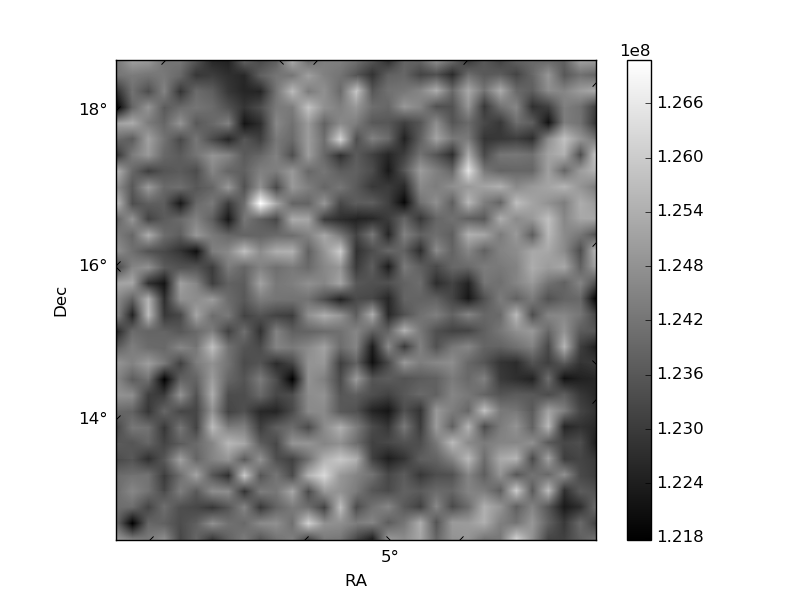
Histogram calculated using DETX and DETY for each event in the final _common_clean file
| Quadrant A | 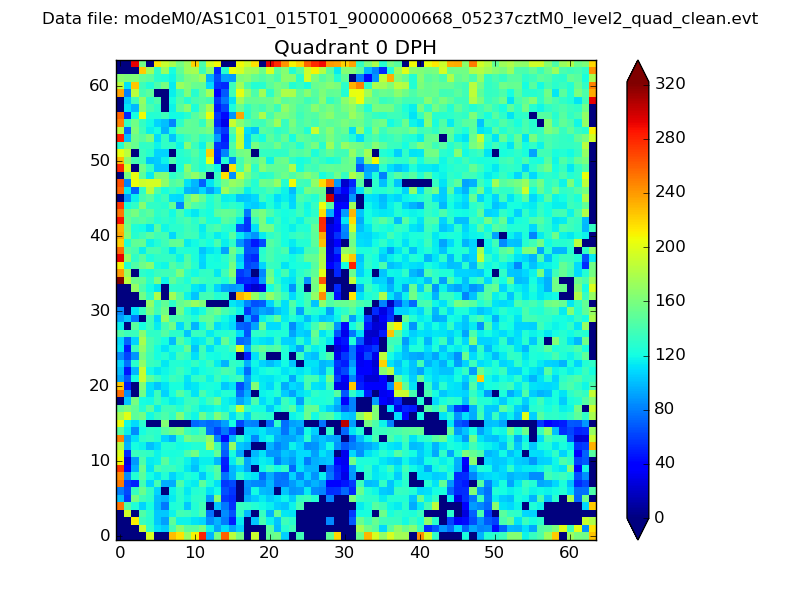 |
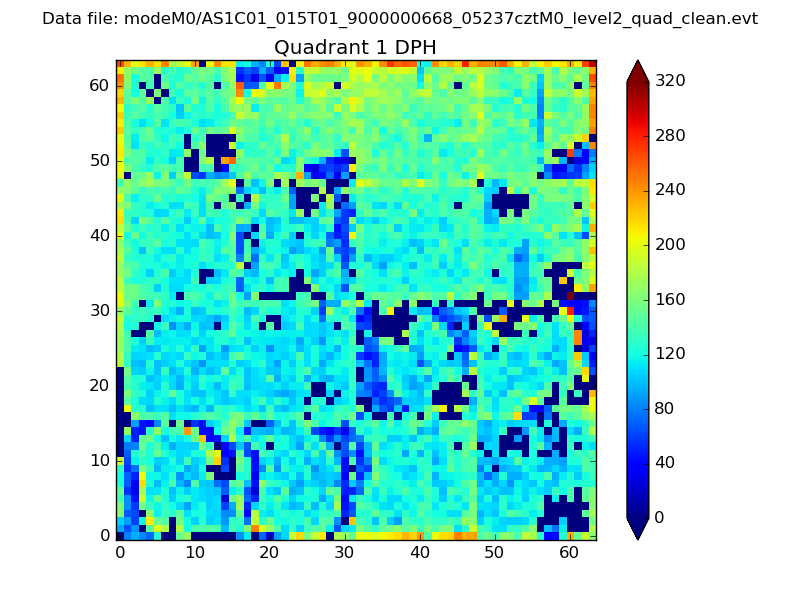 |
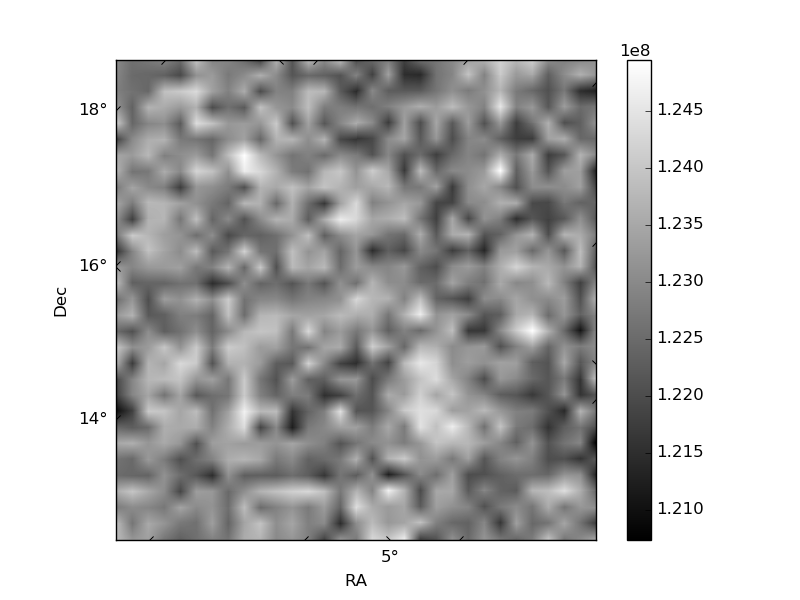
Quadrant B |
|---|---|---|---|
| Quadrant D | 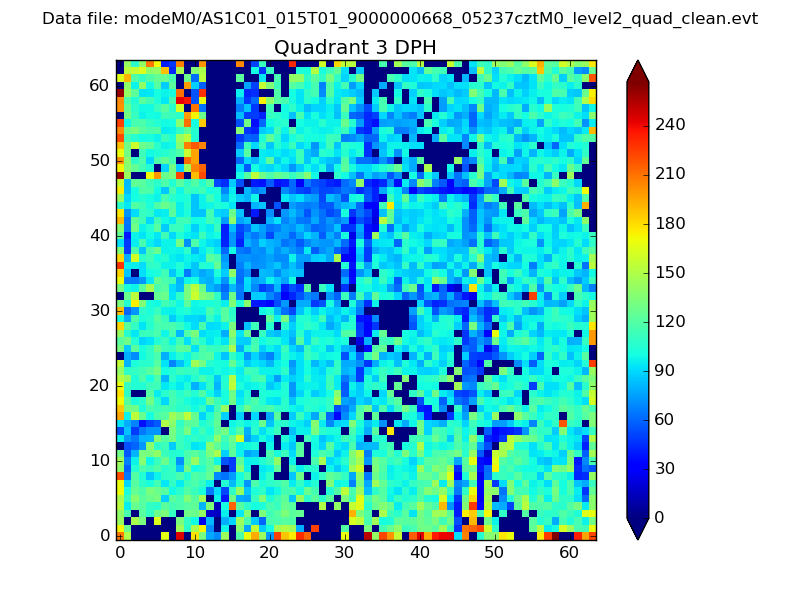 |
 |
Quadrant C |
| Plot type | Count rate plots | Images |
|---|---|---|
| Comparison with Poisson distribution Blue bars denote a histogram of data divided into 1 sec bins. Red curve is a Poisson curve with rate = median count rate of data. |
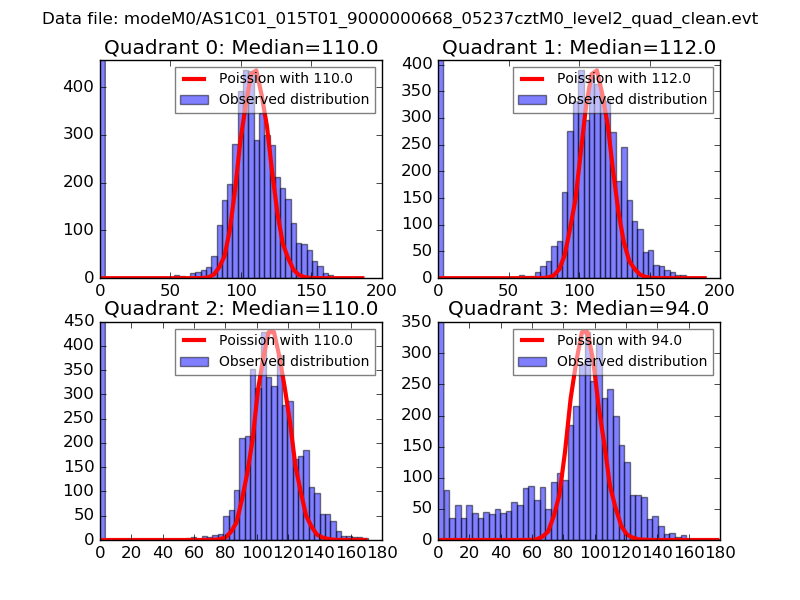 |
 |
| Quadrant-wise count rates Data is divided into 100 sec bins |
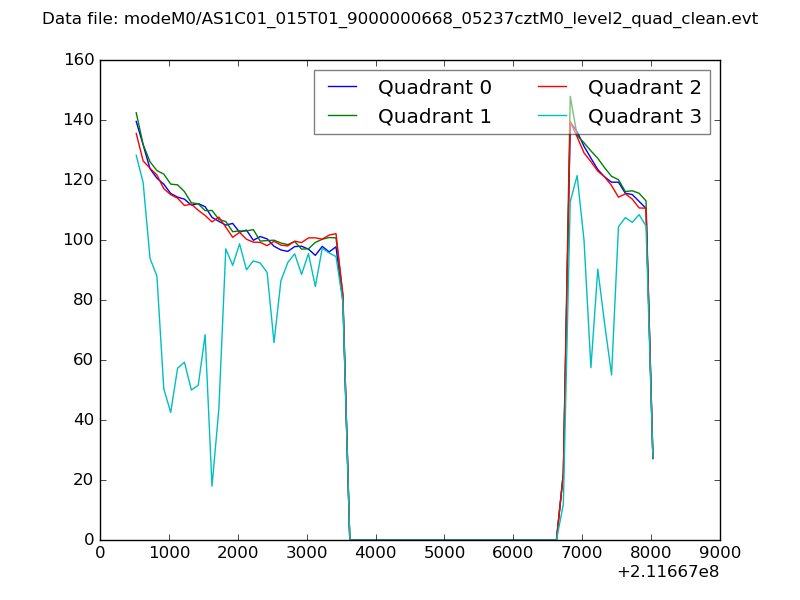 |
|
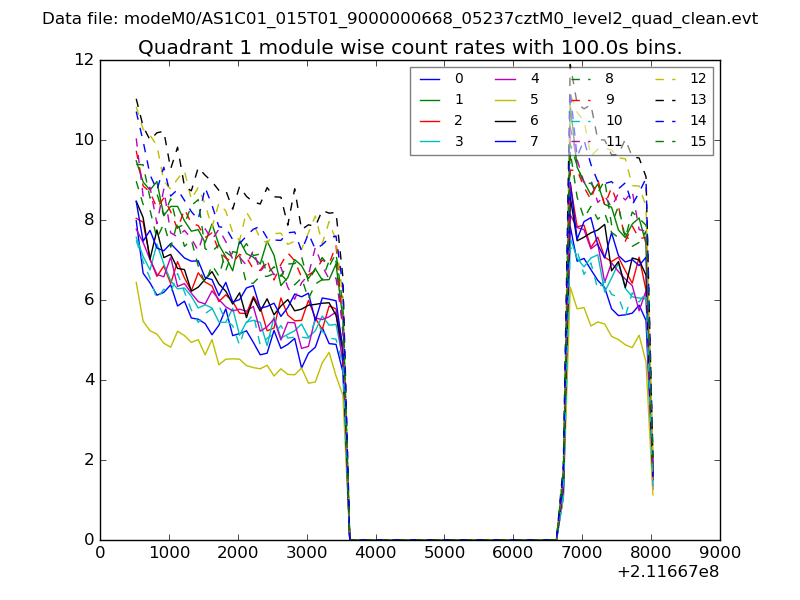
| Module-wise count rates for Quadrant A Data is divided into 100 sec bins |
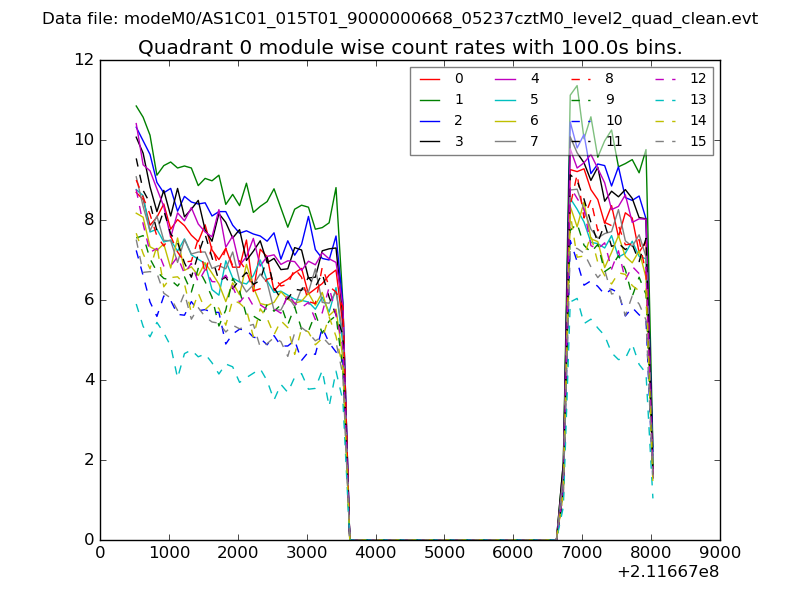 |
 |
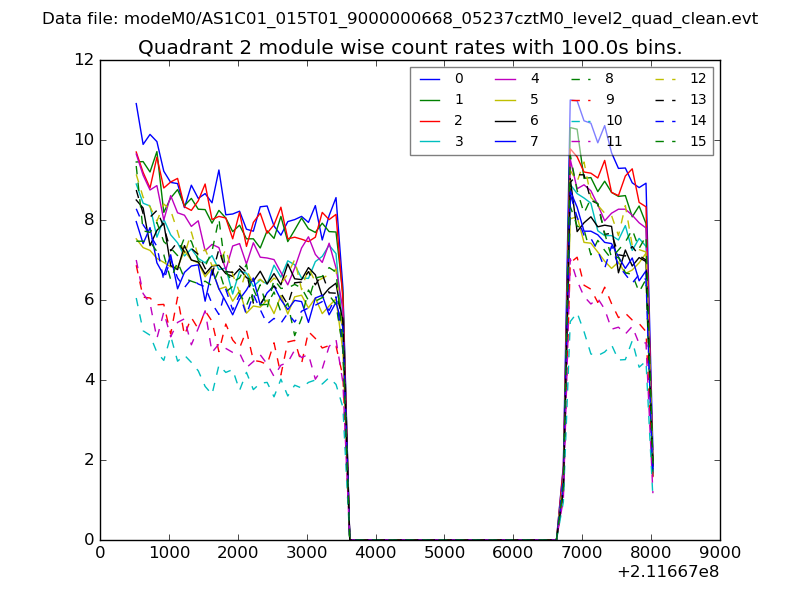
| Module-wise count rates for Quadrant B Data is divided into 100 sec bins |
 |
 |
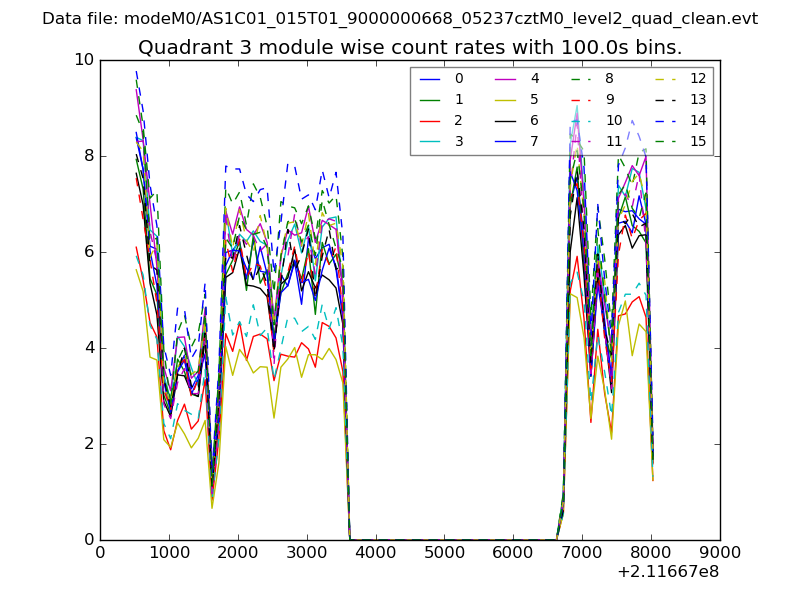
| Module-wise count rates for Quadrant C Data is divided into 100 sec bins |
 |
 |
| Module-wise count rates for Quadrant D Data is divided into 100 sec bins |
 |
 |
| Parameter | Plot |
|---|---|
| CZT HV Monitor | 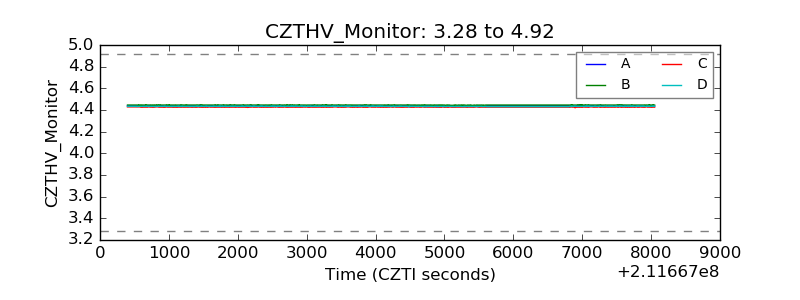 |
| D_VDD | 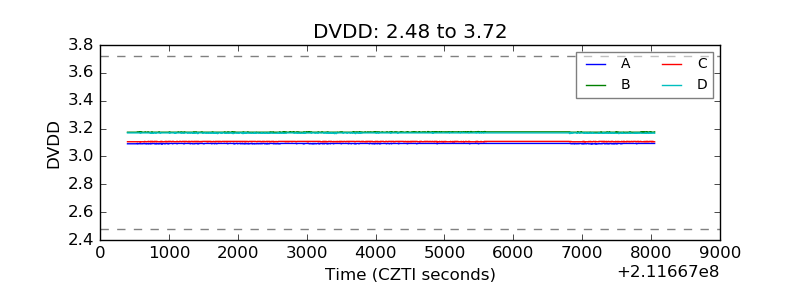 |
| Temperature 1 | 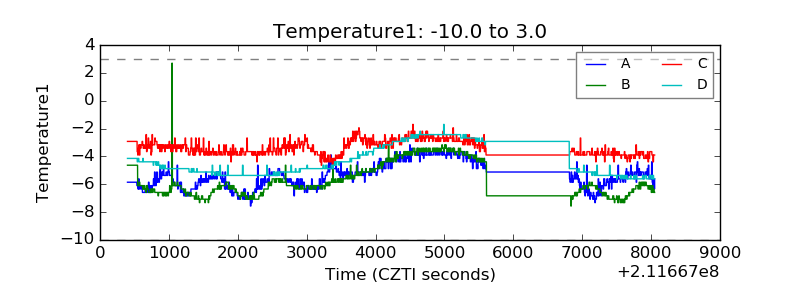 |
| Veto HV Monitor | 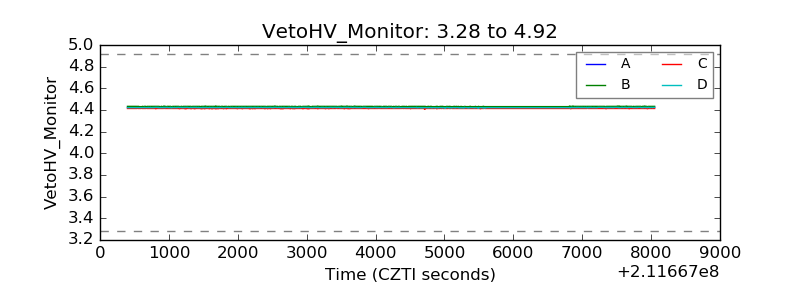 |
| Veto LLD | 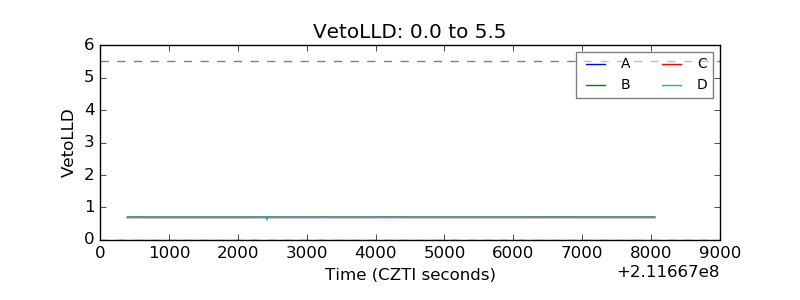 |
| Alpha Counter | 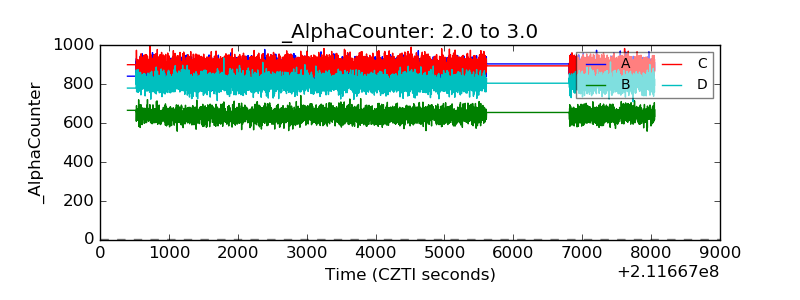 |
| _CPM_Rate | 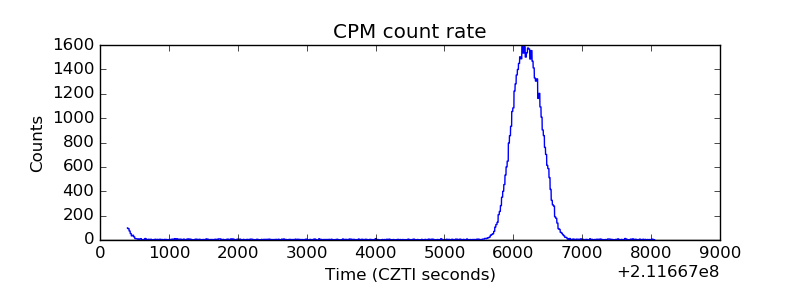 |
| CZT Counter | 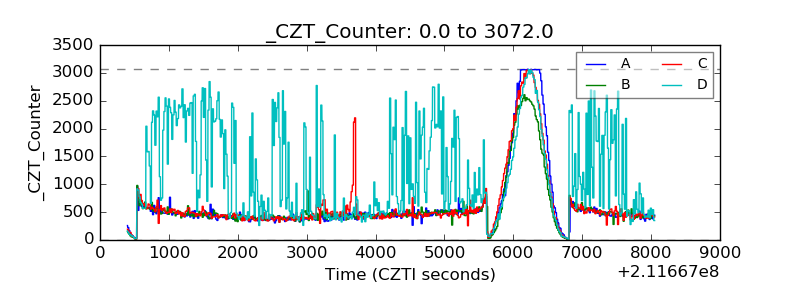 |
| +2.5 Volts monitor | 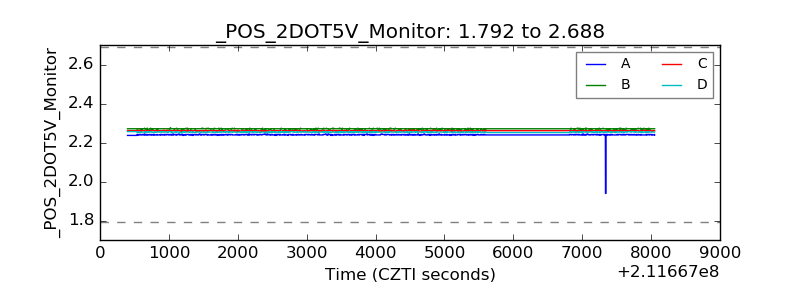 |
| +5 Volts monitor |  |
| _ROLL_ROT | 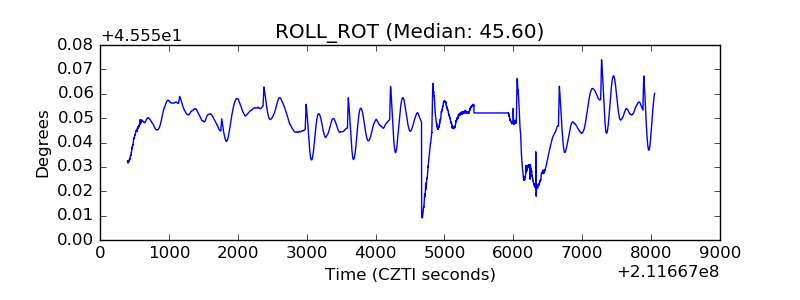 |
| _Roll_DEC | 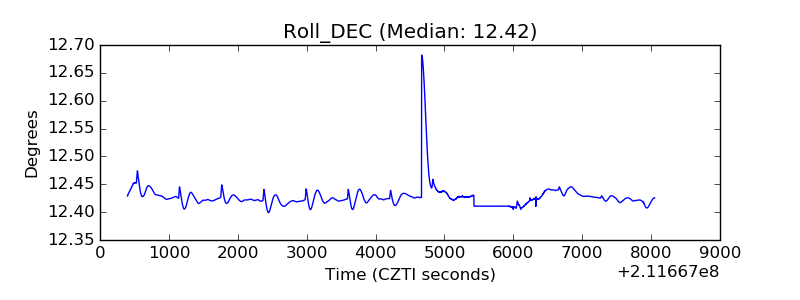 |
| _Roll_RA | 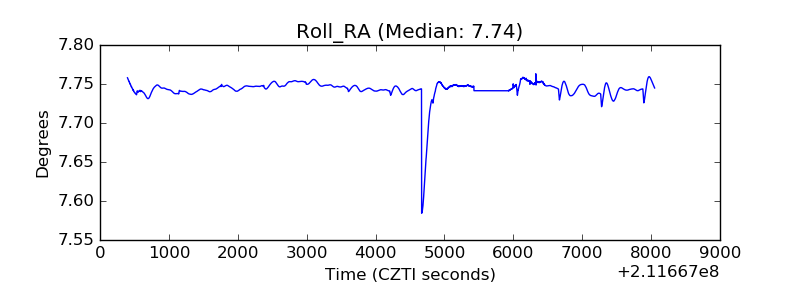 |
| Veto Counter | 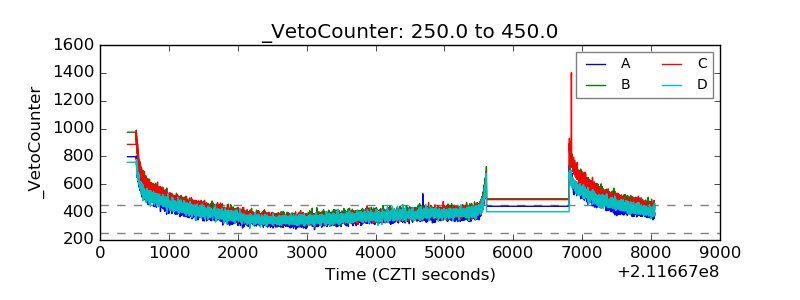 |