| Param | Original file | Final file |
|---|---|---|
| Filename | modeM0/AS1C01_015T01_9000000668_05240cztM0_level2.evt | modeM0/AS1C01_015T01_9000000668_05240cztM0_level2_quad_clean.evt |
| Size (bytes) | 521,619,840 | 76,478,400 |
| Size | 497.5 MB | 72.9 MB |
| Events in quadrant A | 3,120,299 | 475,953 |
| Events in quadrant B | 3,178,007 | 482,242 |
| Events in quadrant C | 3,080,322 | 467,423 |
| Events in quadrant D | 5,967,239 | 426,454 |
| Mode SS | |||
|---|---|---|---|
| Quadrant | BADHDUFLAG | Total packets | Discarded packets |
| A | 0 | 136 | 0 |
| B | 0 | 136 | 0 |
| C | 0 | 136 | 0 |
| D | 0 | 136 | 0 |
| Mode M9 | |||
|---|---|---|---|
| Quadrant | BADHDUFLAG | Total packets | Discarded packets |
| A | 0 | 12 | 0 |
| B | 0 | 12 | 0 |
| C | 0 | 12 | 0 |
| D | 0 | 12 | 0 |
| Mode M0 | |||
|---|---|---|---|
| Quadrant | BADHDUFLAG | Total packets | Discarded packets |
| A | 0 | 13645 | 3 |
| B | 0 | 13671 | 2 |
| C | 0 | 13652 | 2 |
| D | 0 | 22129 | 2 |
| Quadrant | Total seconds | Saturated seconds | Saturation percentage |
|---|---|---|---|
| A | 6645 | 50 | 0.752445% |
| B | 6645 | 62 | 0.933032% |
| C | 6645 | 28 | 0.421369% |
| D | 6645 | 892 | 13.423627% |
Noise dominated data is calculated using 1-second bins in cleaned event files. If a bin has >2000 counts, and if more than 50% of those come from <1% of pixels, then it is considered to be noise-dominated and hence unusable.
| Quadrant | # 1 sec bins | Bins with >0 counts | Bins with >2000 counts | High rate bins dominated by noise | Noise dominated (total time) | Noise dominated (detector-on time) | Marked lightcurve |
|---|---|---|---|---|---|---|---|
| A | 7870 | 6646 | 0 | 0 | 0.00% | 0.00% | 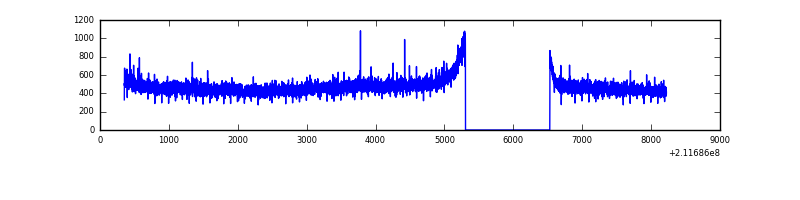 |
| B | 7870 | 6646 | 0 | 0 | 0.00% | 0.00% | 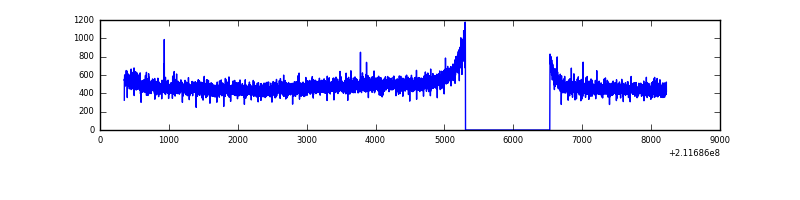 |
| C | 7870 | 6646 | 0 | 0 | 0.00% | 0.00% | 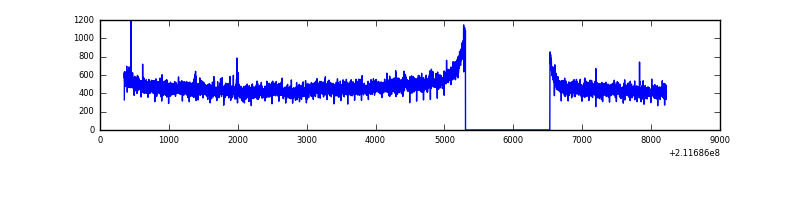 |
| D | 7870 | 6645 | 669 | 669 | 8.50% | 10.07% | 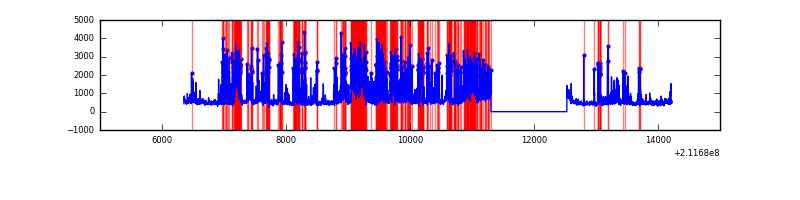 |
Top three noisy pixels from each quadrant. If the there are fewer than three noisy pixels in the level2.evt file, extra rows are filled as -1
| Pixel properties | Quadrant properties | ||||||
|---|---|---|---|---|---|---|---|
| Quadrant | DetID | PixID | Counts | Sigma | Mean | Median | Sigma |
| A | 12 | 194 | 7864 | 42.98 | 810 | 792 | 164.5 |
| A | 0 | 226 | 7785 | 42.5 | 810 | 792 | 164.5 |
| A | 14 | 111 | 3055 | 13.75 | 810 | 792 | 164.5 |
| B | 15 | 204 | 35921 | 224.21 | 811 | 795 | 156.7 |
| B | 12 | 111 | 15260 | 92.33 | 811 | 795 | 156.7 |
| B | 11 | 111 | 11801 | 70.25 | 811 | 795 | 156.7 |
| C | 1 | 16 | 53603 | 295.31 | 773 | 778 | 178.9 |
| C | 13 | 61 | 6271 | 30.71 | 773 | 778 | 178.9 |
| C | 7 | 159 | 4127 | 18.72 | 773 | 778 | 178.9 |
| D | 11 | 145 | 2726661 | 15112.49 | 732 | 709 | 180.4 |
| D | 8 | 195 | 263022 | 1454.24 | 732 | 709 | 180.4 |
| D | 10 | 15 | 102995 | 567.07 | 732 | 709 | 180.4 |
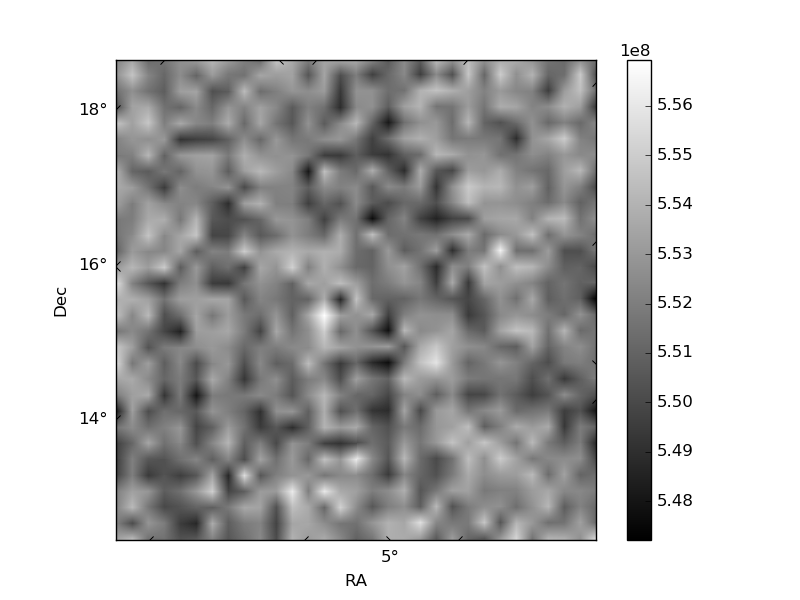
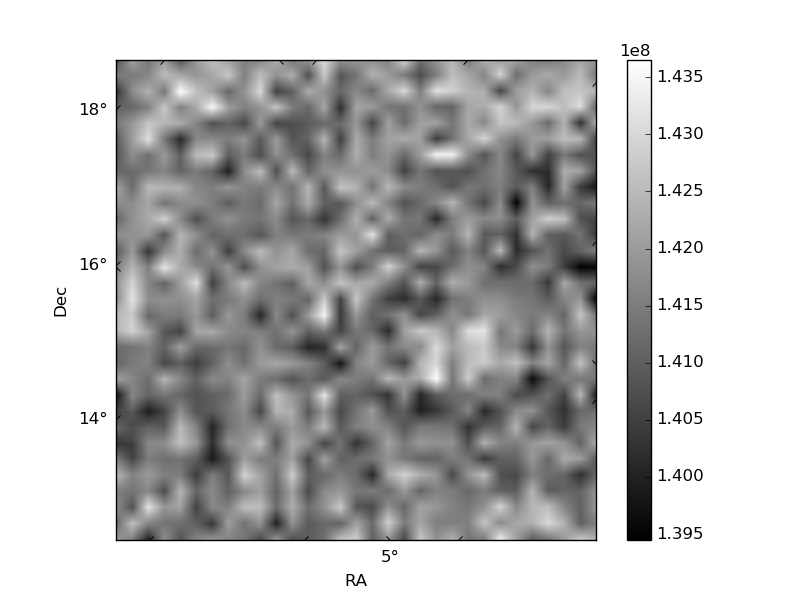
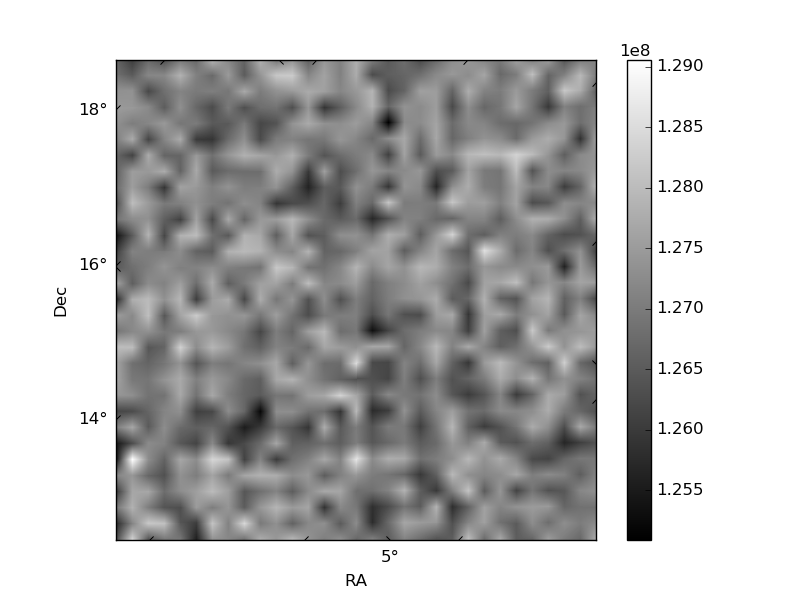
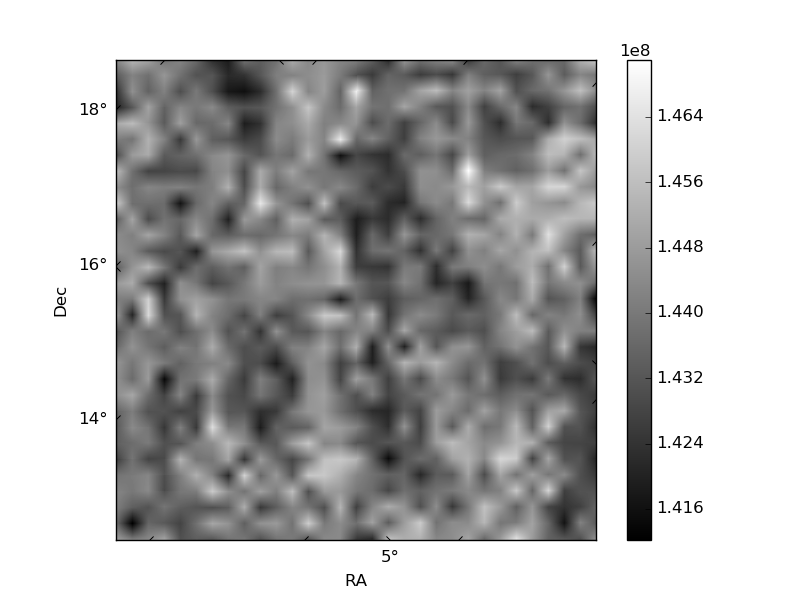
Histogram calculated using DETX and DETY for each event in the final _common_clean file
| Quadrant A | 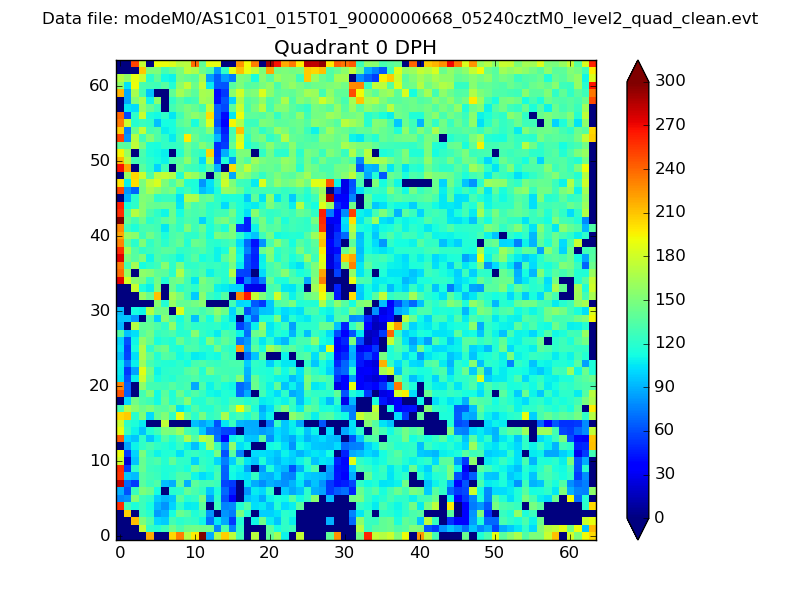 |
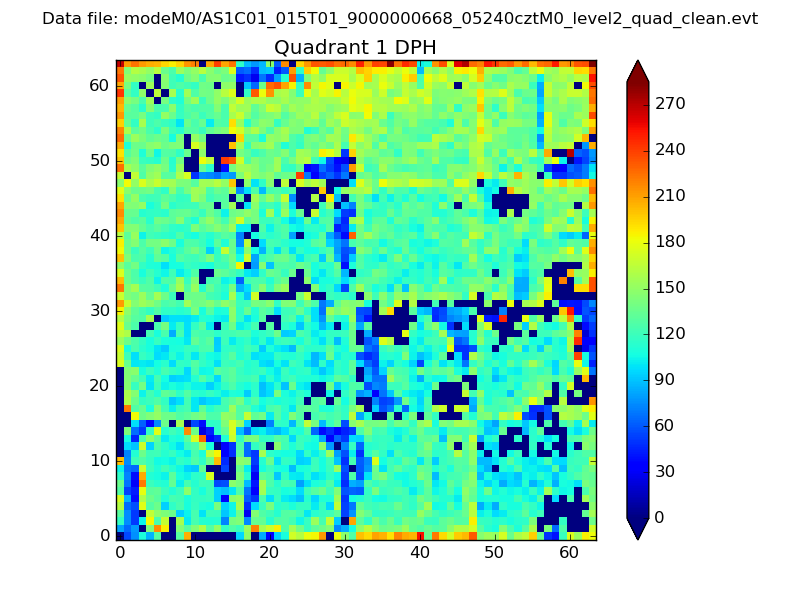 |
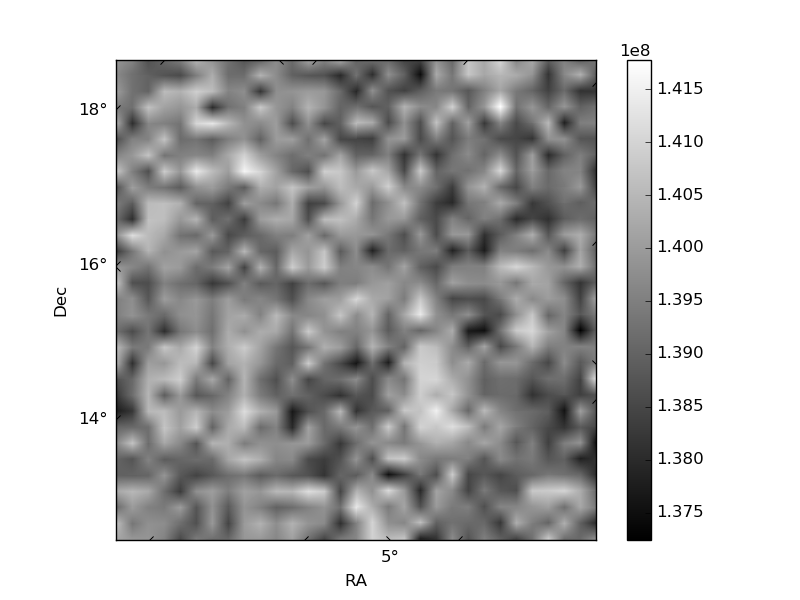
Quadrant B |
|---|---|---|---|
| Quadrant D | 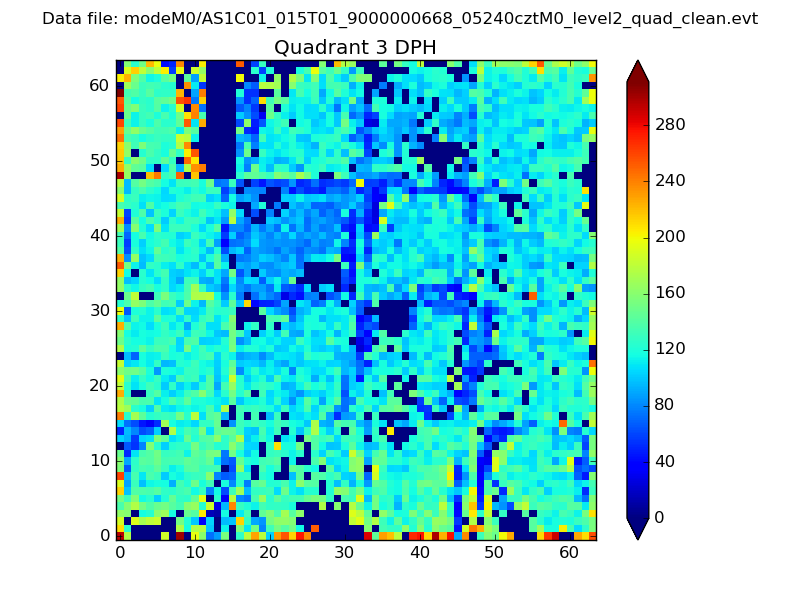 |
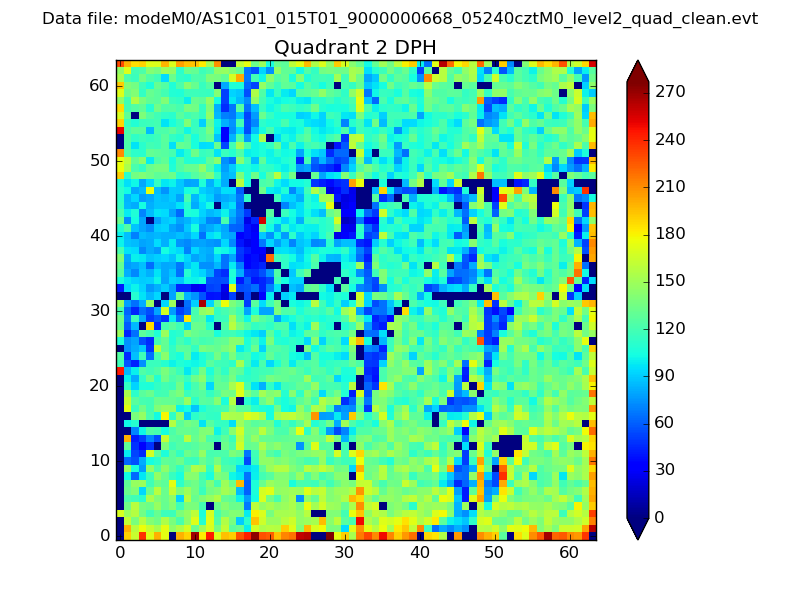 |
Quadrant C |
| Plot type | Count rate plots | Images |
|---|---|---|
| Comparison with Poisson distribution Blue bars denote a histogram of data divided into 1 sec bins. Red curve is a Poisson curve with rate = median count rate of data. |
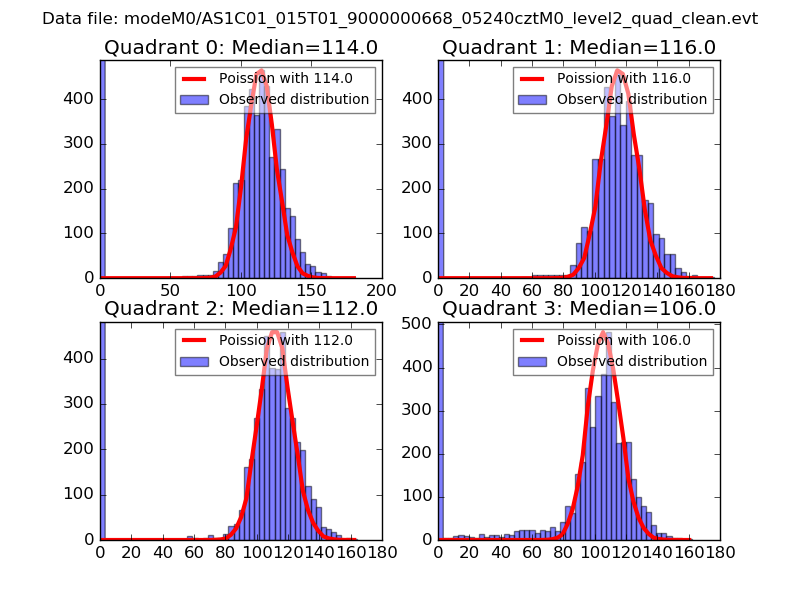 |
 |
| Quadrant-wise count rates Data is divided into 100 sec bins |
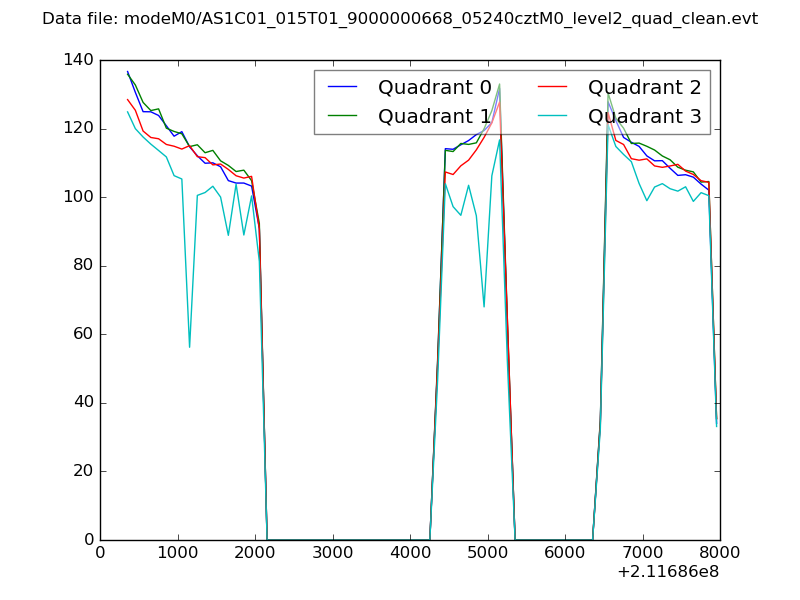 |
|
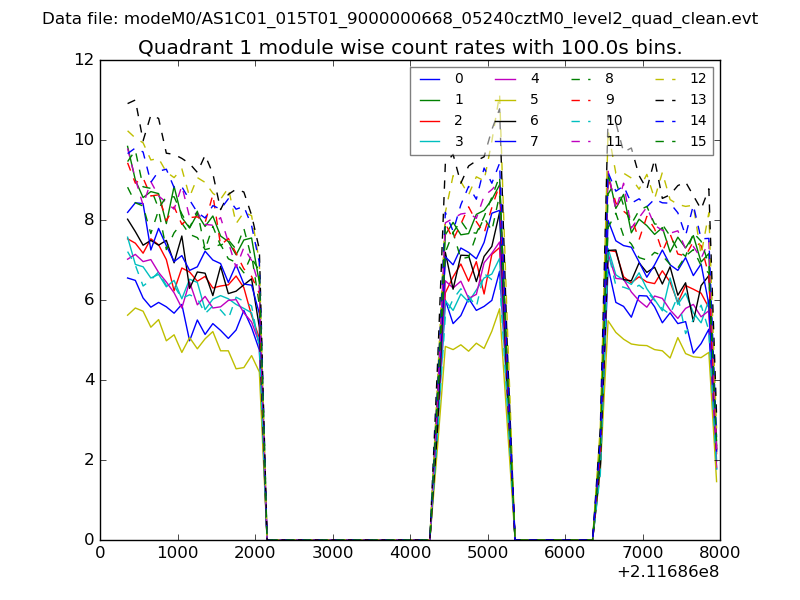
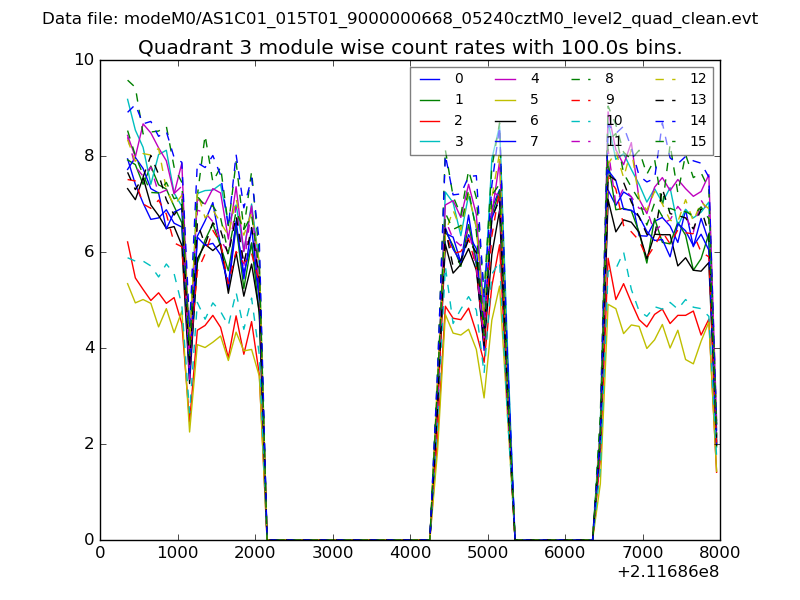
| Module-wise count rates for Quadrant A Data is divided into 100 sec bins |
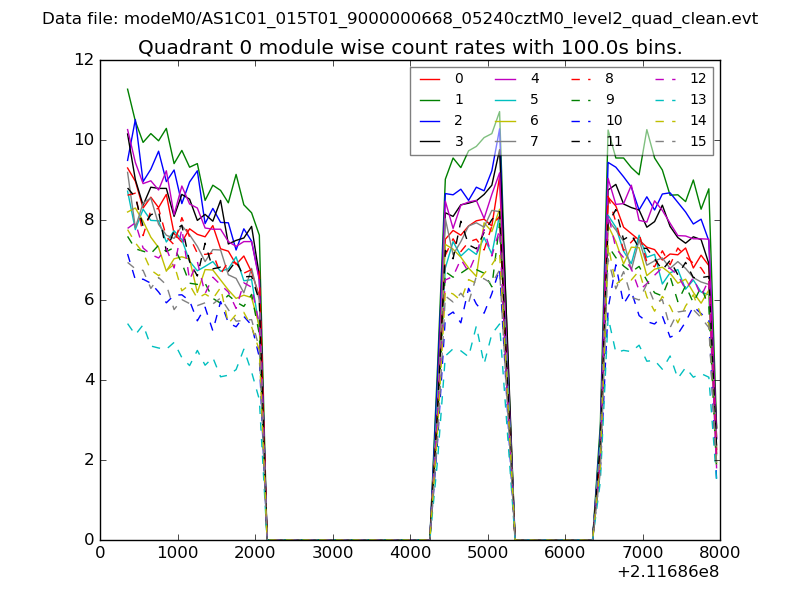 |
 |
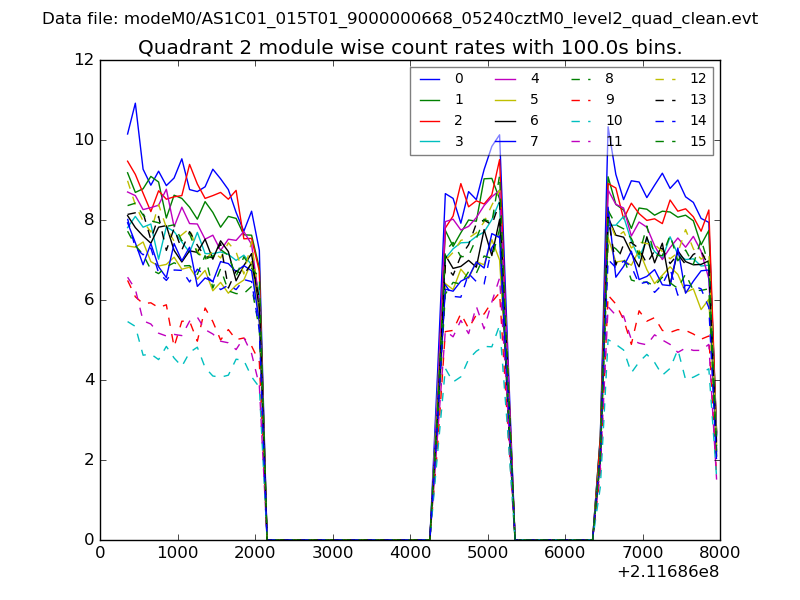
| Module-wise count rates for Quadrant B Data is divided into 100 sec bins |
 |
 |
| Module-wise count rates for Quadrant C Data is divided into 100 sec bins |
 |
 |
| Module-wise count rates for Quadrant D Data is divided into 100 sec bins |
 |
 |
| Parameter | Plot |
|---|---|
| CZT HV Monitor | 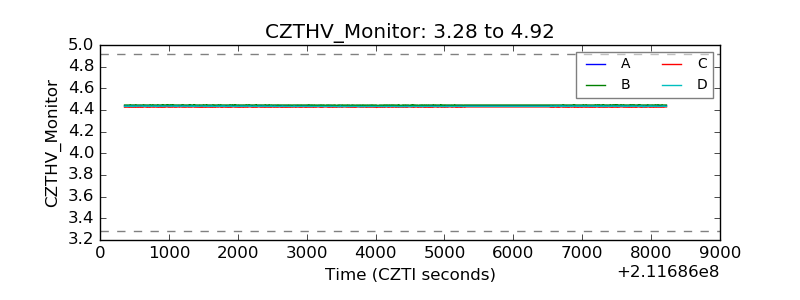 |
| D_VDD | 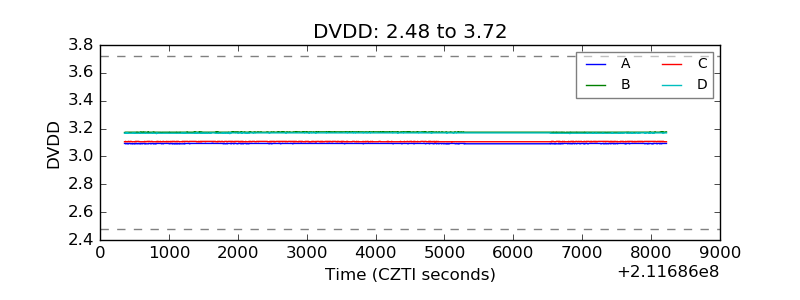 |
| Temperature 1 | 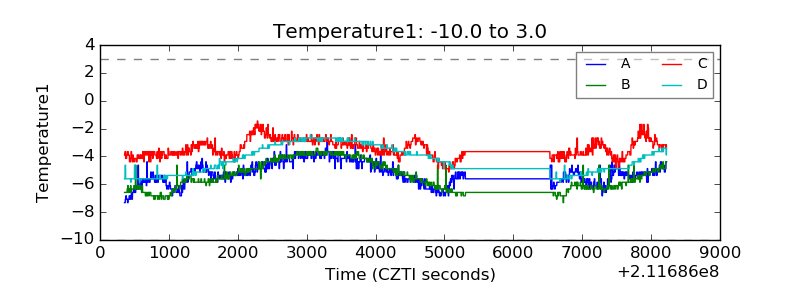 |
| Veto HV Monitor | 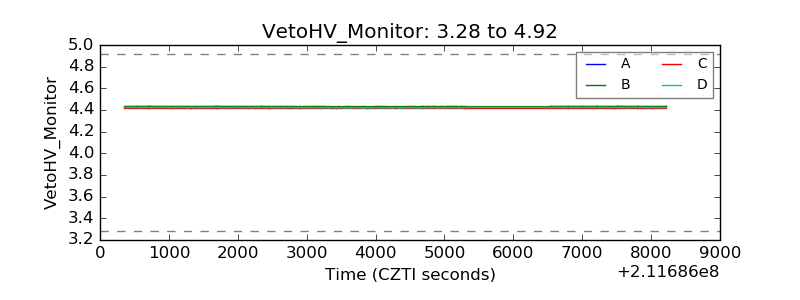 |
| Veto LLD | 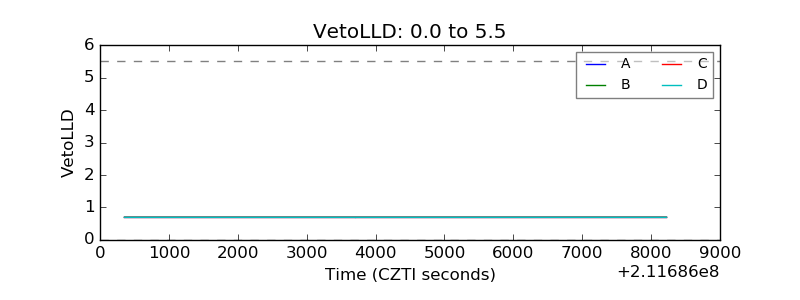 |
| Alpha Counter | 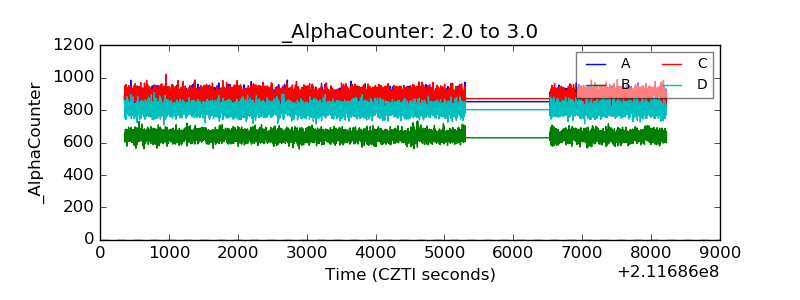 |
| _CPM_Rate | 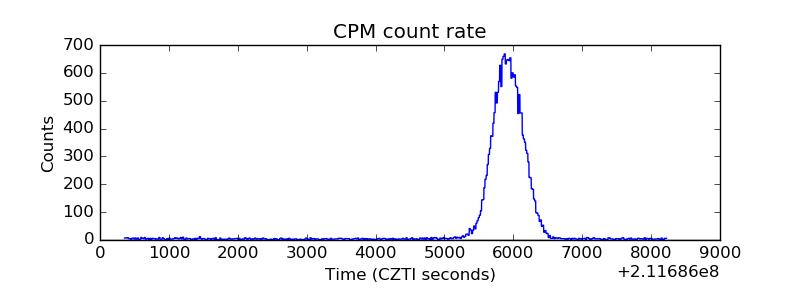 |
| CZT Counter | 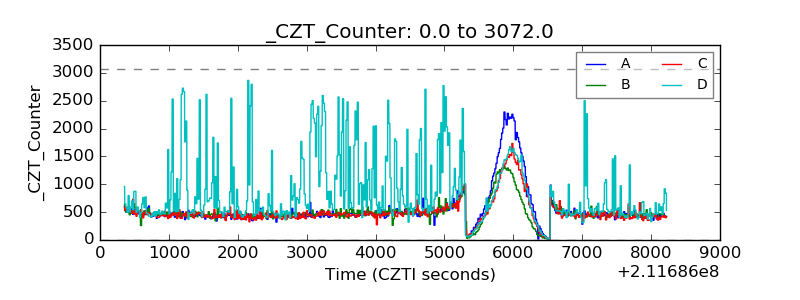 |
| +2.5 Volts monitor | 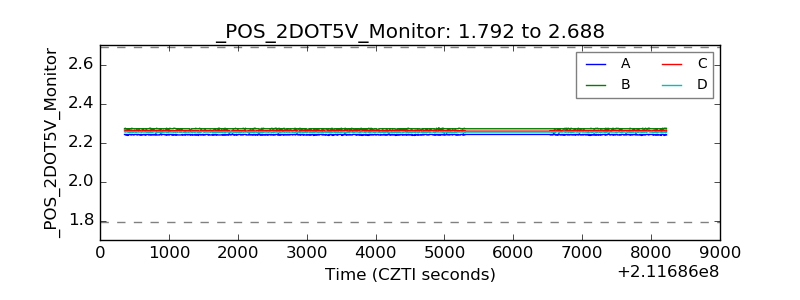 |
| +5 Volts monitor |  |
| _ROLL_ROT | 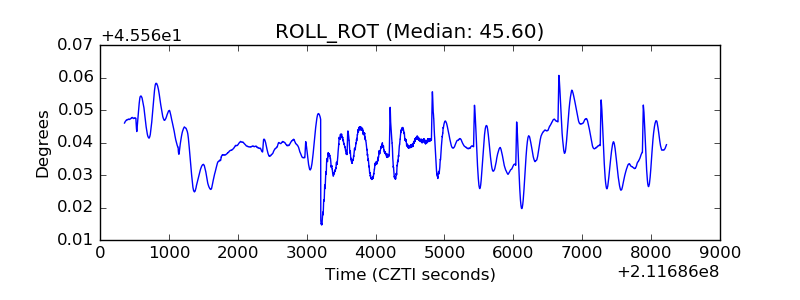 |
| _Roll_DEC | 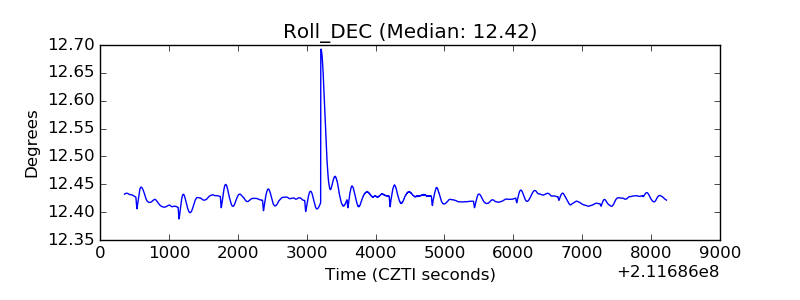 |
| _Roll_RA | 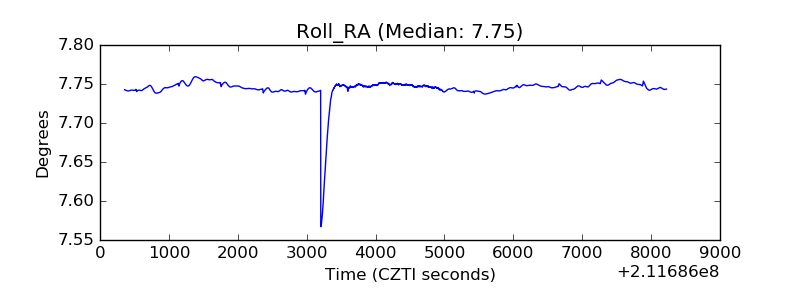 |
| Veto Counter | 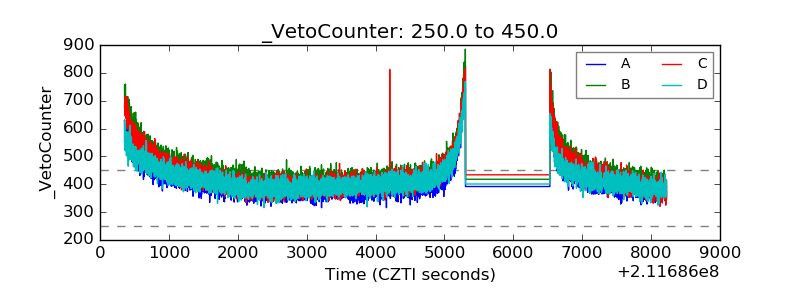 |