| Param | Original file | Final file |
|---|---|---|
| Filename | modeM0/AS1C01_015T01_9000000668_05241cztM0_level2.evt | modeM0/AS1C01_015T01_9000000668_05241cztM0_level2_quad_clean.evt |
| Size (bytes) | 507,617,280 | 72,743,040 |
| Size | 484.1 MB | 69.4 MB |
| Events in quadrant A | 3,121,461 | 444,440 |
| Events in quadrant B | 3,172,146 | 446,132 |
| Events in quadrant C | 3,067,746 | 436,311 |
| Events in quadrant D | 5,555,727 | 407,388 |
| Mode SS | |||
|---|---|---|---|
| Quadrant | BADHDUFLAG | Total packets | Discarded packets |
| A | 0 | 136 | 0 |
| B | 0 | 136 | 0 |
| C | 0 | 136 | 0 |
| D | 0 | 136 | 0 |
| Mode M9 | |||
|---|---|---|---|
| Quadrant | BADHDUFLAG | Total packets | Discarded packets |
| A | 0 | 17 | 0 |
| B | 0 | 17 | 0 |
| C | 0 | 17 | 0 |
| D | 0 | 18 | 0 |
| Mode M0 | |||
|---|---|---|---|
| Quadrant | BADHDUFLAG | Total packets | Discarded packets |
| A | 0 | 13747 | 3 |
| B | 0 | 13834 | 2 |
| C | 0 | 13824 | 2 |
| D | 0 | 20991 | 2 |
| Quadrant | Total seconds | Saturated seconds | Saturation percentage |
|---|---|---|---|
| A | 6719 | 68 | 1.012055% |
| B | 6719 | 81 | 1.205537% |
| C | 6719 | 34 | 0.506028% |
| D | 6719 | 630 | 9.376395% |
Noise dominated data is calculated using 1-second bins in cleaned event files. If a bin has >2000 counts, and if more than 50% of those come from <1% of pixels, then it is considered to be noise-dominated and hence unusable.
| Quadrant | # 1 sec bins | Bins with >0 counts | Bins with >2000 counts | High rate bins dominated by noise | Noise dominated (total time) | Noise dominated (detector-on time) | Marked lightcurve |
|---|---|---|---|---|---|---|---|
| A | 7774 | 6720 | 0 | 0 | 0.00% | 0.00% | 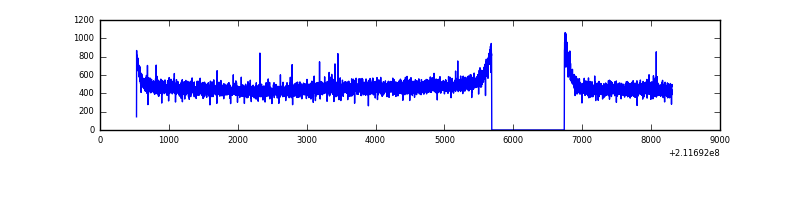 |
| B | 7774 | 6720 | 0 | 0 | 0.00% | 0.00% | 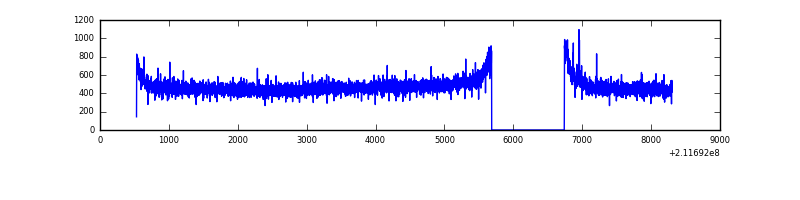 |
| C | 7774 | 6720 | 1 | 1 | 0.01% | 0.01% | 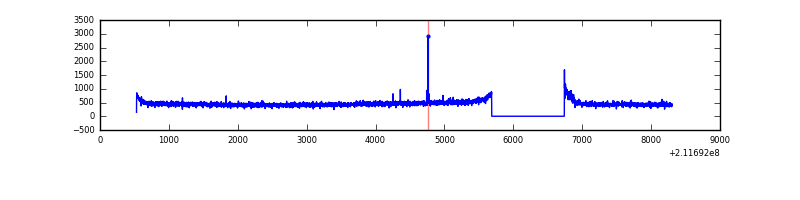 |
| D | 7774 | 6720 | 444 | 444 | 5.71% | 6.61% | 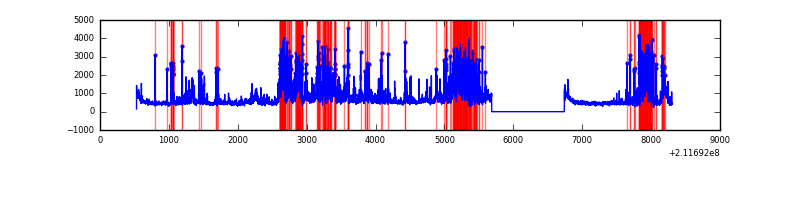 |
Top three noisy pixels from each quadrant. If the there are fewer than three noisy pixels in the level2.evt file, extra rows are filled as -1
| Pixel properties | Quadrant properties | ||||||
|---|---|---|---|---|---|---|---|
| Quadrant | DetID | PixID | Counts | Sigma | Mean | Median | Sigma |
| A | 12 | 194 | 7934 | 43.17 | 811 | 794 | 165.4 |
| A | 0 | 226 | 7929 | 43.14 | 811 | 794 | 165.4 |
| A | 13 | 14 | 3436 | 15.98 | 811 | 794 | 165.4 |
| B | 12 | 111 | 15763 | 95.49 | 812 | 795 | 156.7 |
| B | 0 | 229 | 12048 | 71.79 | 812 | 795 | 156.7 |
| B | 11 | 111 | 12036 | 71.72 | 812 | 795 | 156.7 |
| C | 1 | 16 | 40125 | 218.75 | 773 | 780 | 179.9 |
| C | 12 | 4 | 7562 | 37.71 | 773 | 780 | 179.9 |
| C | 13 | 61 | 6257 | 30.45 | 773 | 780 | 179.9 |
| D | 11 | 145 | 2326818 | 12578.29 | 752 | 730 | 184.9 |
| D | 8 | 195 | 251003 | 1353.35 | 752 | 730 | 184.9 |
| D | 2 | 136 | 62660 | 334.89 | 752 | 730 | 184.9 |
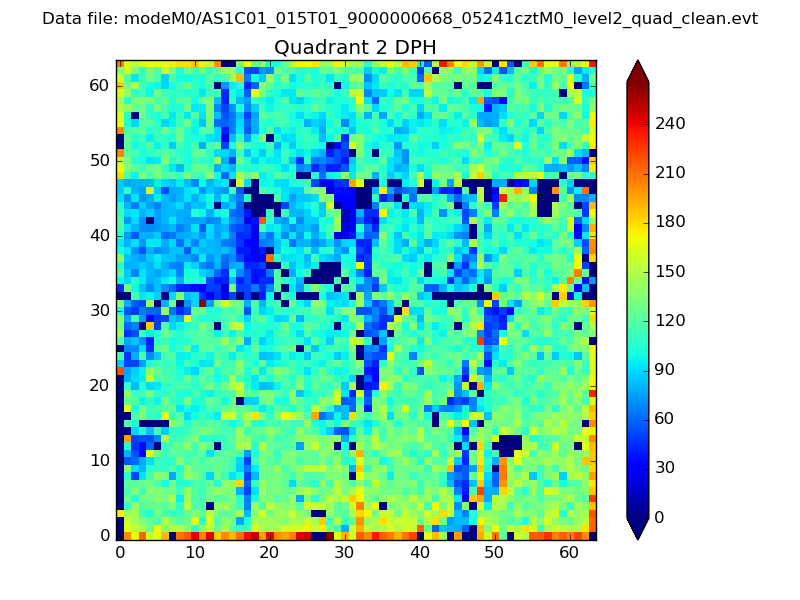
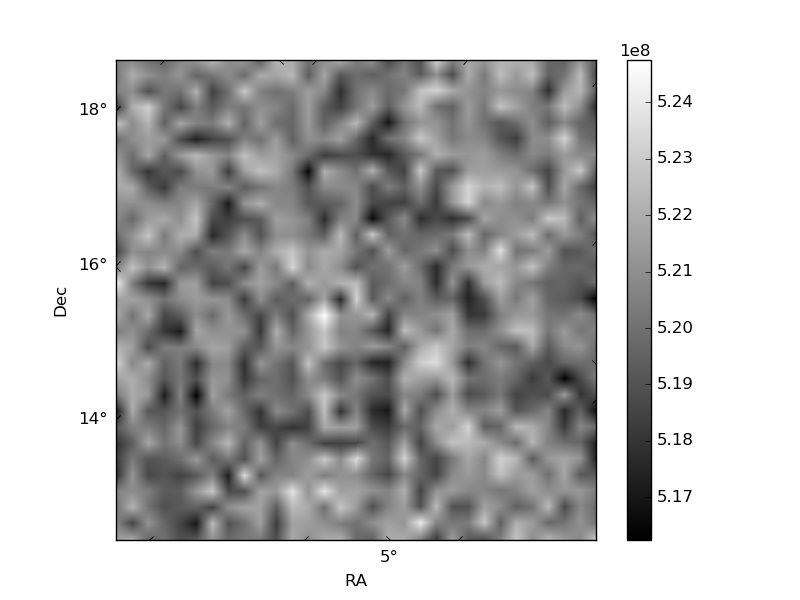
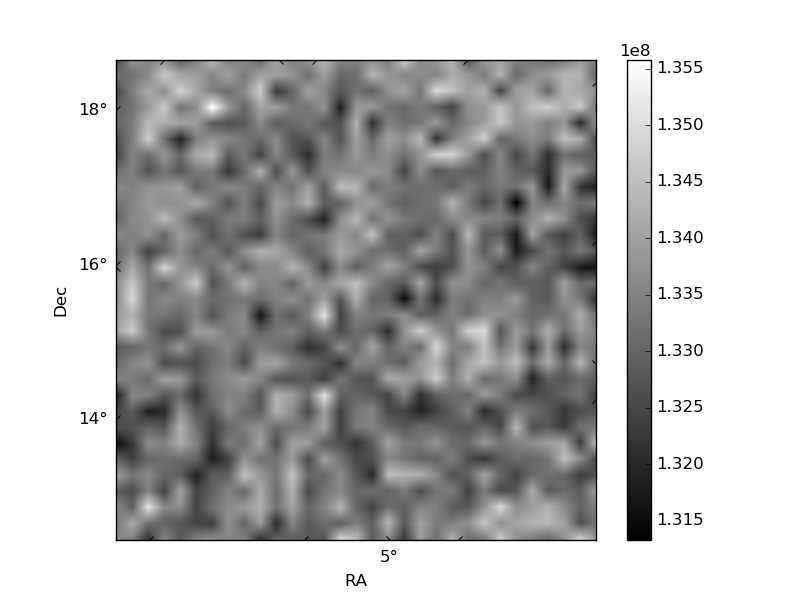
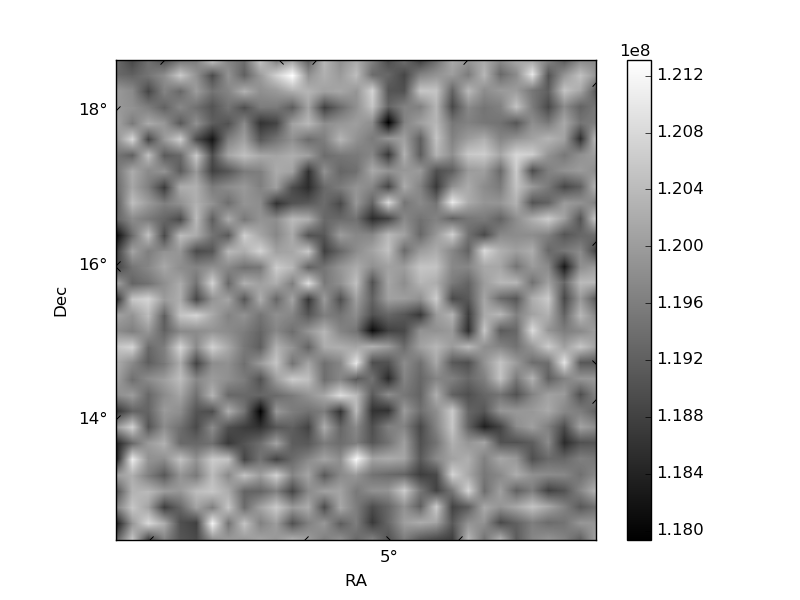
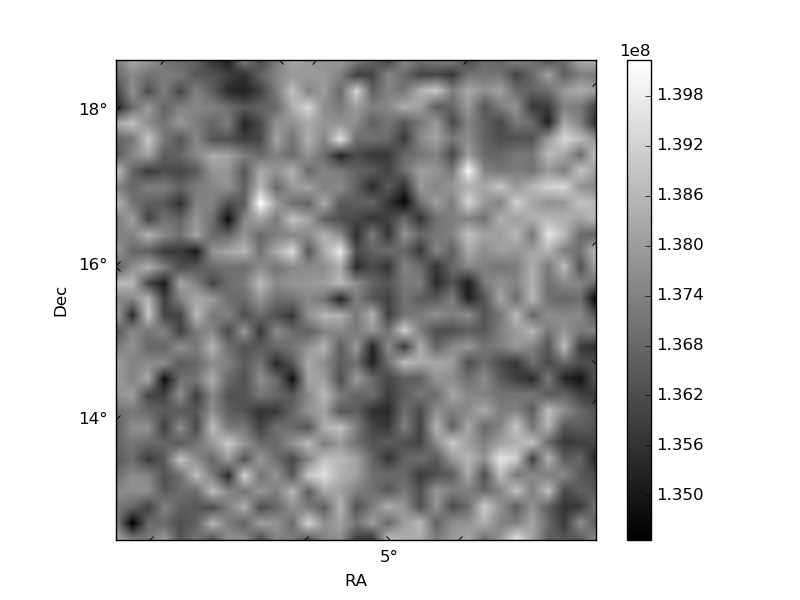
Histogram calculated using DETX and DETY for each event in the final _common_clean file
| Quadrant A | 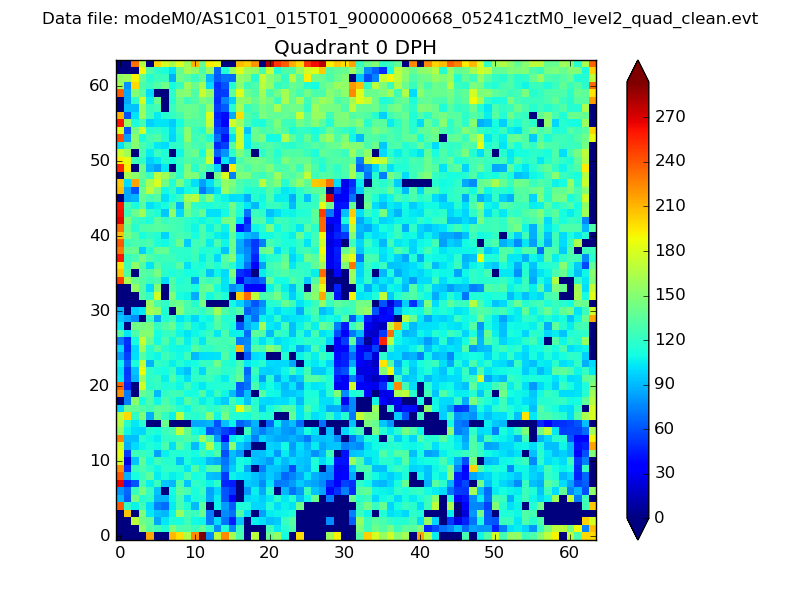 |
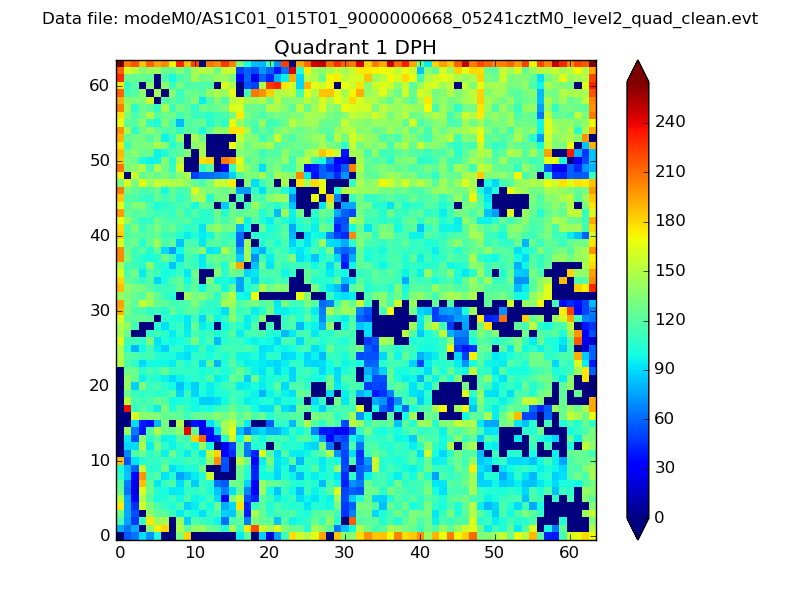 |
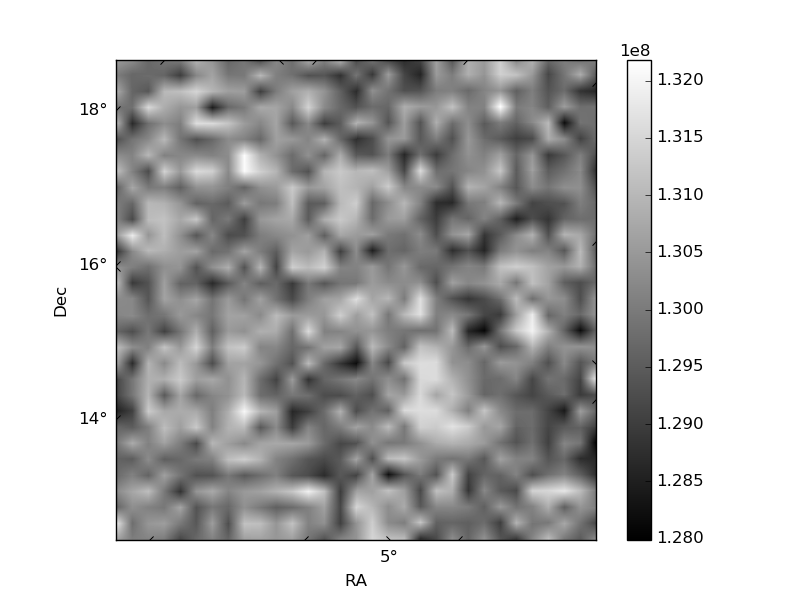
Quadrant B |
|---|---|---|---|
| Quadrant D | 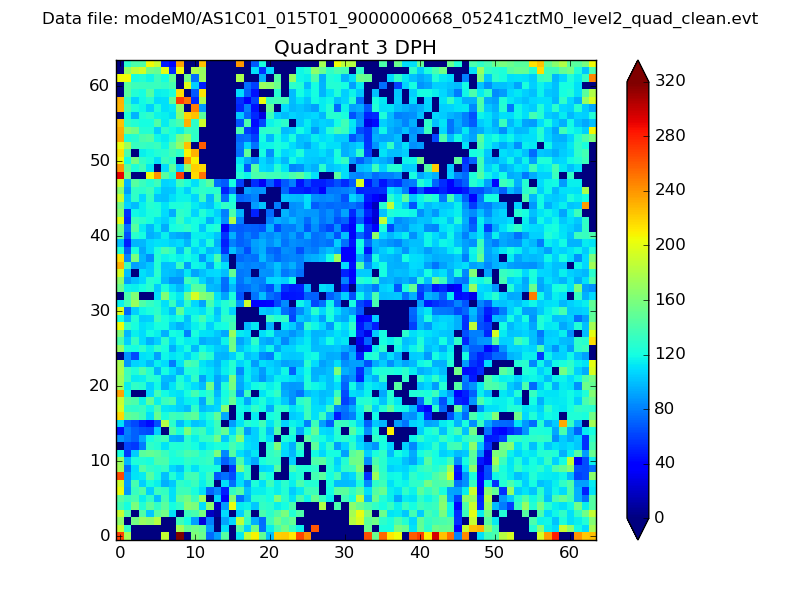 |
 |
Quadrant C |
| Plot type | Count rate plots | Images |
|---|---|---|
| Comparison with Poisson distribution Blue bars denote a histogram of data divided into 1 sec bins. Red curve is a Poisson curve with rate = median count rate of data. |
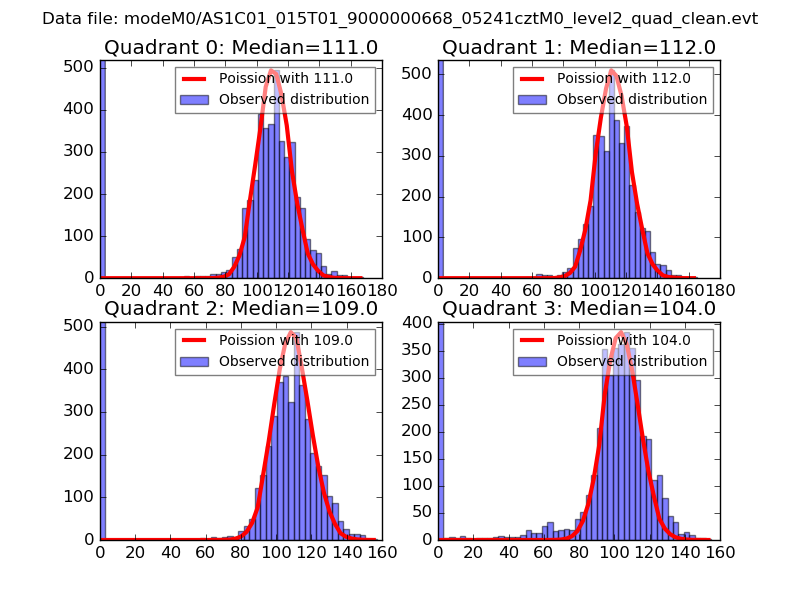 |
 |
| Quadrant-wise count rates Data is divided into 100 sec bins |
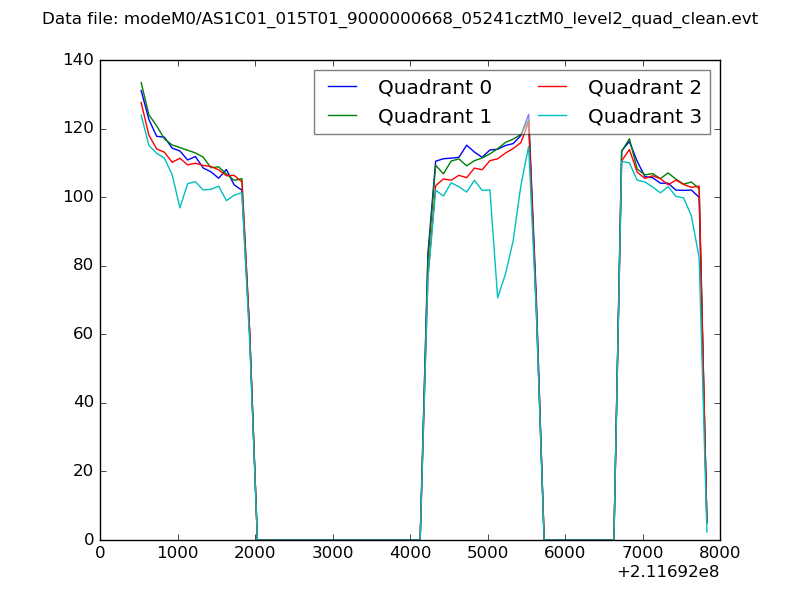 |
|
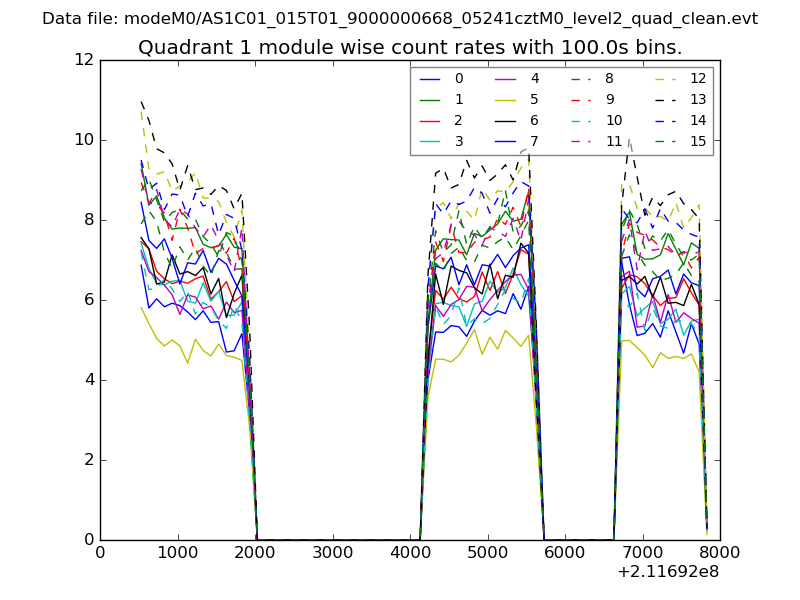
| Module-wise count rates for Quadrant A Data is divided into 100 sec bins |
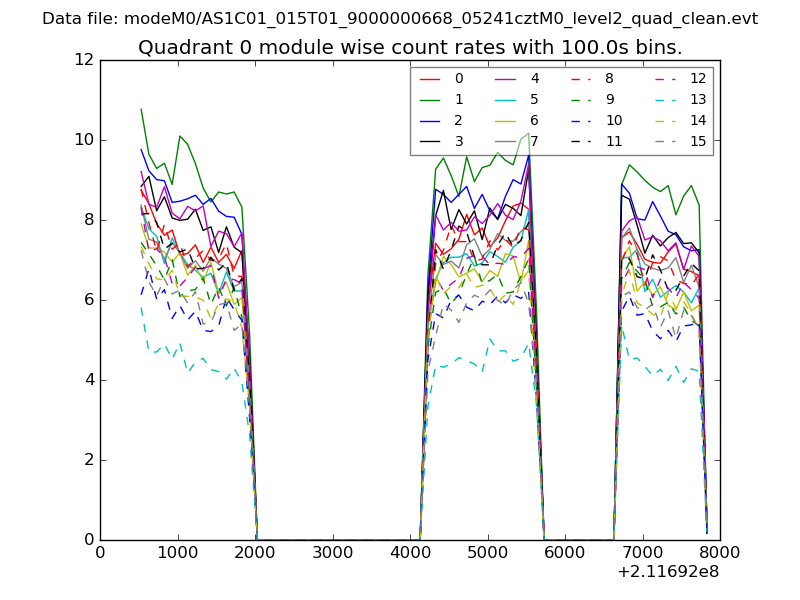 |
 |
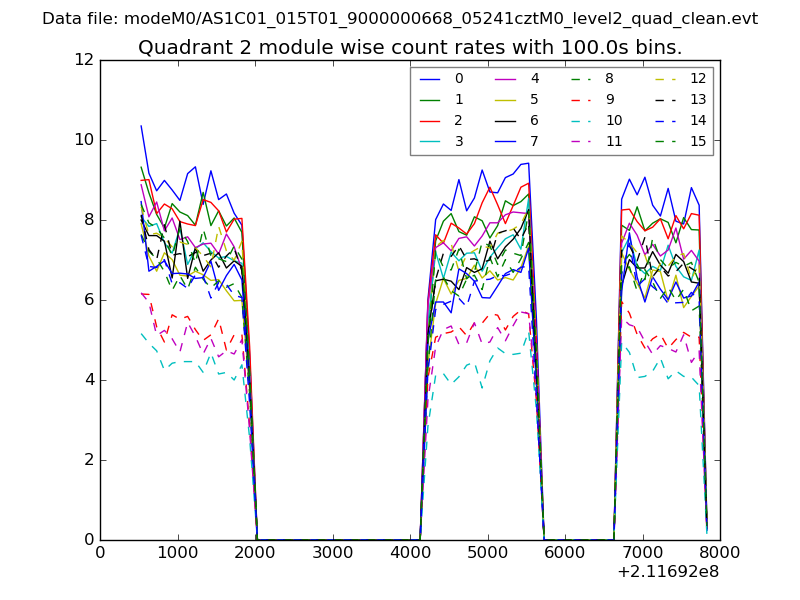
| Module-wise count rates for Quadrant B Data is divided into 100 sec bins |
 |
 |
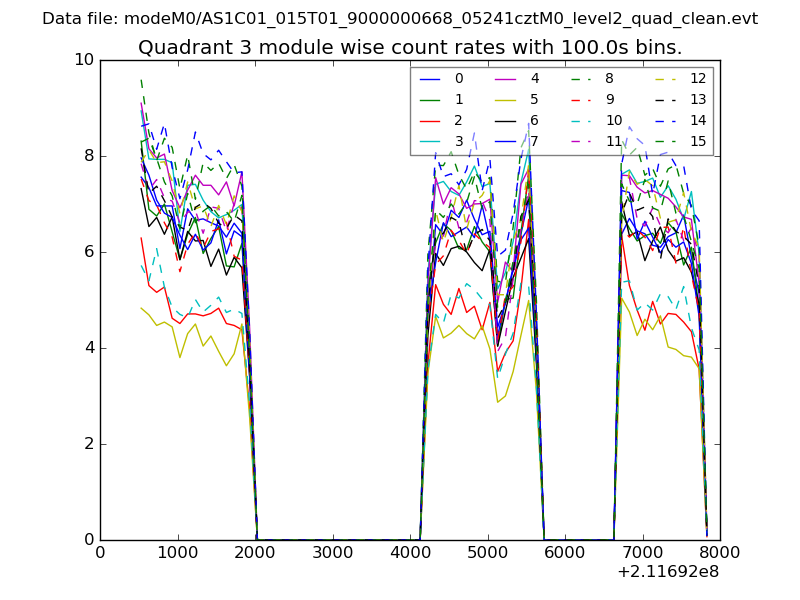
| Module-wise count rates for Quadrant C Data is divided into 100 sec bins |
 |
 |
| Module-wise count rates for Quadrant D Data is divided into 100 sec bins |
 |
 |
| Parameter | Plot |
|---|---|
| CZT HV Monitor | 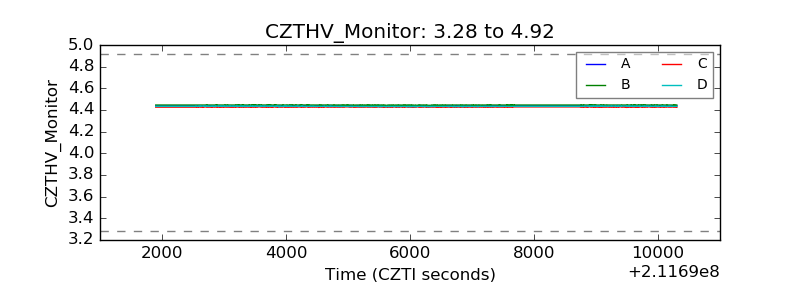 |
| D_VDD | 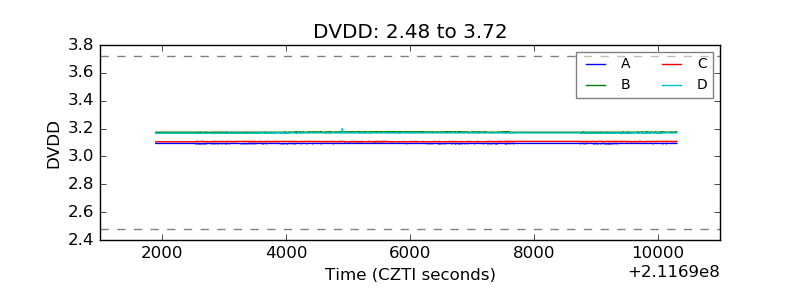 |
| Temperature 1 | 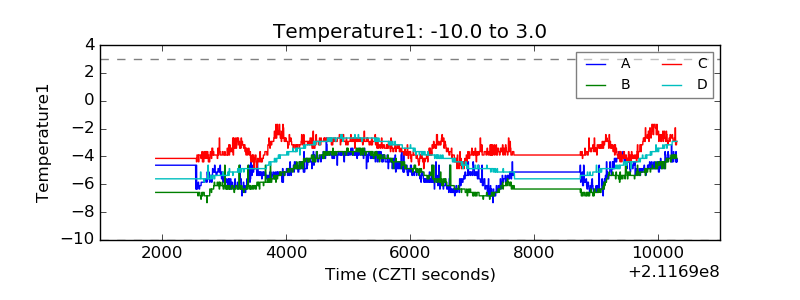 |
| Veto HV Monitor | 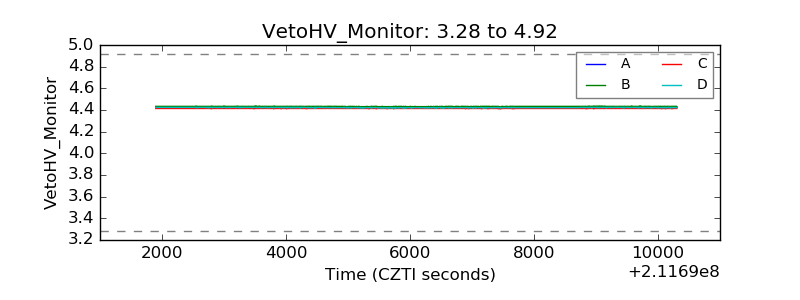 |
| Veto LLD | 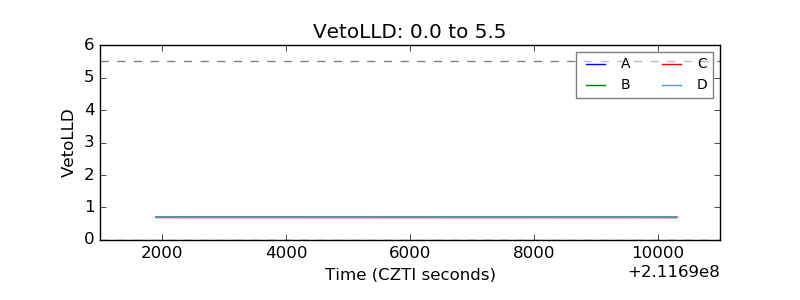 |
| Alpha Counter | 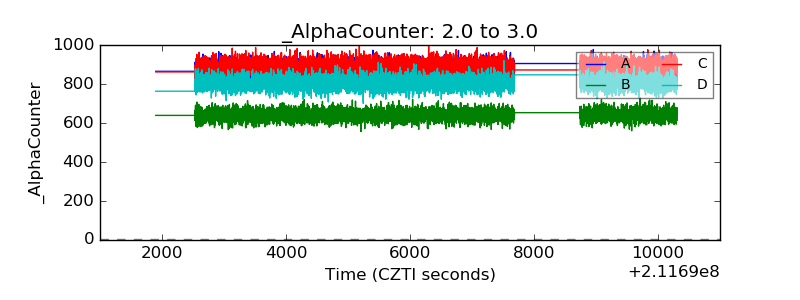 |
| _CPM_Rate | 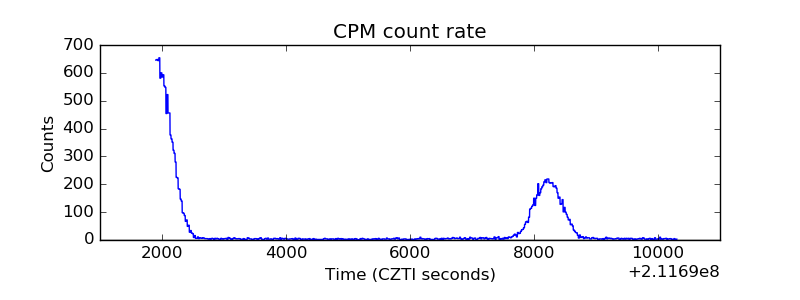 |
| CZT Counter | 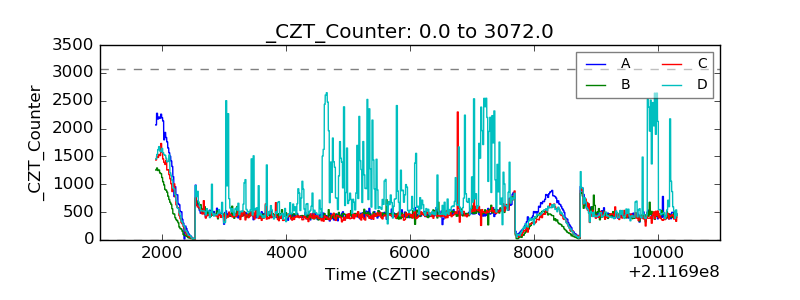 |
| +2.5 Volts monitor |  |
| +5 Volts monitor |  |
| _ROLL_ROT | 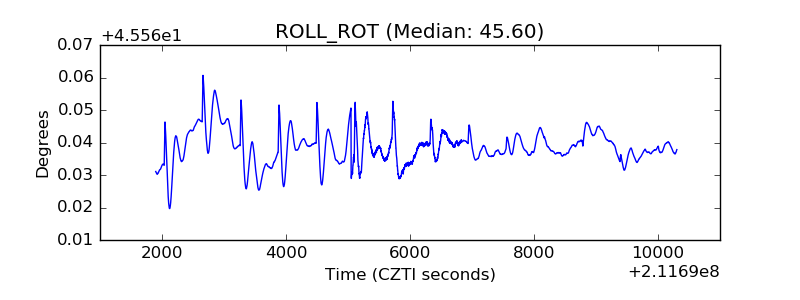 |
| _Roll_DEC | 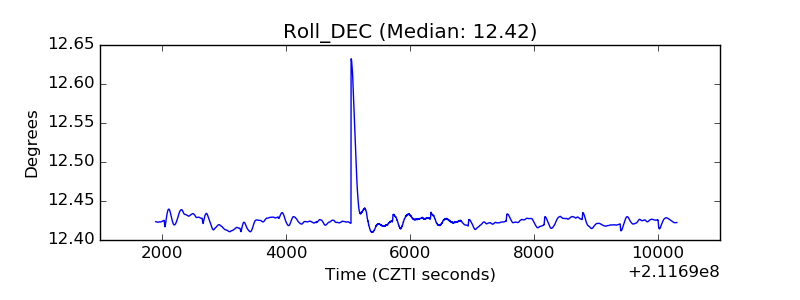 |
| _Roll_RA | 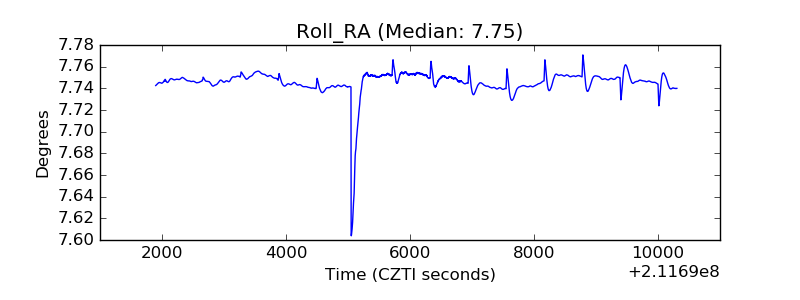 |
| Veto Counter | 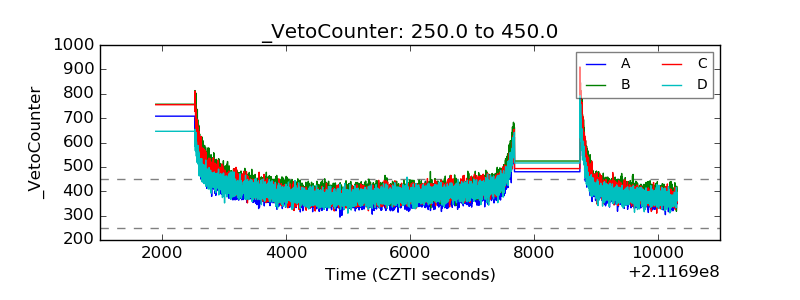 |