| Param | Original file | Final file |
|---|---|---|
| Filename | modeM0/AS1C01_015T01_9000000668_05242cztM0_level2.evt | modeM0/AS1C01_015T01_9000000668_05242cztM0_level2_quad_clean.evt |
| Size (bytes) | 529,701,120 | 61,968,960 |
| Size | 505.2 MB | 59.1 MB |
| Events in quadrant A | 3,017,589 | 367,766 |
| Events in quadrant B | 3,094,453 | 369,078 |
| Events in quadrant C | 3,029,424 | 363,127 |
| Events in quadrant D | 6,455,818 | 319,163 |
| Mode SS | |||
|---|---|---|---|
| Quadrant | BADHDUFLAG | Total packets | Discarded packets |
| A | 0 | 134 | 0 |
| B | 0 | 134 | 0 |
| C | 0 | 134 | 0 |
| D | 0 | 134 | 0 |
| Mode M9 | |||
|---|---|---|---|
| Quadrant | BADHDUFLAG | Total packets | Discarded packets |
| A | 0 | 6 | 0 |
| B | 0 | 6 | 0 |
| C | 0 | 6 | 0 |
| D | 0 | 6 | 0 |
| Mode M0 | |||
|---|---|---|---|
| Quadrant | BADHDUFLAG | Total packets | Discarded packets |
| A | 0 | 13476 | 2 |
| B | 0 | 13534 | 1 |
| C | 0 | 13582 | 1 |
| D | 0 | 23518 | 1 |
| Quadrant | Total seconds | Saturated seconds | Saturation percentage |
|---|---|---|---|
| A | 6540 | 184 | 2.813456% |
| B | 6540 | 198 | 3.027523% |
| C | 6540 | 132 | 2.018349% |
| D | 6540 | 1234 | 18.868502% |
Noise dominated data is calculated using 1-second bins in cleaned event files. If a bin has >2000 counts, and if more than 50% of those come from <1% of pixels, then it is considered to be noise-dominated and hence unusable.
| Quadrant | # 1 sec bins | Bins with >0 counts | Bins with >2000 counts | High rate bins dominated by noise | Noise dominated (total time) | Noise dominated (detector-on time) | Marked lightcurve |
|---|---|---|---|---|---|---|---|
| A | 7190 | 6540 | 1 | 1 | 0.01% | 0.02% | 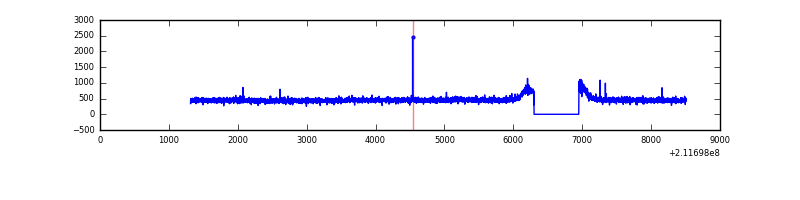 |
| B | 7190 | 6540 | 0 | 0 | 0.00% | 0.00% | 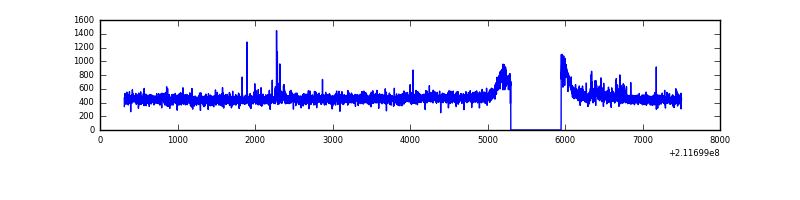 |
| C | 7190 | 6540 | 1 | 1 | 0.01% | 0.02% | 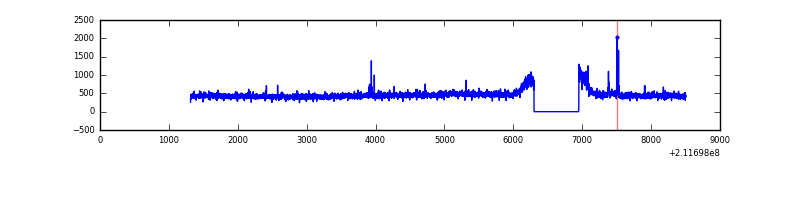 |
| D | 7190 | 6540 | 869 | 869 | 12.09% | 13.29% | 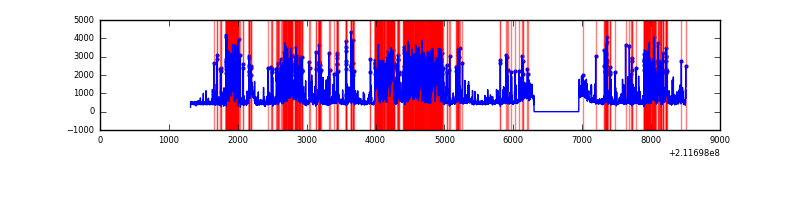 |
Top three noisy pixels from each quadrant. If the there are fewer than three noisy pixels in the level2.evt file, extra rows are filled as -1
| Pixel properties | Quadrant properties | ||||||
|---|---|---|---|---|---|---|---|
| Quadrant | DetID | PixID | Counts | Sigma | Mean | Median | Sigma |
| A | 0 | 226 | 7735 | 43.32 | 781 | 763 | 160.9 |
| A | 12 | 194 | 7648 | 42.78 | 781 | 763 | 160.9 |
| A | 14 | 111 | 4154 | 21.07 | 781 | 763 | 160.9 |
| B | 0 | 229 | 32637 | 207.22 | 783 | 763 | 153.8 |
| B | 12 | 111 | 15433 | 95.37 | 783 | 763 | 153.8 |
| B | 7 | 252 | 13609 | 83.51 | 783 | 763 | 153.8 |
| C | 1 | 16 | 38093 | 211.41 | 752 | 756 | 176.6 |
| C | 7 | 159 | 22909 | 125.43 | 752 | 756 | 176.6 |
| C | 14 | 67 | 12851 | 68.48 | 752 | 756 | 176.6 |
| D | 11 | 145 | 3514659 | 20147.47 | 699 | 676 | 174.4 |
| D | 8 | 195 | 220774 | 1261.93 | 699 | 676 | 174.4 |
| D | 2 | 136 | 29997 | 168.11 | 699 | 676 | 174.4 |
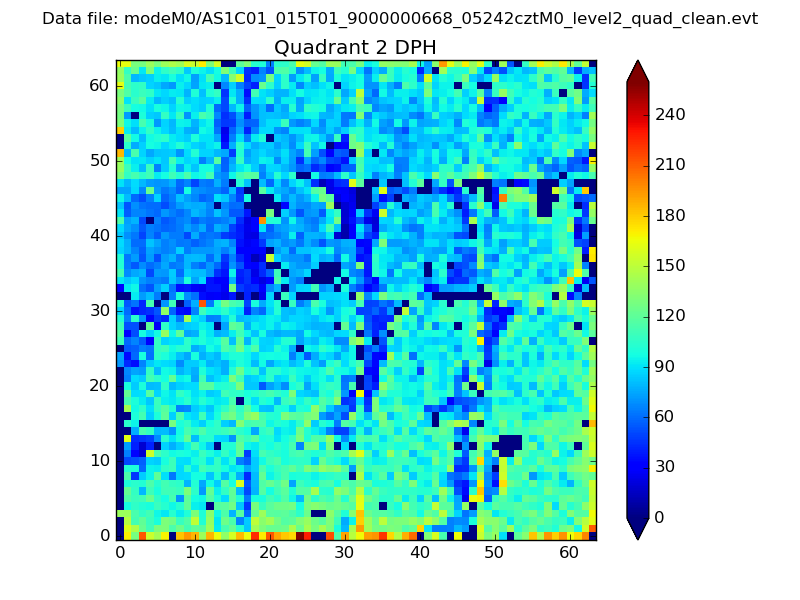
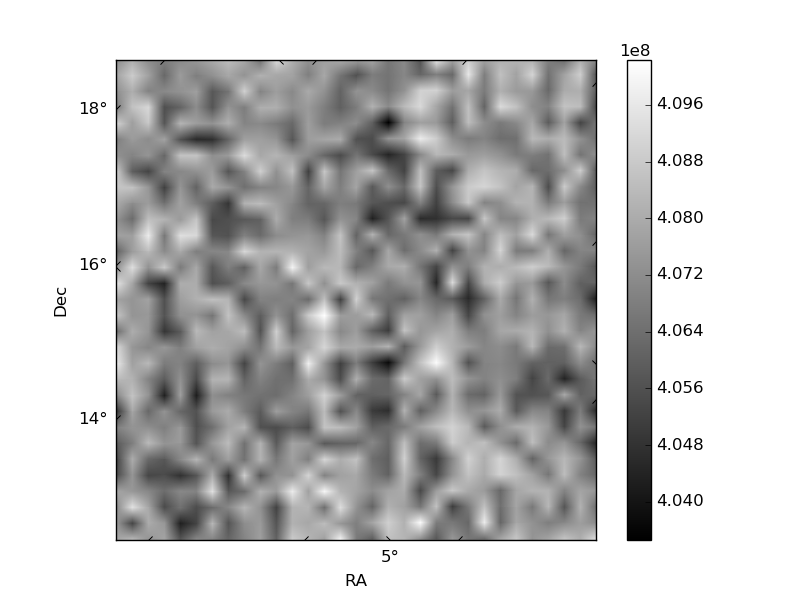
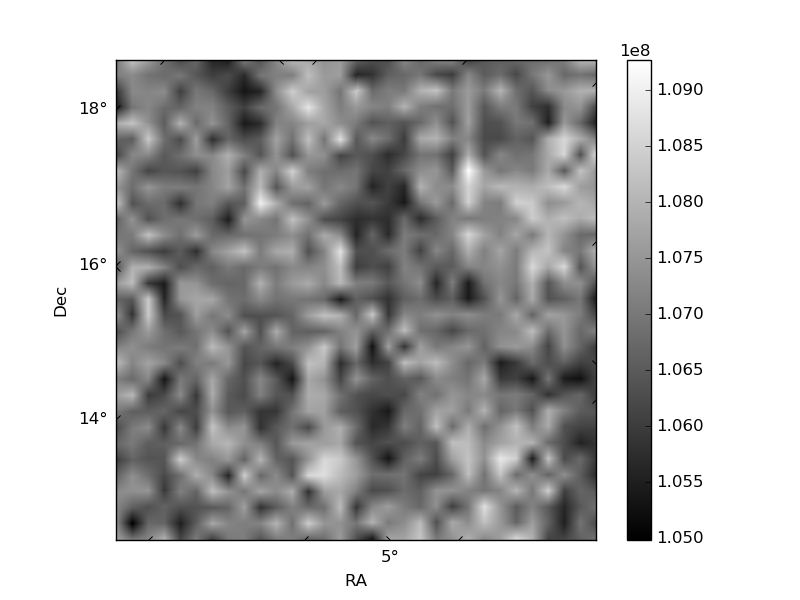
Histogram calculated using DETX and DETY for each event in the final _common_clean file
| Quadrant A | 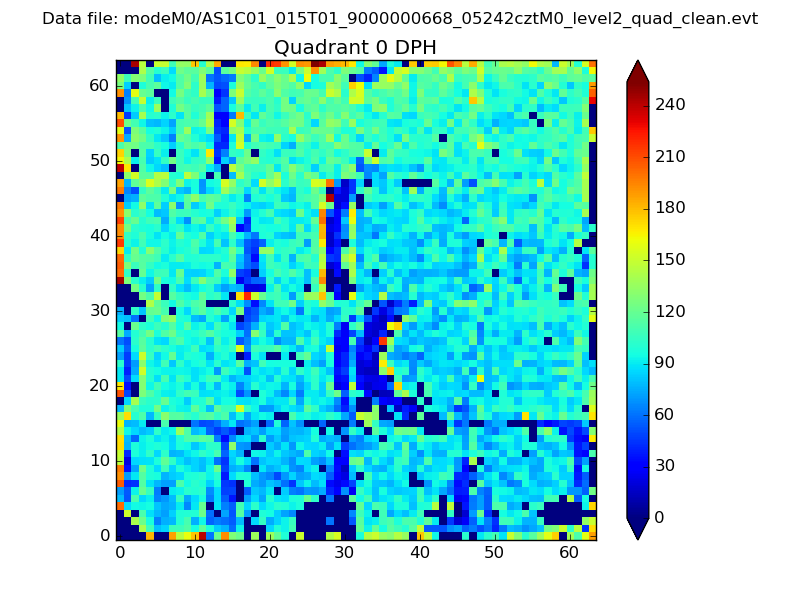 |
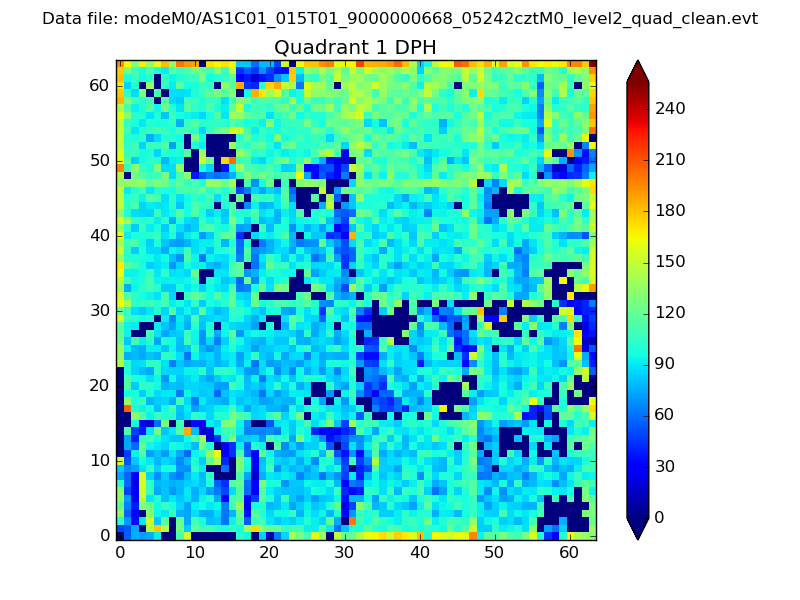 |
Quadrant B |
|---|---|---|---|
| Quadrant D | 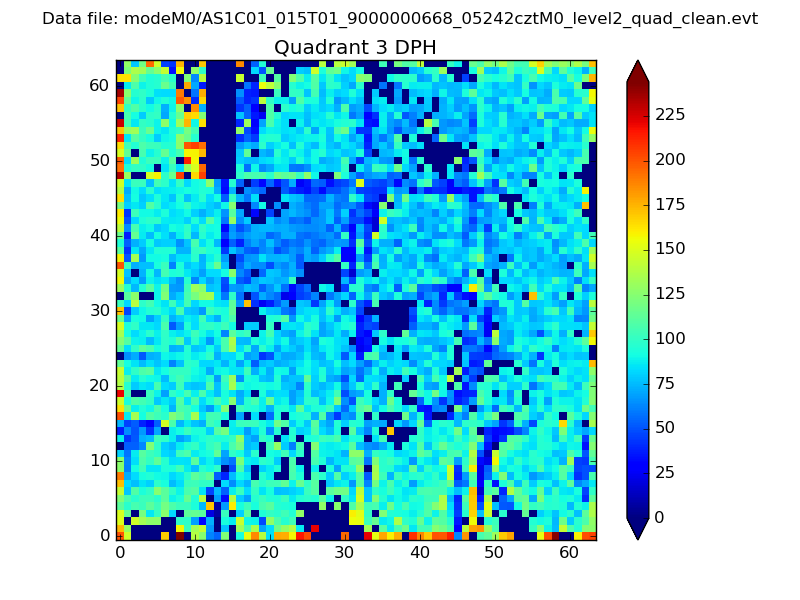 |
 |
Quadrant C |
| Plot type | Count rate plots | Images |
|---|---|---|
| Comparison with Poisson distribution Blue bars denote a histogram of data divided into 1 sec bins. Red curve is a Poisson curve with rate = median count rate of data. |
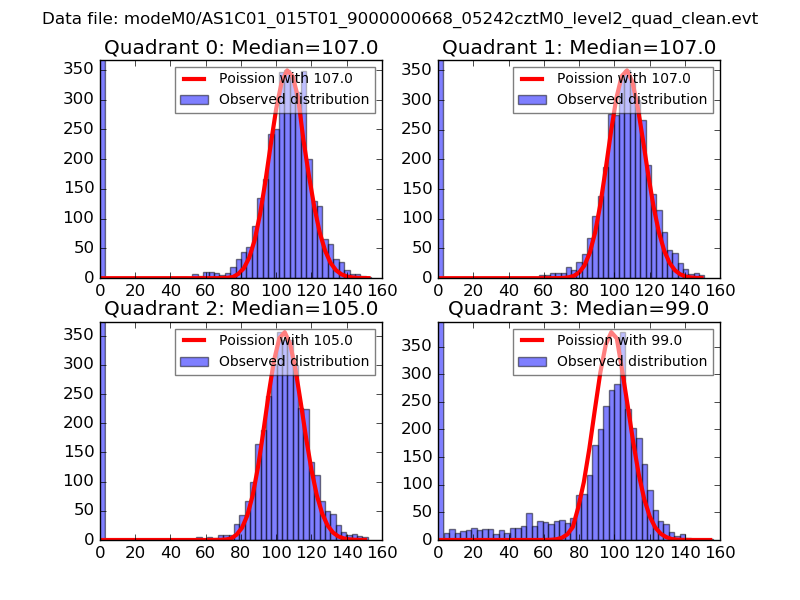 |
 |
| Quadrant-wise count rates Data is divided into 100 sec bins |
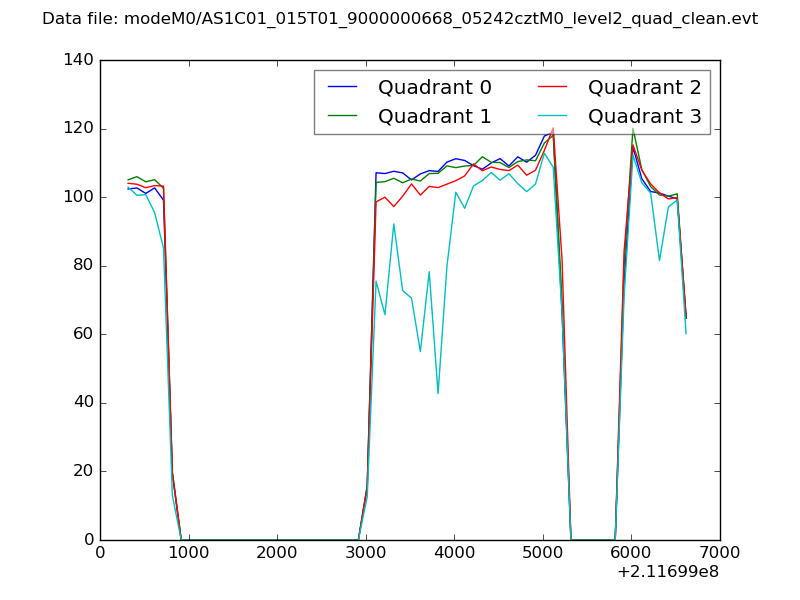 |
|
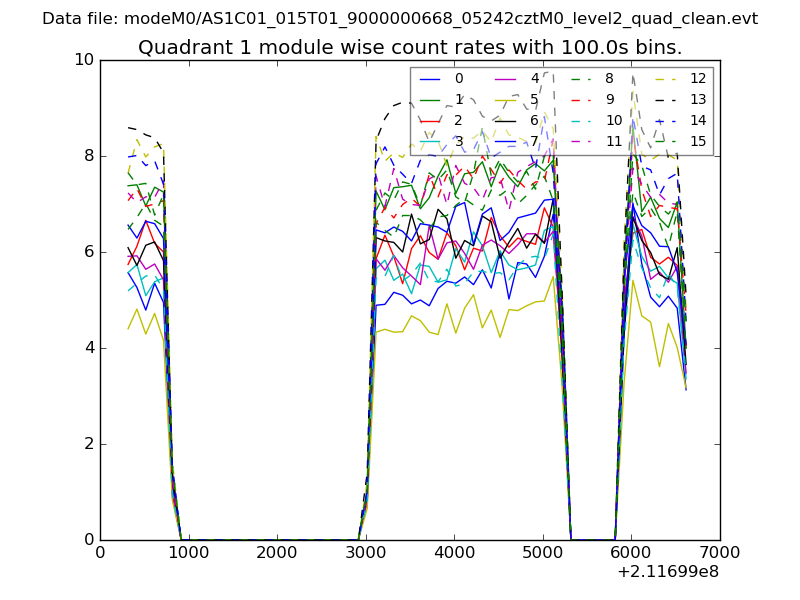
| Module-wise count rates for Quadrant A Data is divided into 100 sec bins |
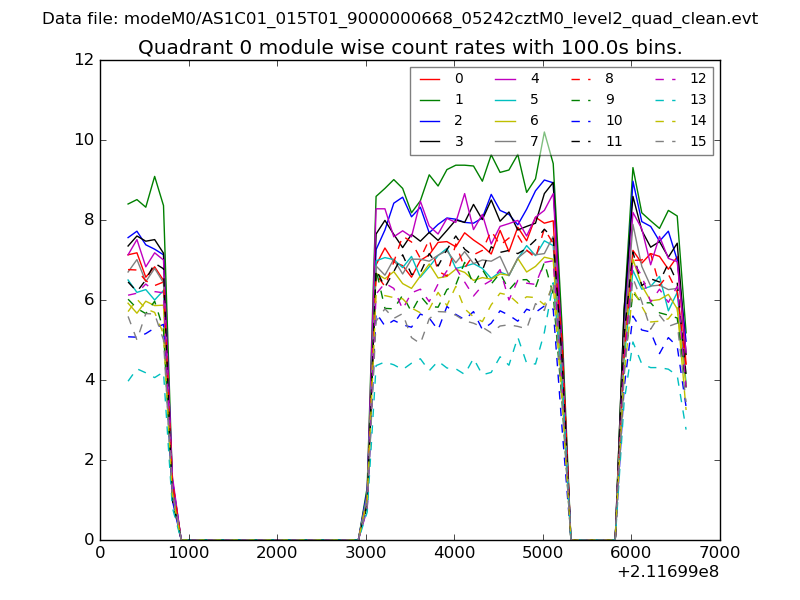 |
 |
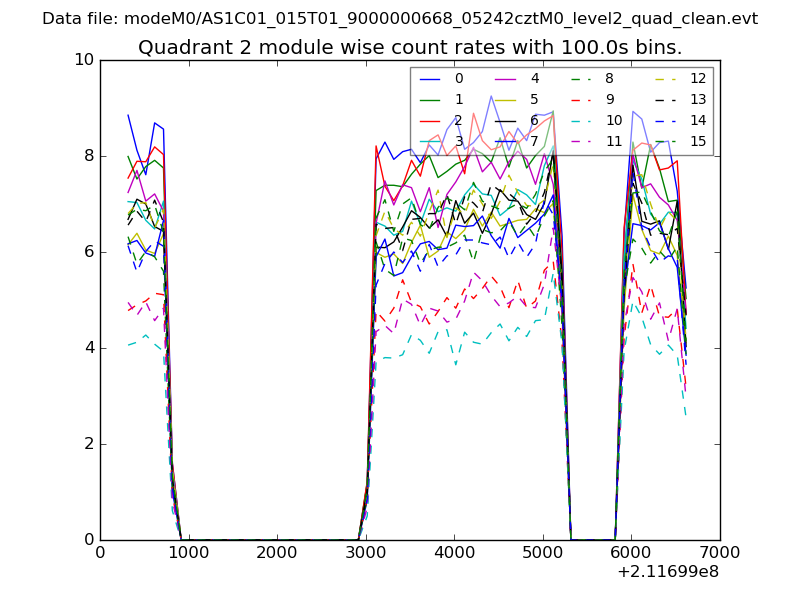
| Module-wise count rates for Quadrant B Data is divided into 100 sec bins |
 |
 |
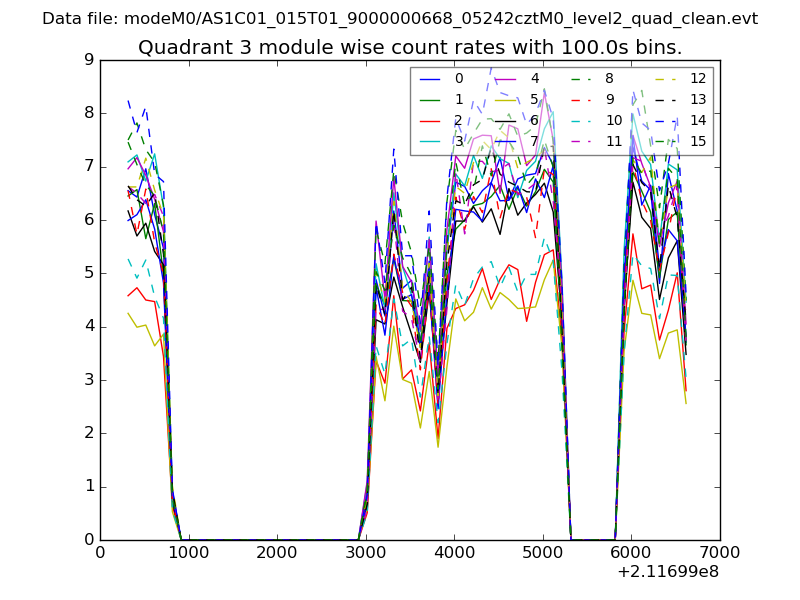
| Module-wise count rates for Quadrant C Data is divided into 100 sec bins |
 |
 |
| Module-wise count rates for Quadrant D Data is divided into 100 sec bins |
 |
 |
| Parameter | Plot |
|---|---|
| CZT HV Monitor | 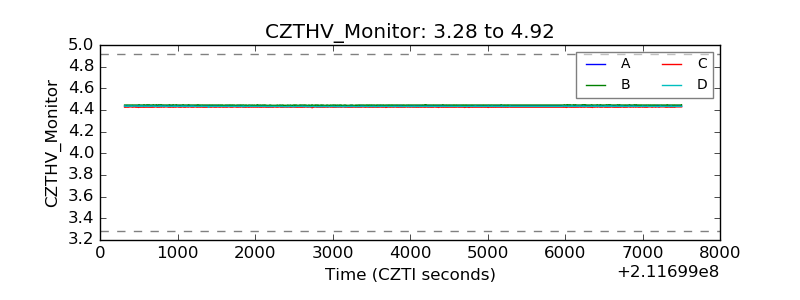 |
| D_VDD | 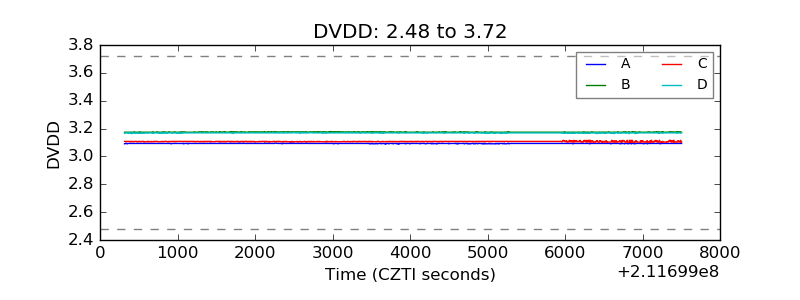 |
| Temperature 1 | 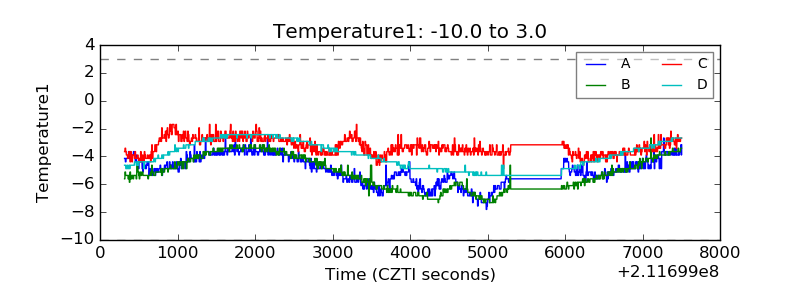 |
| Veto HV Monitor | 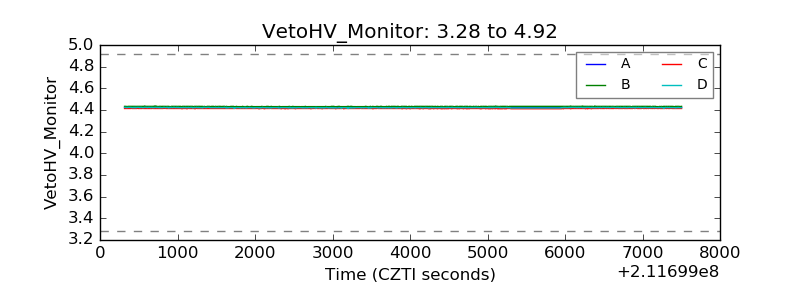 |
| Veto LLD | 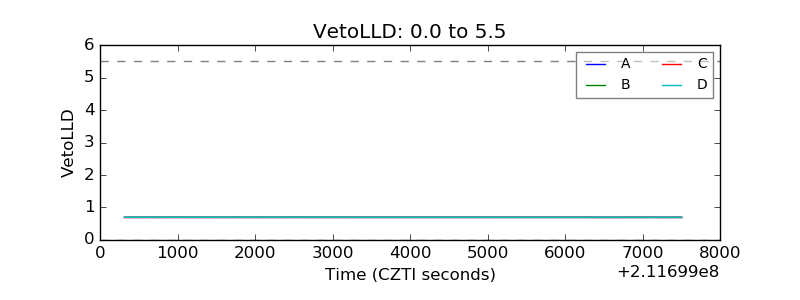 |
| Alpha Counter | 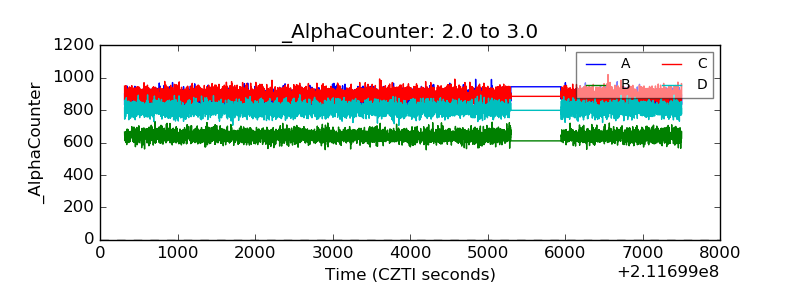 |
| _CPM_Rate | 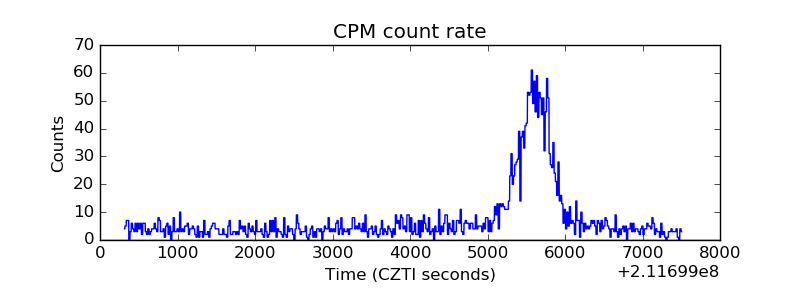 |
| CZT Counter | 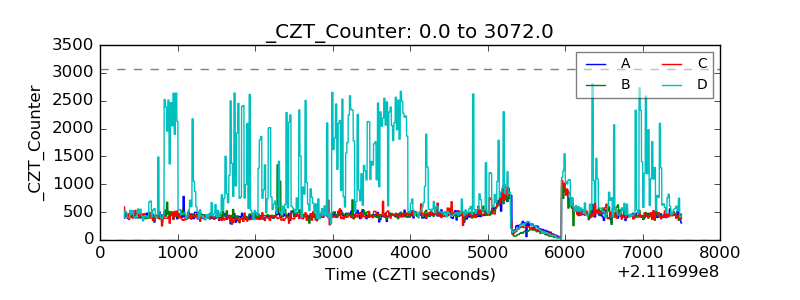 |
| +2.5 Volts monitor |  |
| +5 Volts monitor |  |
| _ROLL_ROT | 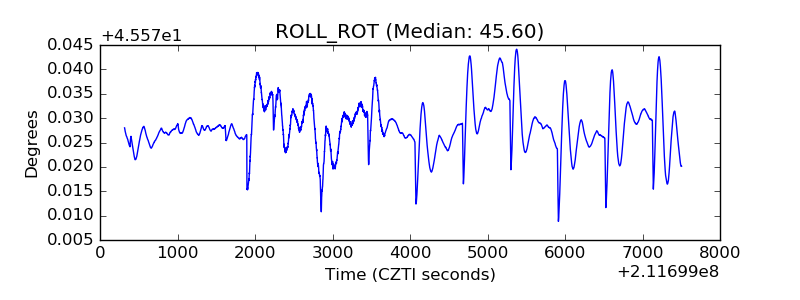 |
| _Roll_DEC | 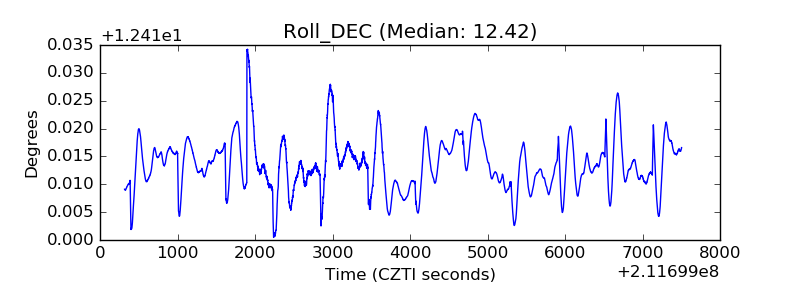 |
| _Roll_RA | 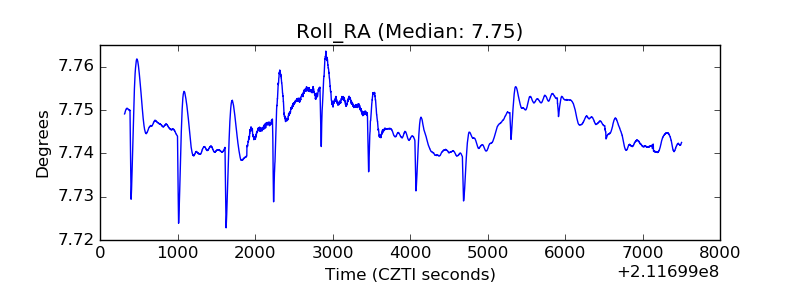 |
| Veto Counter | 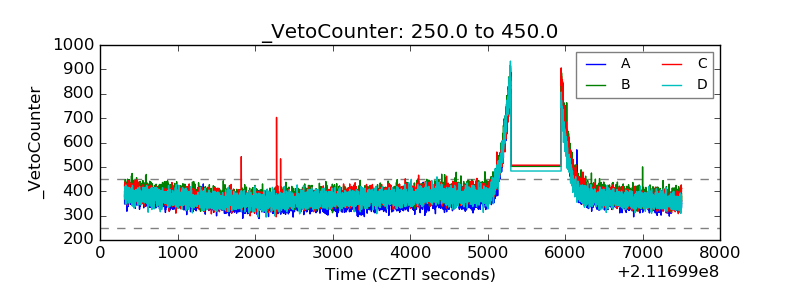 |