| Param | Original file | Final file |
|---|---|---|
| Filename | modeM0/AS1C01_015T01_9000000668_05243cztM0_level2.evt | modeM0/AS1C01_015T01_9000000668_05243cztM0_level2_quad_clean.evt |
| Size (bytes) | 588,781,440 | 68,135,040 |
| Size | 561.5 MB | 65.0 MB |
| Events in quadrant A | 3,381,638 | 402,073 |
| Events in quadrant B | 3,443,457 | 402,809 |
| Events in quadrant C | 3,370,721 | 396,119 |
| Events in quadrant D | 7,137,244 | 350,557 |
| Mode SS | |||
|---|---|---|---|
| Quadrant | BADHDUFLAG | Total packets | Discarded packets |
| A | 0 | 148 | 0 |
| B | 0 | 148 | 0 |
| C | 0 | 148 | 0 |
| D | 0 | 148 | 0 |
| Mode M9 | |||
|---|---|---|---|
| Quadrant | BADHDUFLAG | Total packets | Discarded packets |
| A | 0 | 3 | 0 |
| B | 0 | 3 | 0 |
| C | 0 | 3 | 0 |
| D | 0 | 3 | 0 |
| Mode M0 | |||
|---|---|---|---|
| Quadrant | BADHDUFLAG | Total packets | Discarded packets |
| A | 0 | 15127 | 2 |
| B | 0 | 15202 | 1 |
| C | 0 | 15215 | 1 |
| D | 0 | 26061 | 1 |
| Quadrant | Total seconds | Saturated seconds | Saturation percentage |
|---|---|---|---|
| A | 7342 | 150 | 2.043040% |
| B | 7342 | 138 | 1.879597% |
| C | 7342 | 100 | 1.362027% |
| D | 7342 | 1398 | 19.041133% |
Noise dominated data is calculated using 1-second bins in cleaned event files. If a bin has >2000 counts, and if more than 50% of those come from <1% of pixels, then it is considered to be noise-dominated and hence unusable.
| Quadrant | # 1 sec bins | Bins with >0 counts | Bins with >2000 counts | High rate bins dominated by noise | Noise dominated (total time) | Noise dominated (detector-on time) | Marked lightcurve |
|---|---|---|---|---|---|---|---|
| A | 7652 | 7343 | 0 | 0 | 0.00% | 0.00% | 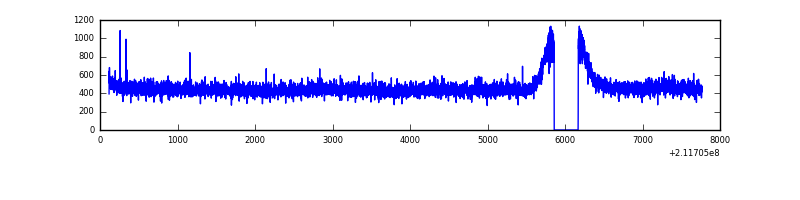 |
| B | 7652 | 7343 | 0 | 0 | 0.00% | 0.00% | 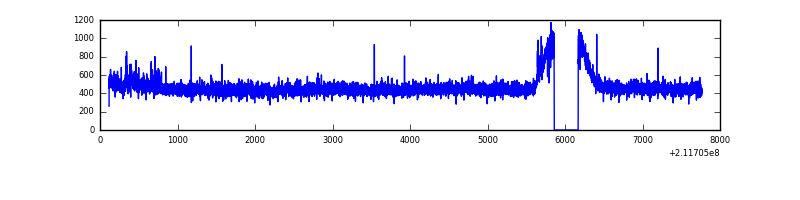 |
| C | 7652 | 7343 | 1 | 1 | 0.01% | 0.01% | 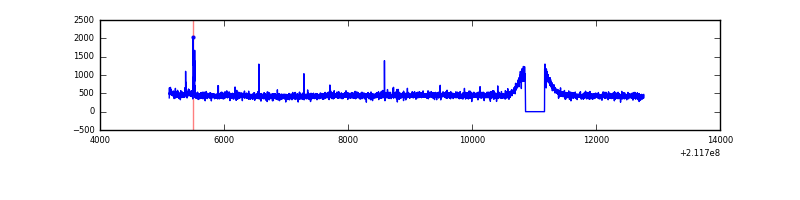 |
| D | 7652 | 7343 | 1053 | 1053 | 13.76% | 14.34% | 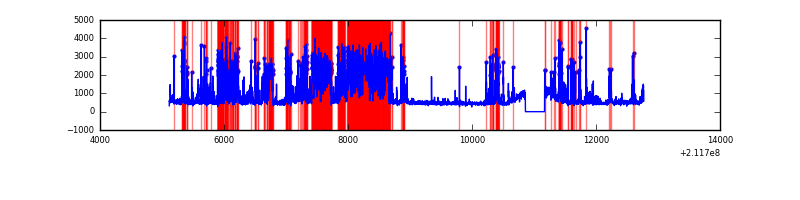 |
Top three noisy pixels from each quadrant. If the there are fewer than three noisy pixels in the level2.evt file, extra rows are filled as -1
| Pixel properties | Quadrant properties | ||||||
|---|---|---|---|---|---|---|---|
| Quadrant | DetID | PixID | Counts | Sigma | Mean | Median | Sigma |
| A | 13 | 14 | 8633 | 42.97 | 874 | 852 | 181.1 |
| A | 0 | 226 | 8463 | 42.03 | 874 | 852 | 181.1 |
| A | 12 | 194 | 8433 | 41.86 | 874 | 852 | 181.1 |
| B | 0 | 229 | 42603 | 240.85 | 876 | 854 | 173.3 |
| B | 12 | 111 | 17493 | 95.99 | 876 | 854 | 173.3 |
| B | 11 | 111 | 13771 | 74.52 | 876 | 854 | 173.3 |
| C | 8 | 128 | 23617 | 115.49 | 840 | 843 | 197.2 |
| C | 1 | 16 | 22686 | 110.77 | 840 | 843 | 197.2 |
| C | 7 | 159 | 17124 | 82.56 | 840 | 843 | 197.2 |
| D | 11 | 145 | 3828390 | 19963.66 | 779 | 755 | 191.7 |
| D | 8 | 195 | 310121 | 1613.55 | 779 | 755 | 191.7 |
| D | 2 | 136 | 42817 | 219.38 | 779 | 755 | 191.7 |
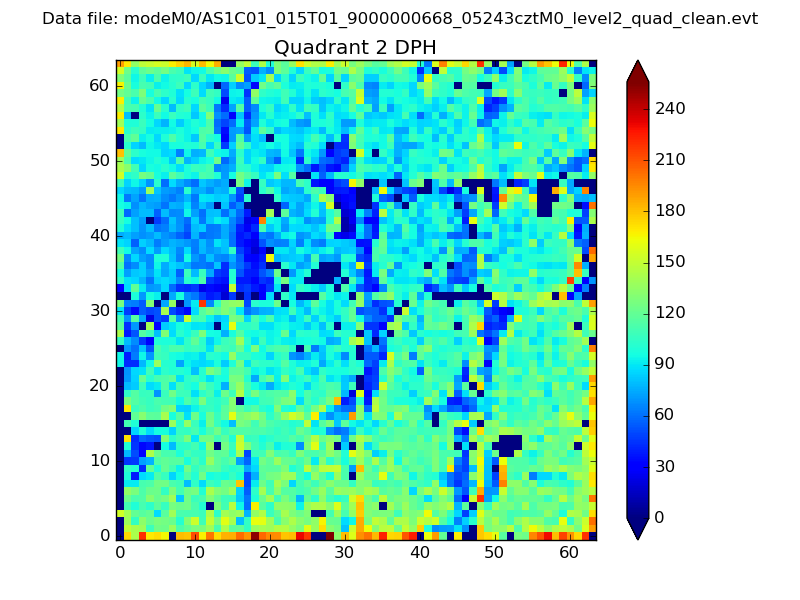
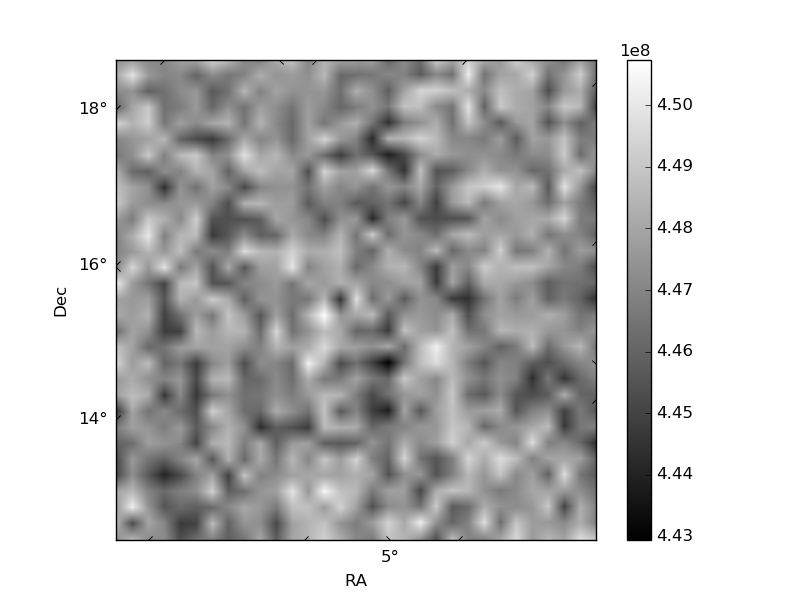
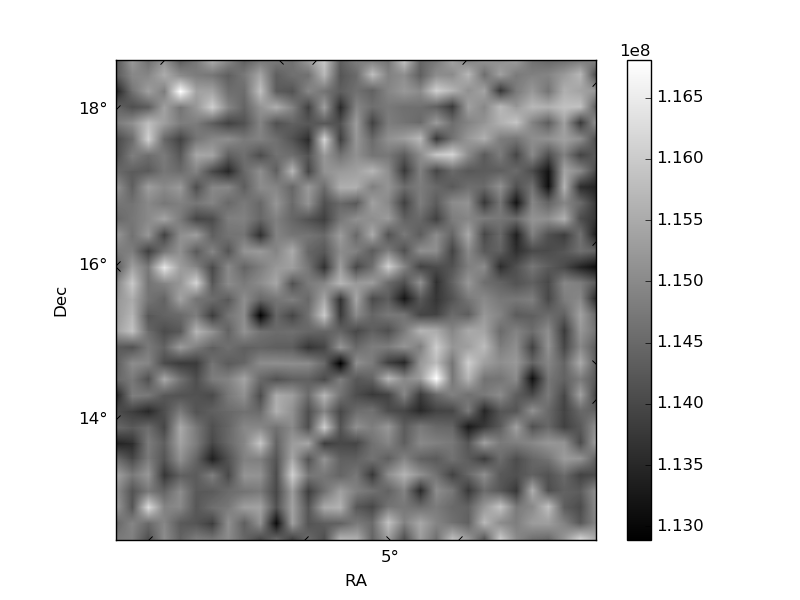
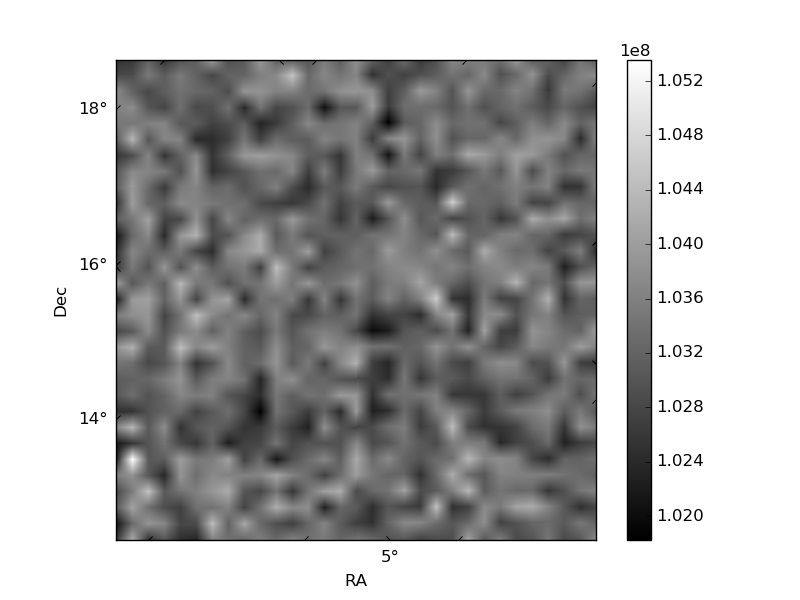
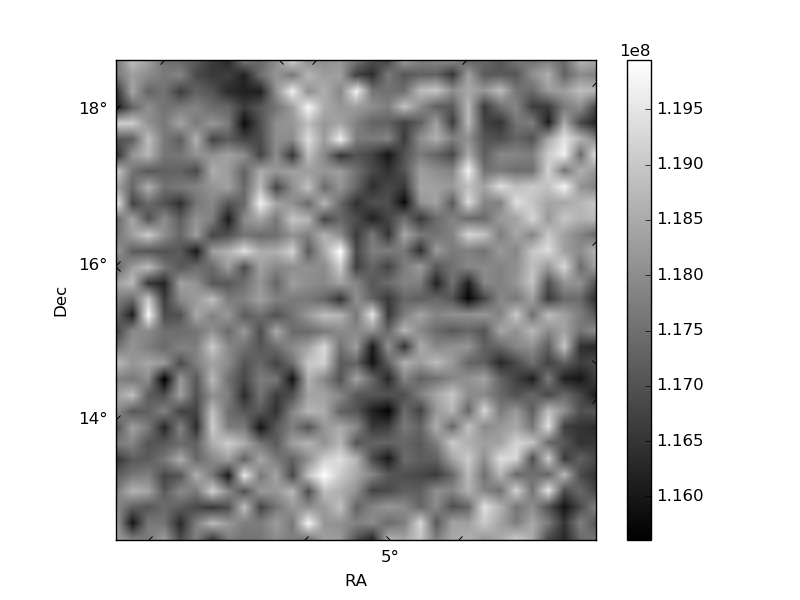
Histogram calculated using DETX and DETY for each event in the final _common_clean file
| Quadrant A | 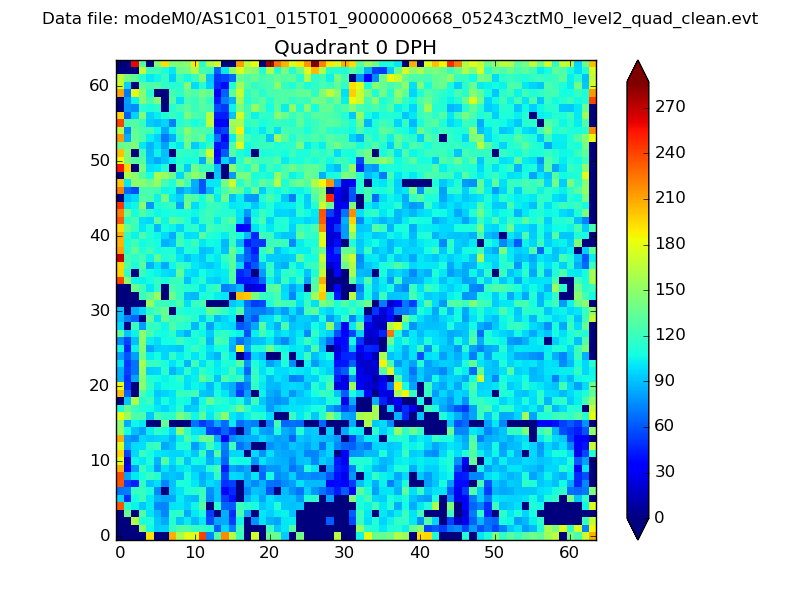 |
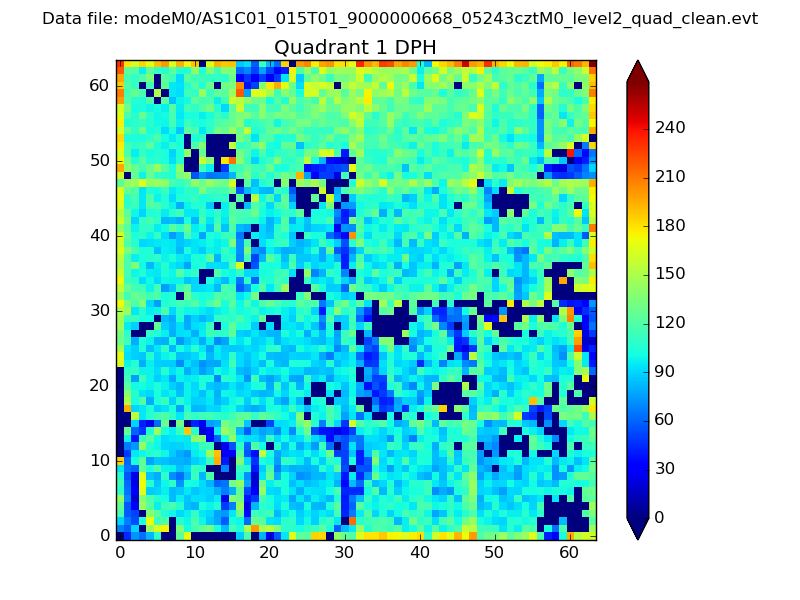 |
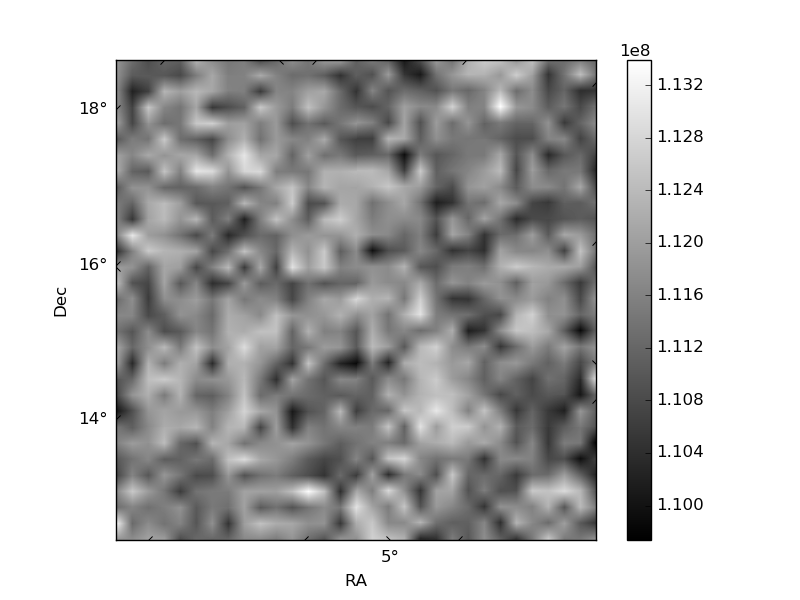
Quadrant B |
|---|---|---|---|
| Quadrant D | 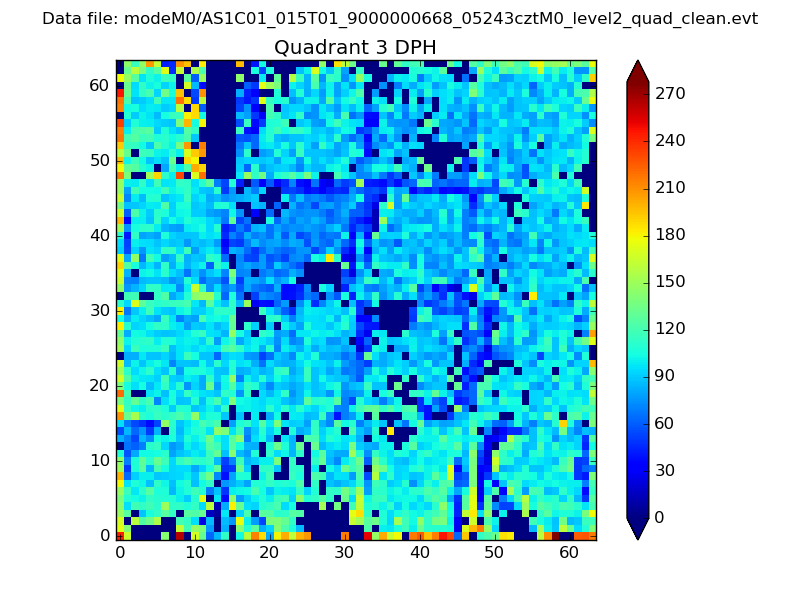 |
 |
Quadrant C |
| Plot type | Count rate plots | Images |
|---|---|---|
| Comparison with Poisson distribution Blue bars denote a histogram of data divided into 1 sec bins. Red curve is a Poisson curve with rate = median count rate of data. |
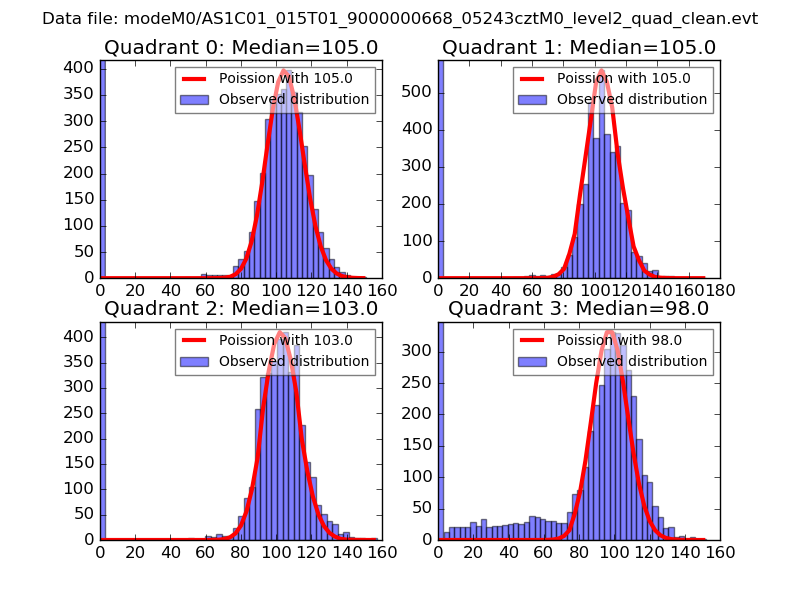 |
 |
| Quadrant-wise count rates Data is divided into 100 sec bins |
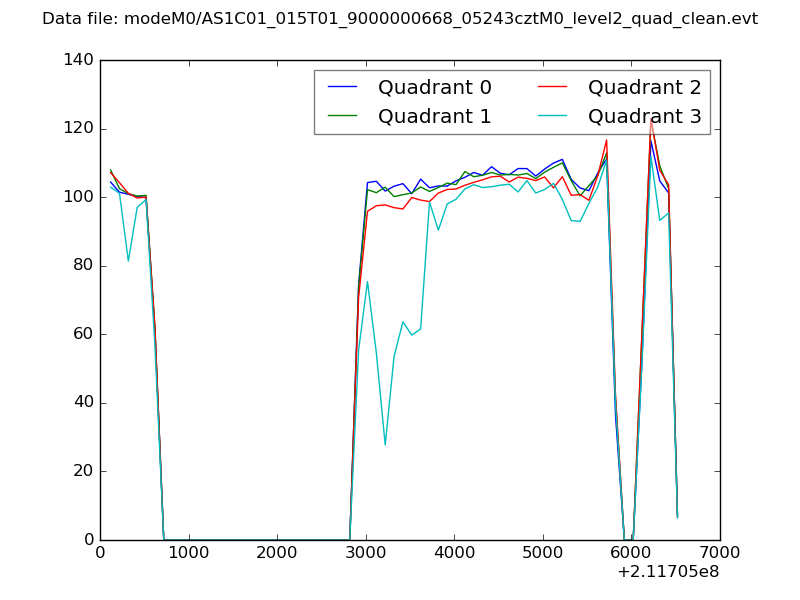 |
|
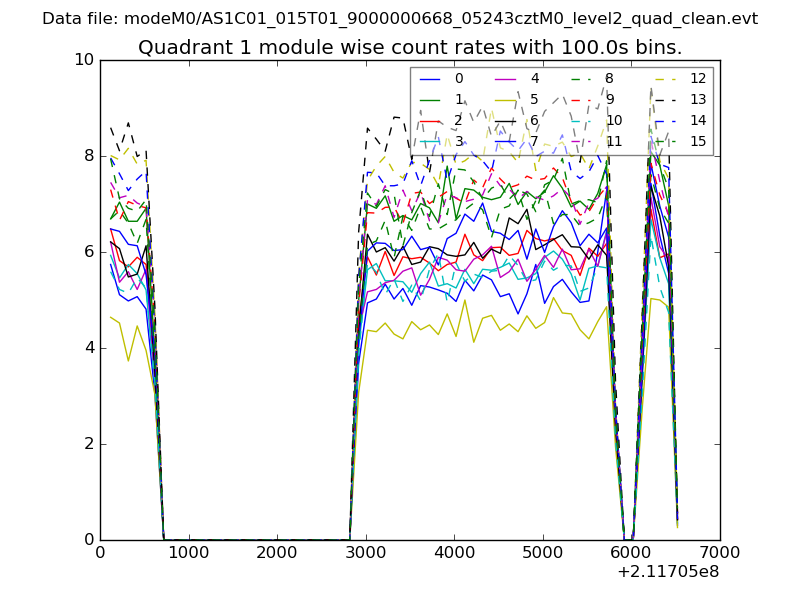
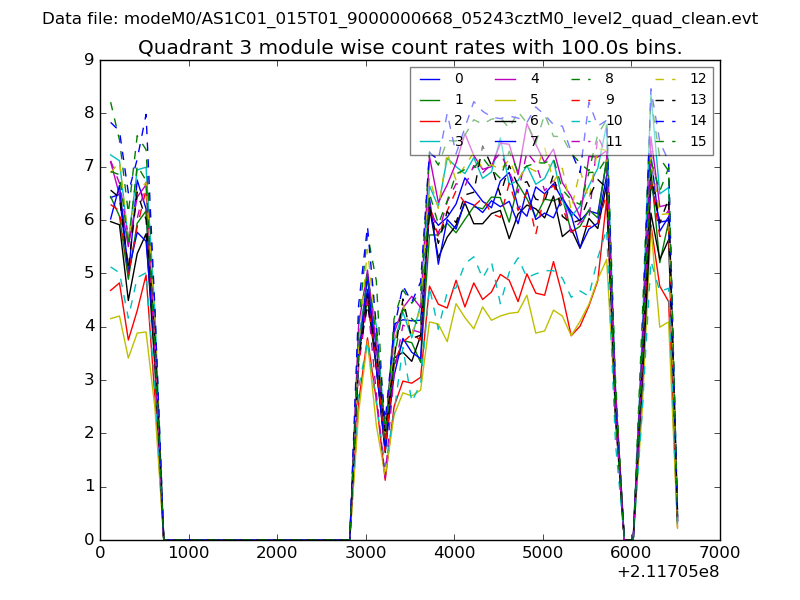
| Module-wise count rates for Quadrant A Data is divided into 100 sec bins |
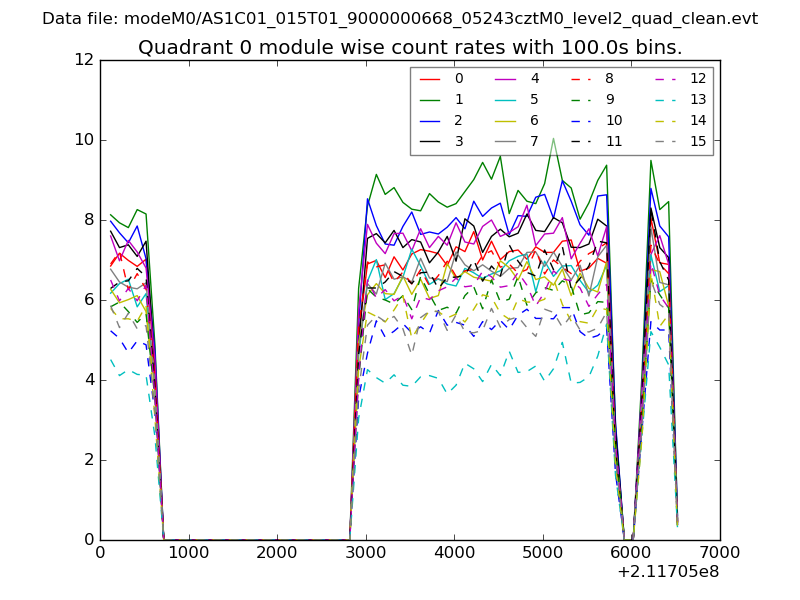 |
 |
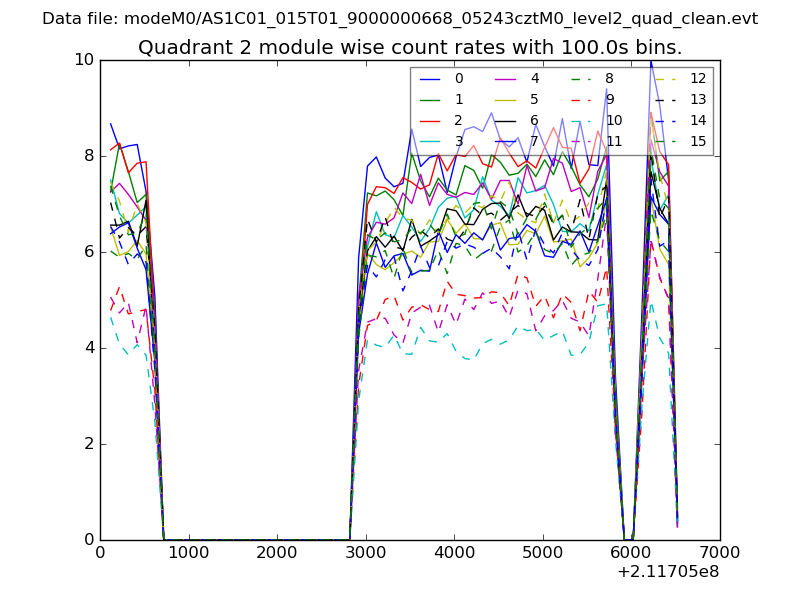
| Module-wise count rates for Quadrant B Data is divided into 100 sec bins |
 |
 |
| Module-wise count rates for Quadrant C Data is divided into 100 sec bins |
 |
 |
| Module-wise count rates for Quadrant D Data is divided into 100 sec bins |
 |
 |
| Parameter | Plot |
|---|---|
| CZT HV Monitor | 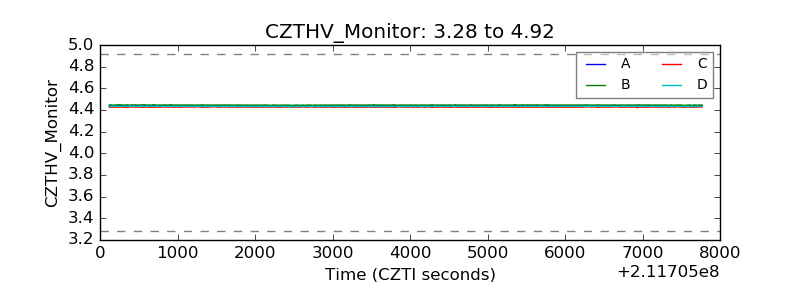 |
| D_VDD | 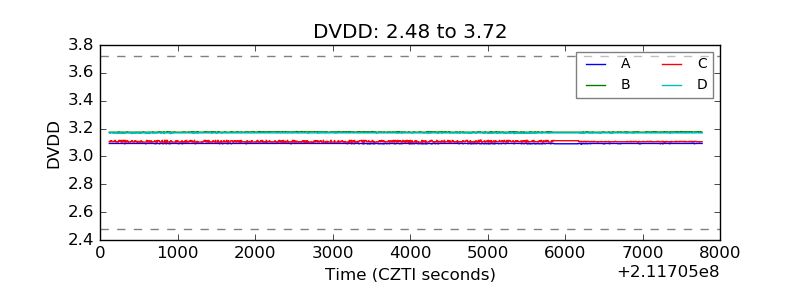 |
| Temperature 1 | 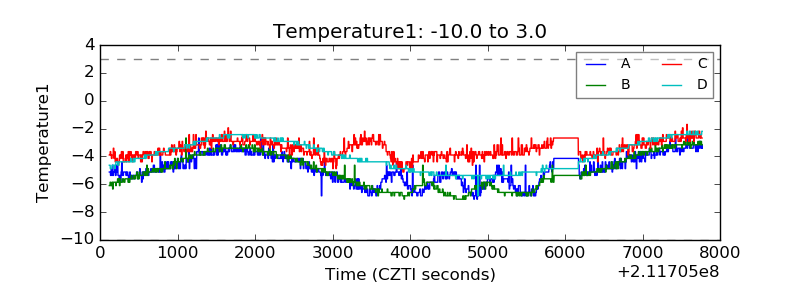 |
| Veto HV Monitor | 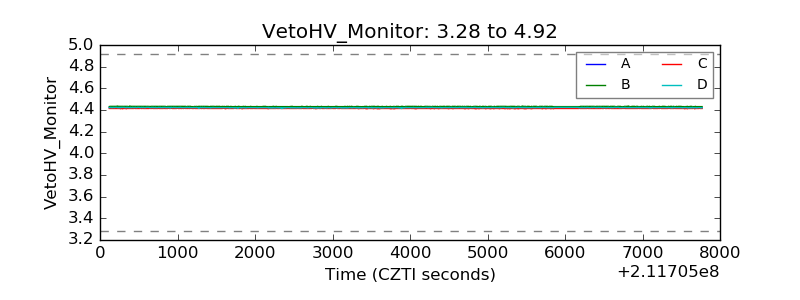 |
| Veto LLD | 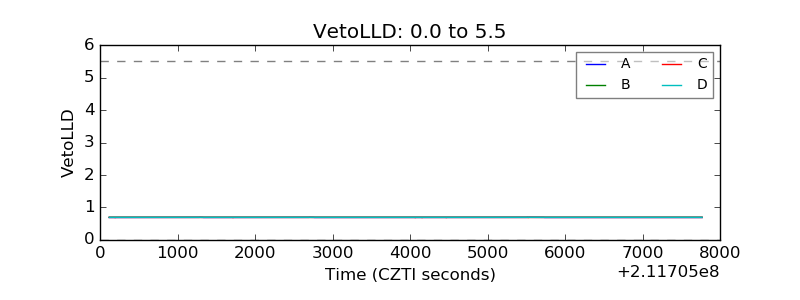 |
| Alpha Counter | 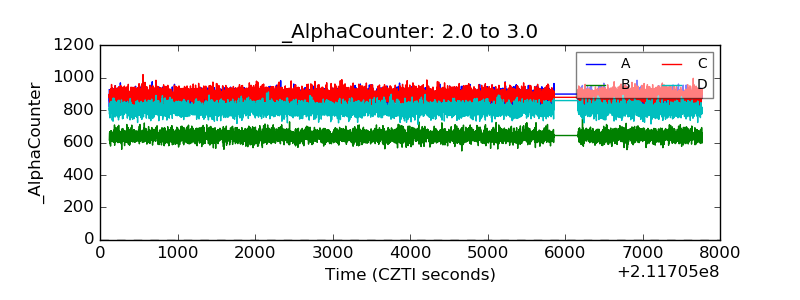 |
| _CPM_Rate | 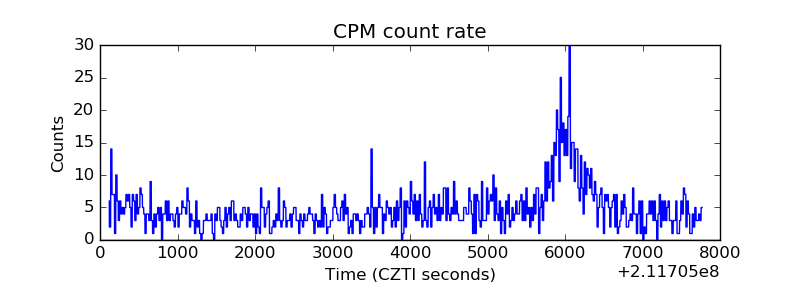 |
| CZT Counter | 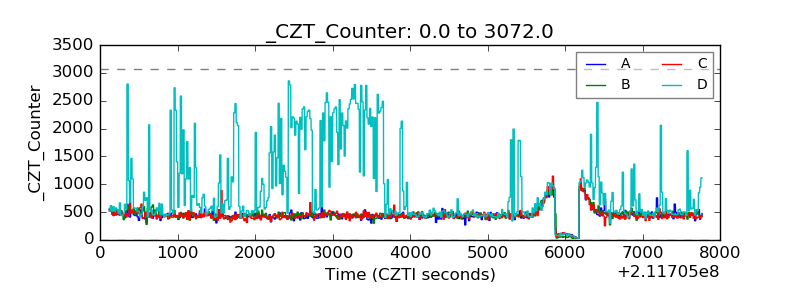 |
| +2.5 Volts monitor |  |
| +5 Volts monitor |  |
| _ROLL_ROT | 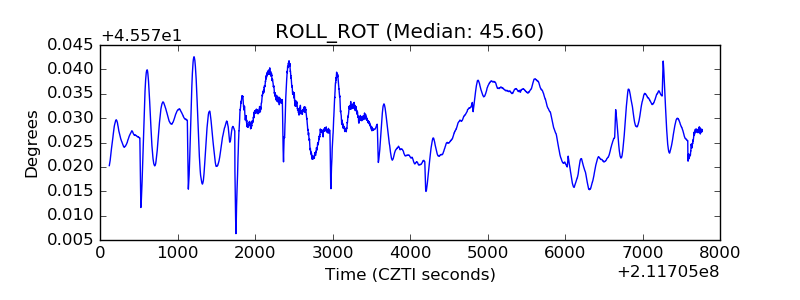 |
| _Roll_DEC | 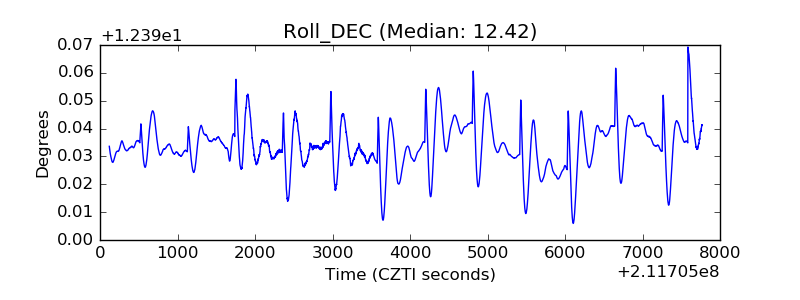 |
| _Roll_RA | 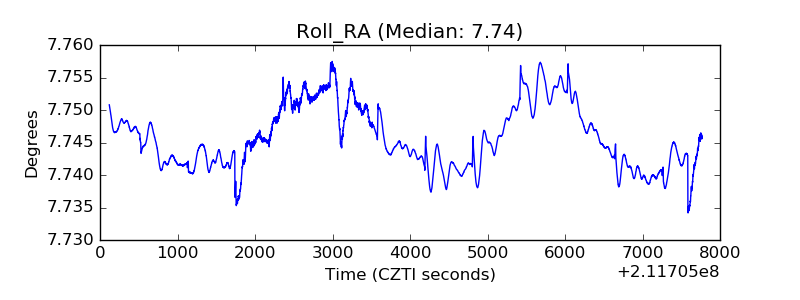 |
| Veto Counter | 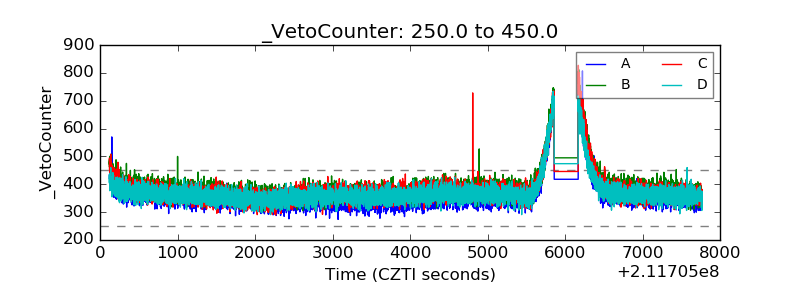 |