| Param | Original file | Final file |
|---|---|---|
| Filename | modeM0/AS1C01_015T01_9000000668_05244cztM0_level2.evt | modeM0/AS1C01_015T01_9000000668_05244cztM0_level2_quad_clean.evt |
| Size (bytes) | 616,570,560 | 77,339,520 |
| Size | 588.0 MB | 73.8 MB |
| Events in quadrant A | 3,942,152 | 454,643 |
| Events in quadrant B | 3,985,654 | 453,318 |
| Events in quadrant C | 3,893,606 | 446,762 |
| Events in quadrant D | 6,292,840 | 414,509 |
| Mode SS | |||
|---|---|---|---|
| Quadrant | BADHDUFLAG | Total packets | Discarded packets |
| A | 0 | 170 | 0 |
| B | 0 | 170 | 0 |
| C | 0 | 170 | 0 |
| D | 0 | 170 | 0 |
| Mode M9 | |||
|---|---|---|---|
| Quadrant | BADHDUFLAG | Total packets | Discarded packets |
| A | 0 | 4 | 0 |
| B | 0 | 4 | 0 |
| C | 0 | 4 | 0 |
| D | 0 | 4 | 0 |
| Mode M0 | |||
|---|---|---|---|
| Quadrant | BADHDUFLAG | Total packets | Discarded packets |
| A | 0 | 17427 | 3 |
| B | 0 | 17453 | 2 |
| C | 0 | 17508 | 2 |
| D | 0 | 24141 | 2 |
| Quadrant | Total seconds | Saturated seconds | Saturation percentage |
|---|---|---|---|
| A | 8226 | 346 | 4.206176% |
| B | 8226 | 338 | 4.108923% |
| C | 8226 | 271 | 3.294432% |
| D | 8226 | 863 | 10.491126% |
Noise dominated data is calculated using 1-second bins in cleaned event files. If a bin has >2000 counts, and if more than 50% of those come from <1% of pixels, then it is considered to be noise-dominated and hence unusable.
| Quadrant | # 1 sec bins | Bins with >0 counts | Bins with >2000 counts | High rate bins dominated by noise | Noise dominated (total time) | Noise dominated (detector-on time) | Marked lightcurve |
|---|---|---|---|---|---|---|---|
| A | 8636 | 8228 | 0 | 0 | 0.00% | 0.00% | 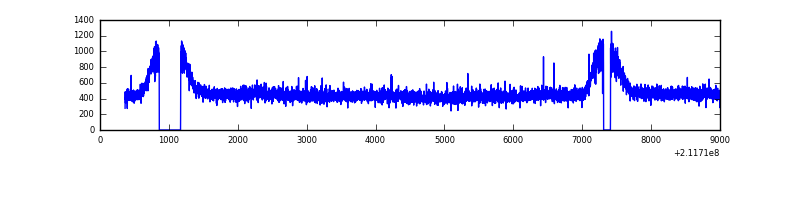 |
| B | 8636 | 8228 | 0 | 0 | 0.00% | 0.00% | 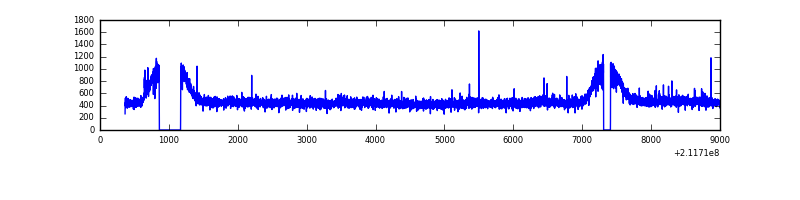 |
| C | 8636 | 8228 | 0 | 0 | 0.00% | 0.00% | 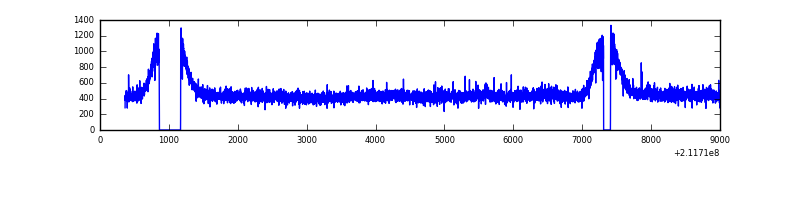 |
| D | 8636 | 8228 | 415 | 415 | 4.81% | 5.04% | 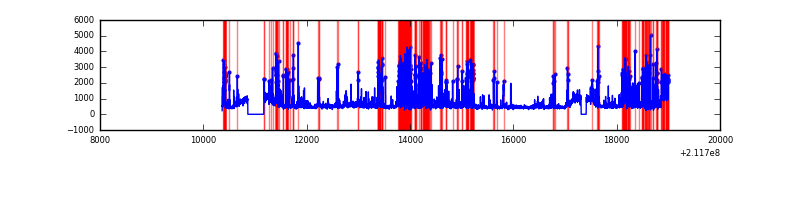 |
Top three noisy pixels from each quadrant. If the there are fewer than three noisy pixels in the level2.evt file, extra rows are filled as -1
| Pixel properties | Quadrant properties | ||||||
|---|---|---|---|---|---|---|---|
| Quadrant | DetID | PixID | Counts | Sigma | Mean | Median | Sigma |
| A | 13 | 14 | 14794 | 65.16 | 1019 | 995 | 211.8 |
| A | 12 | 194 | 9946 | 42.27 | 1019 | 995 | 211.8 |
| A | 0 | 226 | 9793 | 41.55 | 1019 | 995 | 211.8 |
| B | 12 | 111 | 20480 | 96.16 | 1020 | 993 | 202.7 |
| B | 11 | 111 | 16058 | 74.34 | 1020 | 993 | 202.7 |
| B | 0 | 219 | 12292 | 55.75 | 1020 | 993 | 202.7 |
| C | 1 | 16 | 40202 | 169.69 | 982 | 987 | 231.1 |
| C | 13 | 61 | 7940 | 30.09 | 982 | 987 | 231.1 |
| C | 8 | 128 | 7877 | 29.81 | 982 | 987 | 231.1 |
| D | 11 | 145 | 1972301 | 8196.49 | 965 | 934 | 240.5 |
| D | 8 | 195 | 343971 | 1426.27 | 965 | 934 | 240.5 |
| D | 2 | 16 | 224979 | 931.53 | 965 | 934 | 240.5 |
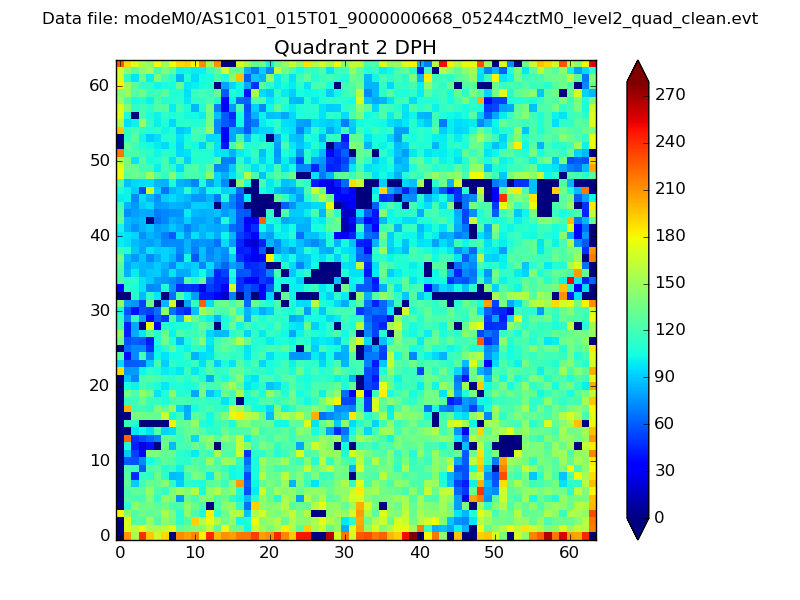
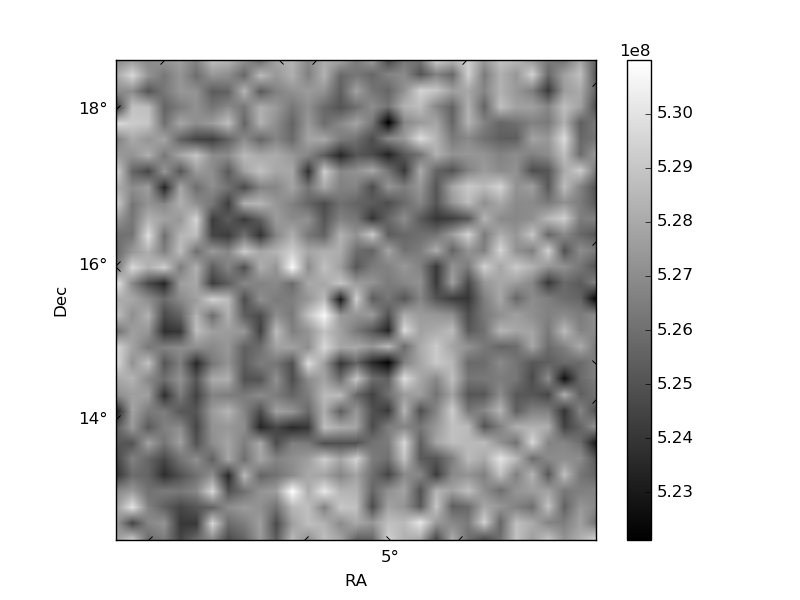
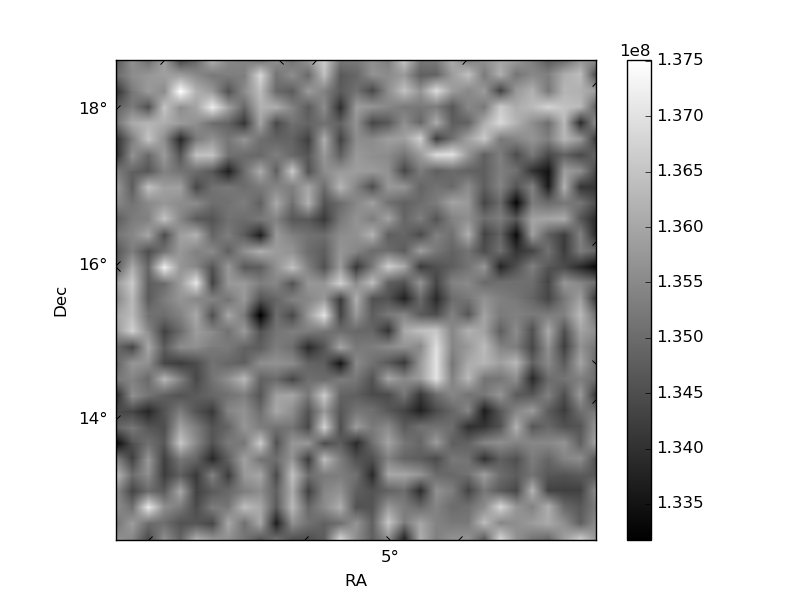
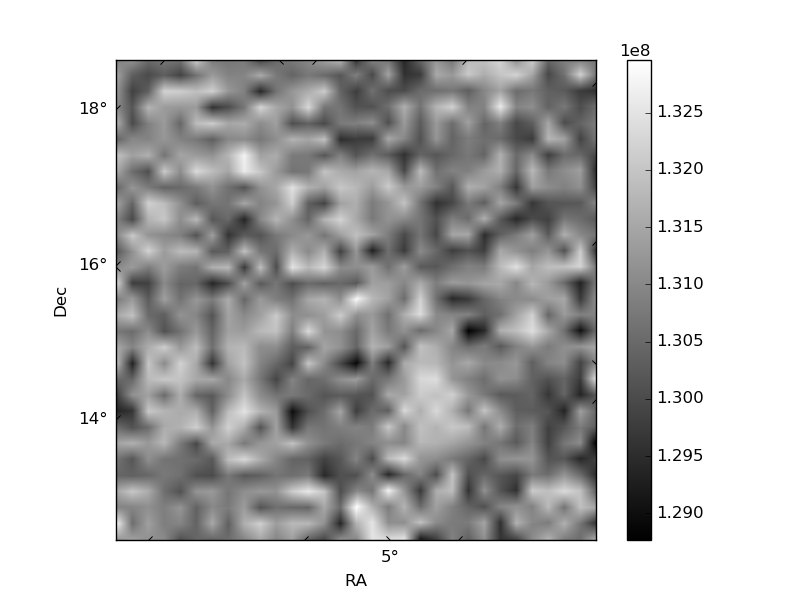
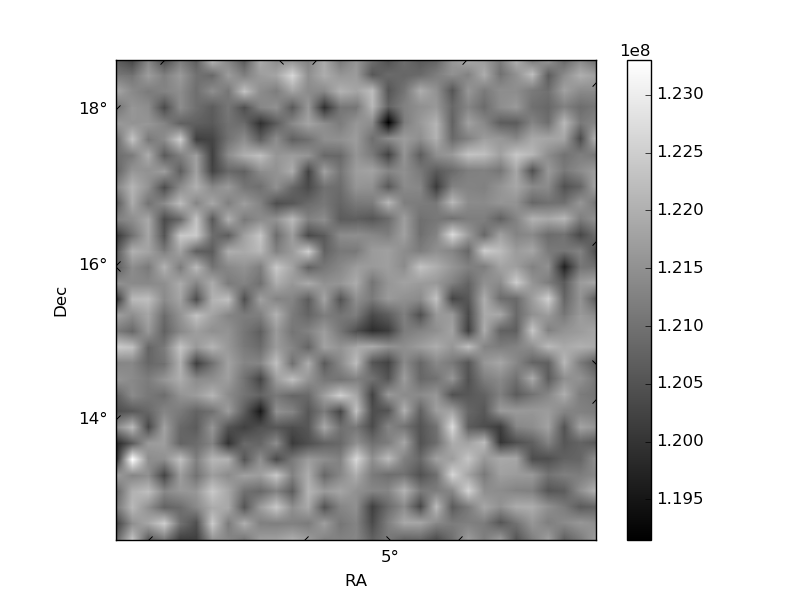
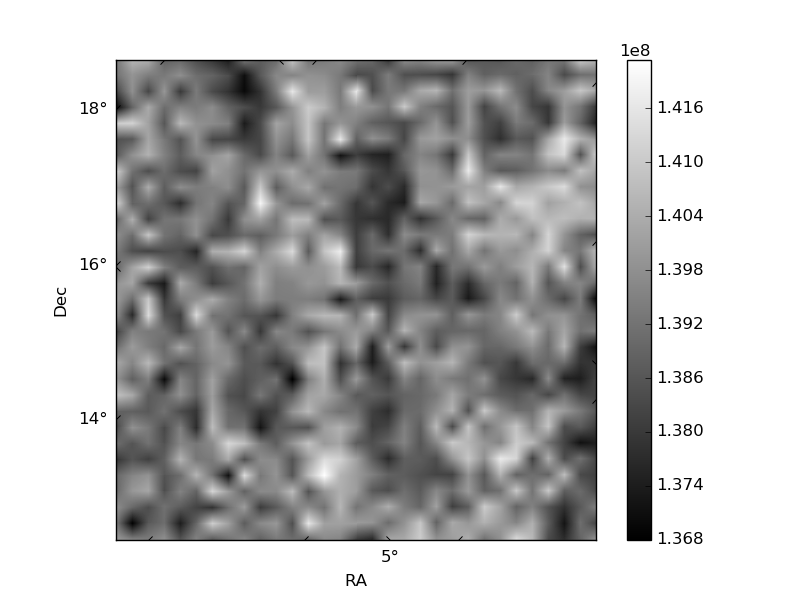
Histogram calculated using DETX and DETY for each event in the final _common_clean file
| Quadrant A | 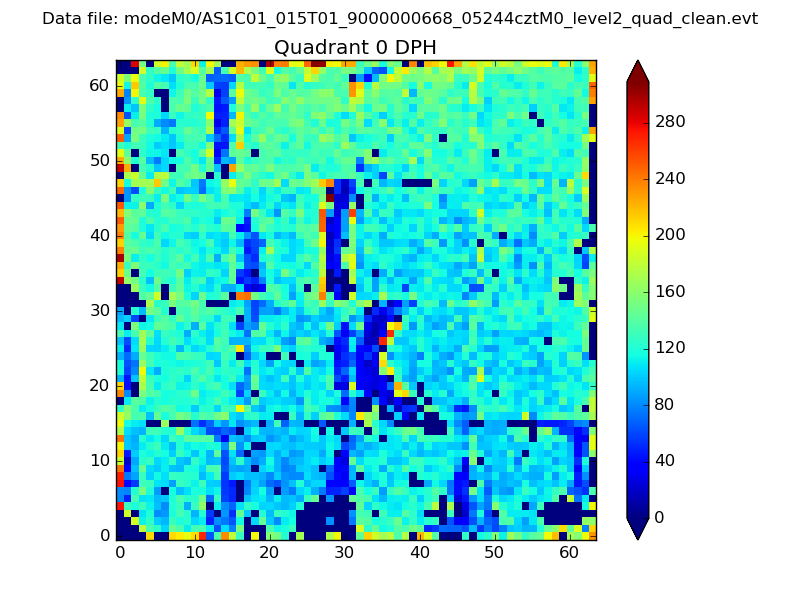 |
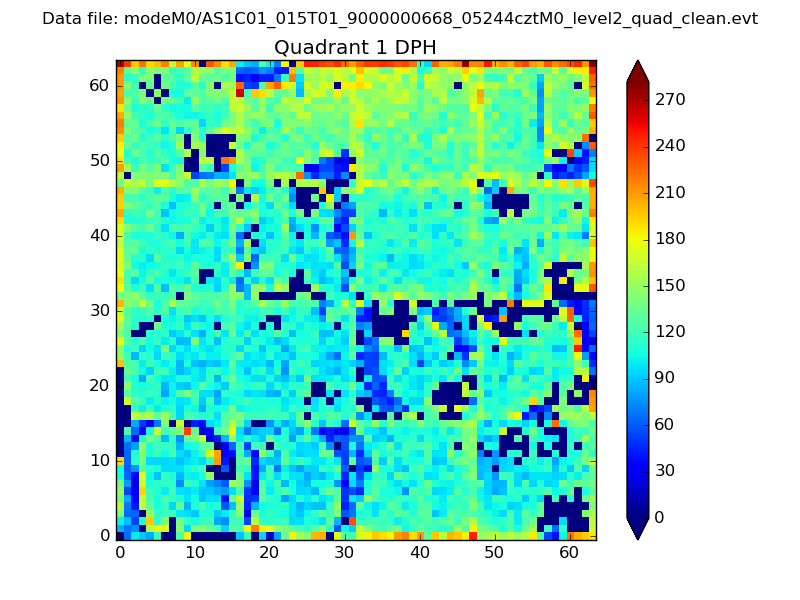 |
Quadrant B |
|---|---|---|---|
| Quadrant D | 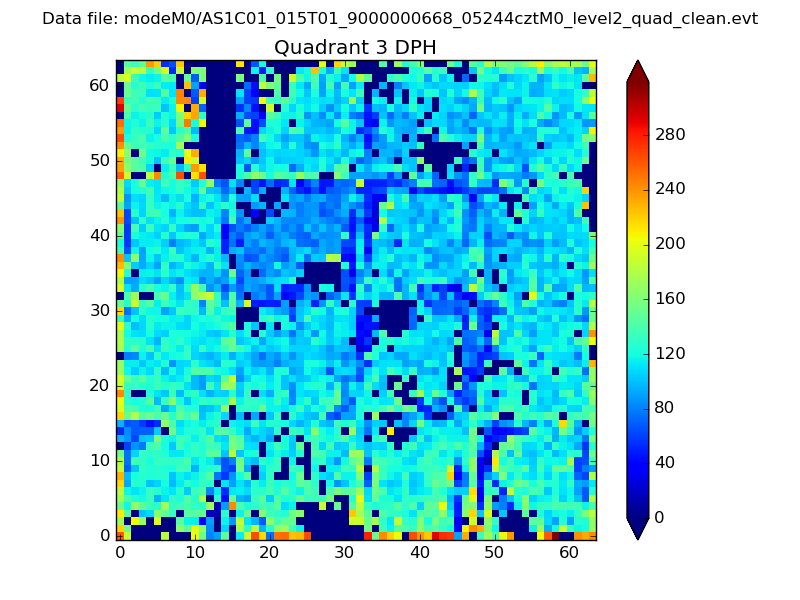 |
 |
Quadrant C |
| Plot type | Count rate plots | Images |
|---|---|---|
| Comparison with Poisson distribution Blue bars denote a histogram of data divided into 1 sec bins. Red curve is a Poisson curve with rate = median count rate of data. |
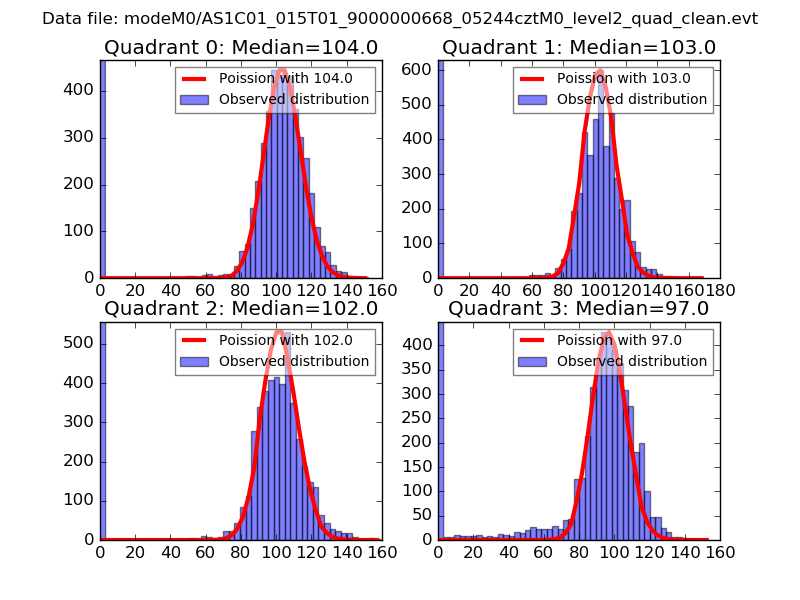 |
 |
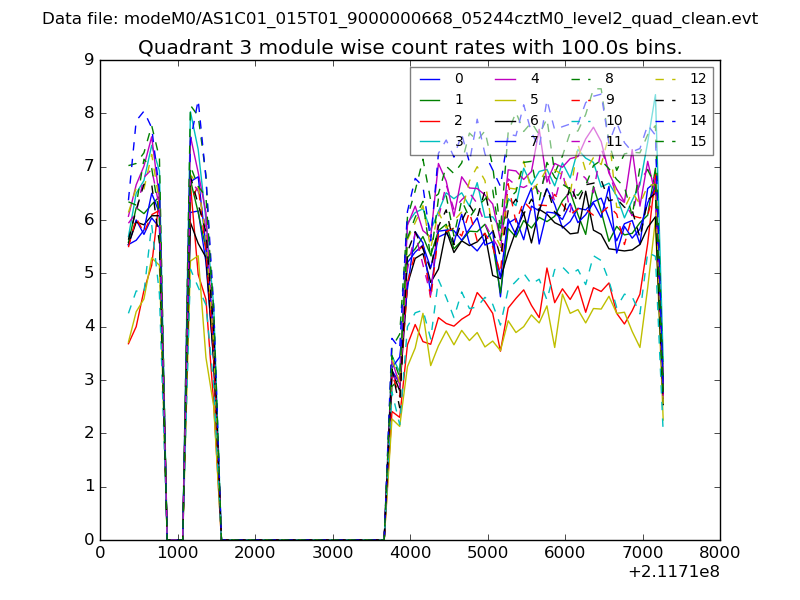
| Quadrant-wise count rates Data is divided into 100 sec bins |
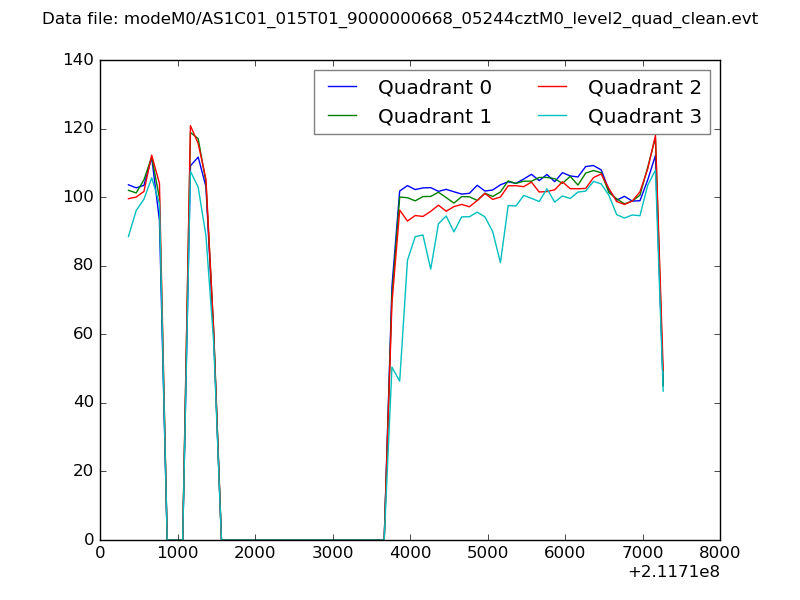 |
|
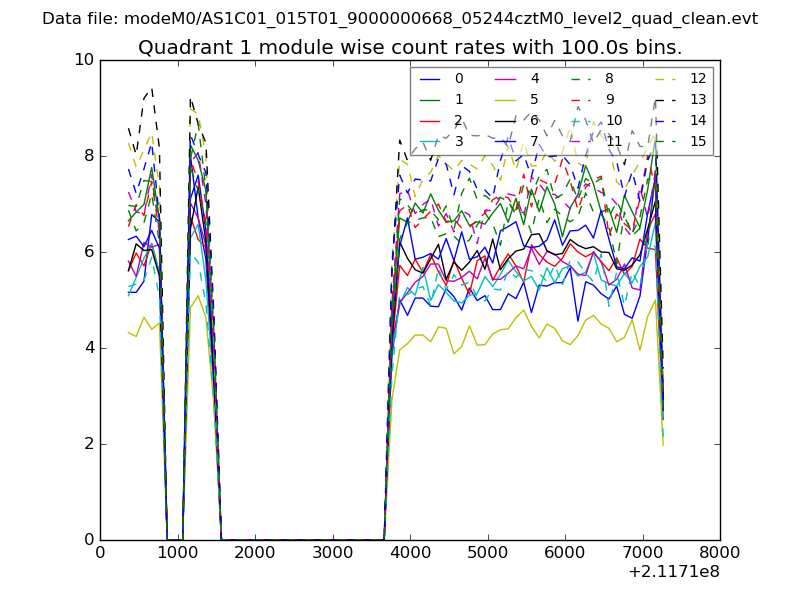
| Module-wise count rates for Quadrant A Data is divided into 100 sec bins |
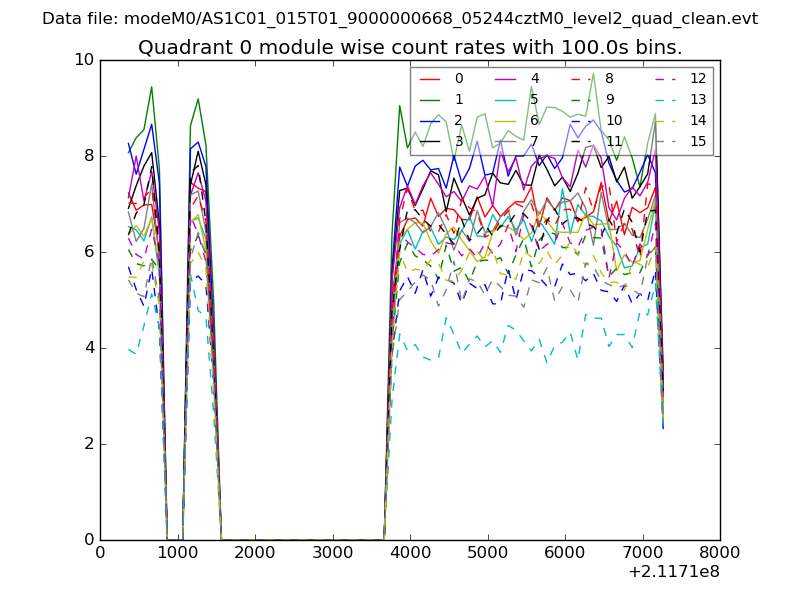 |
 |
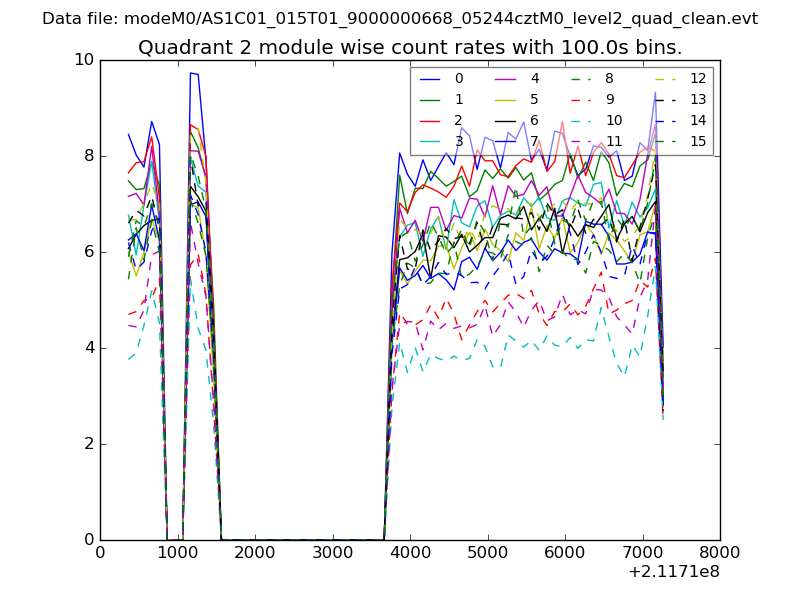
| Module-wise count rates for Quadrant B Data is divided into 100 sec bins |
 |
 |
| Module-wise count rates for Quadrant C Data is divided into 100 sec bins |
 |
 |
| Module-wise count rates for Quadrant D Data is divided into 100 sec bins |
 |
 |
| Parameter | Plot |
|---|---|
| CZT HV Monitor | 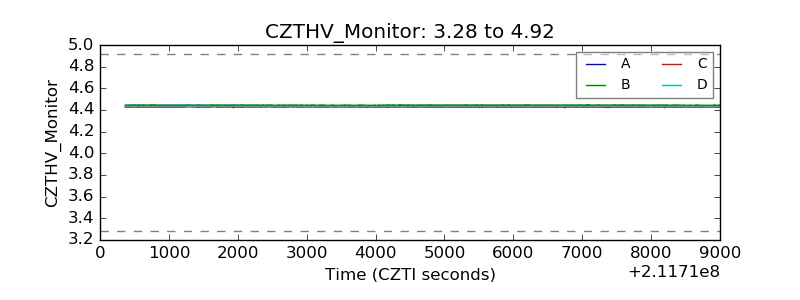 |
| D_VDD |  |
| Temperature 1 | 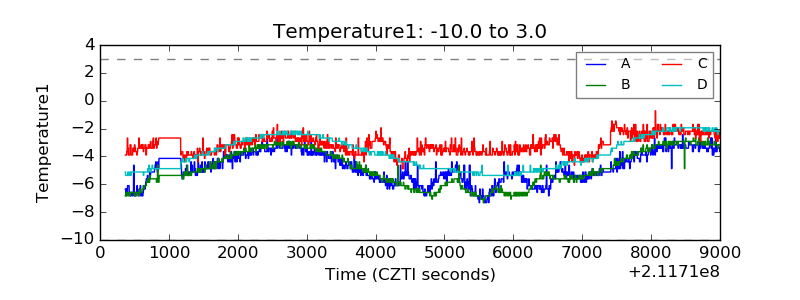 |
| Veto HV Monitor | 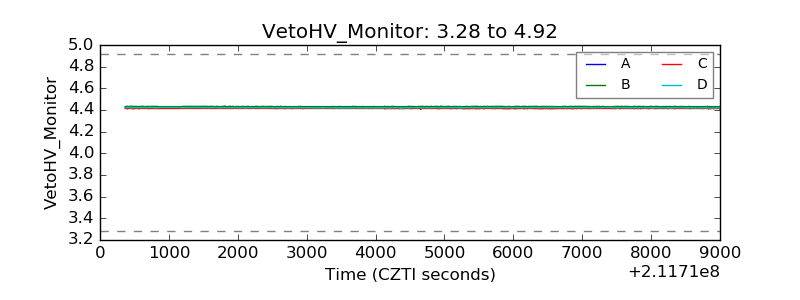 |
| Veto LLD | 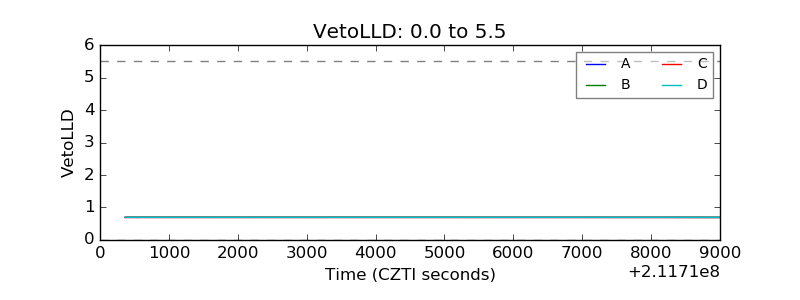 |
| Alpha Counter | 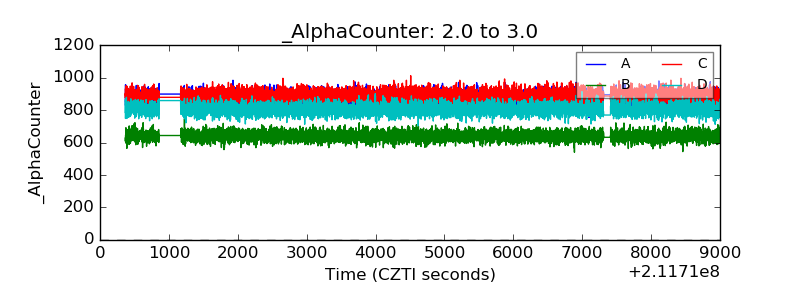 |
| _CPM_Rate | 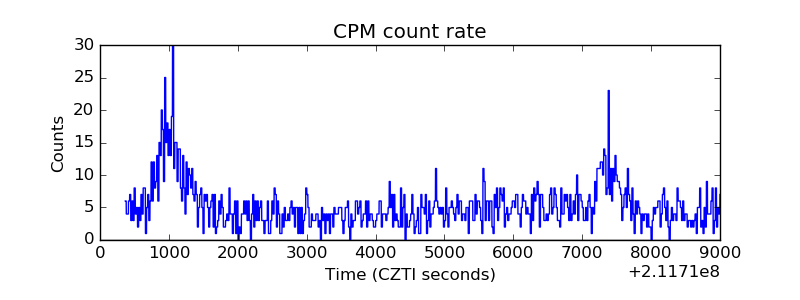 |
| CZT Counter | 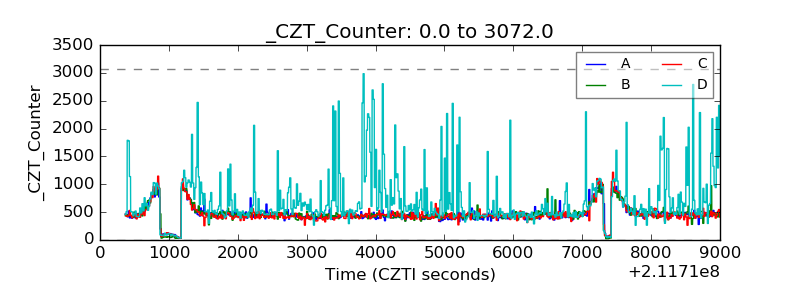 |
| +2.5 Volts monitor |  |
| +5 Volts monitor |  |
| _ROLL_ROT | 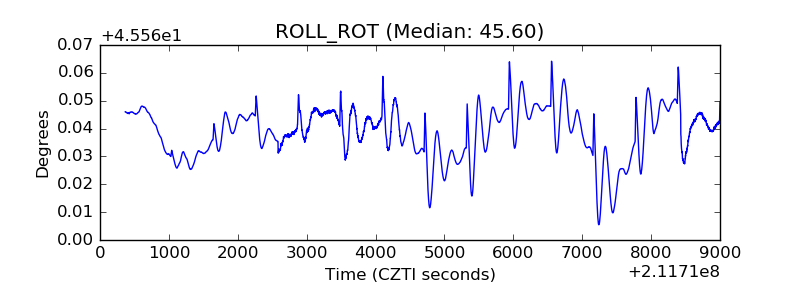 |
| _Roll_DEC | 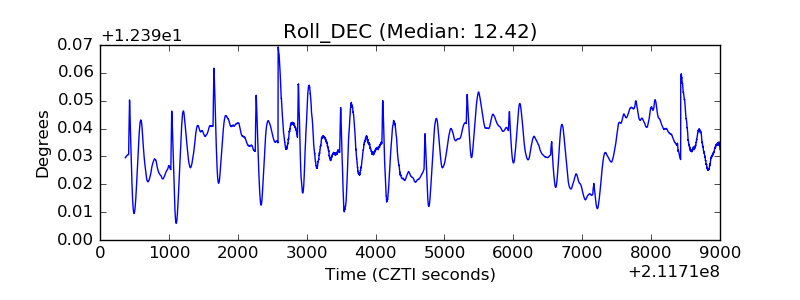 |
| _Roll_RA | 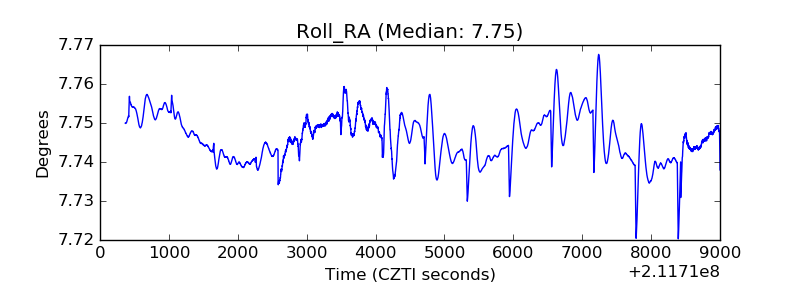 |
| Veto Counter | 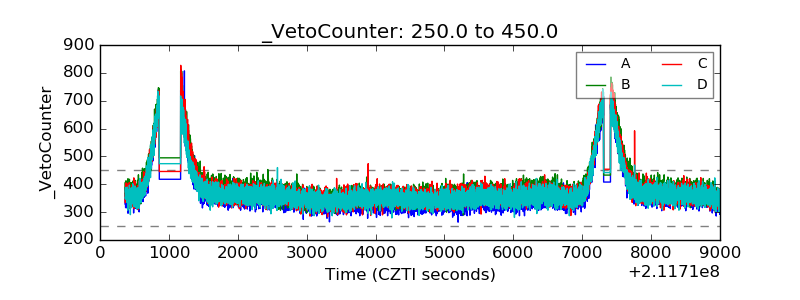 |