| Param | Original file | Final file |
|---|---|---|
| Filename | modeM0/AS1G05_258T01_9000000666_05226cztM0_level2.evt | modeM0/AS1G05_258T01_9000000666_05226cztM0_level2_quad_clean.evt |
| Size (bytes) | 465,906,240 | 91,123,200 |
| Size | 444.3 MB | 86.9 MB |
| Events in quadrant A | 2,616,662 | 610,198 |
| Events in quadrant B | 2,727,529 | 624,605 |
| Events in quadrant C | 2,434,895 | 606,259 |
| Events in quadrant D | 5,942,977 | 519,023 |
| Mode M0 | |||
|---|---|---|---|
| Quadrant | BADHDUFLAG | Total packets | Discarded packets |
| A | 0 | 11938 | 2 |
| B | 0 | 12065 | 1 |
| C | 0 | 11579 | 1 |
| D | 0 | 21675 | 1 |
| Mode M9 | |||
|---|---|---|---|
| Quadrant | BADHDUFLAG | Total packets | Discarded packets |
| A | 0 | 12 | 0 |
| B | 0 | 12 | 0 |
| C | 0 | 12 | 0 |
| D | 0 | 12 | 0 |
| Mode SS | |||
|---|---|---|---|
| Quadrant | BADHDUFLAG | Total packets | Discarded packets |
| A | 0 | 116 | 0 |
| B | 0 | 116 | 0 |
| C | 0 | 116 | 0 |
| D | 0 | 116 | 0 |
| Quadrant | Total seconds | Saturated seconds | Saturation percentage |
|---|---|---|---|
| A | 5707 | 49 | 0.858595% |
| B | 5707 | 52 | 0.911162% |
| C | 5707 | 9 | 0.157701% |
| D | 5707 | 1060 | 18.573681% |
Noise dominated data is calculated using 1-second bins in cleaned event files. If a bin has >2000 counts, and if more than 50% of those come from <1% of pixels, then it is considered to be noise-dominated and hence unusable.
| Quadrant | # 1 sec bins | Bins with >0 counts | Bins with >2000 counts | High rate bins dominated by noise | Noise dominated (total time) | Noise dominated (detector-on time) | Marked lightcurve |
|---|---|---|---|---|---|---|---|
| A | 6892 | 5708 | 27 | 27 | 0.39% | 0.47% | 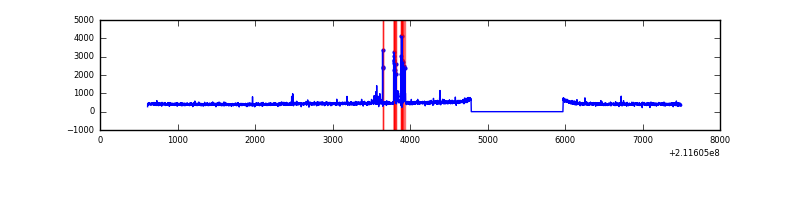 |
| B | 6892 | 5708 | 6 | 6 | 0.09% | 0.11% | 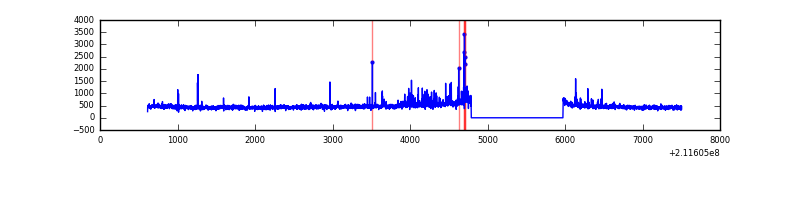 |
| C | 6892 | 5708 | 0 | 0 | 0.00% | 0.00% | 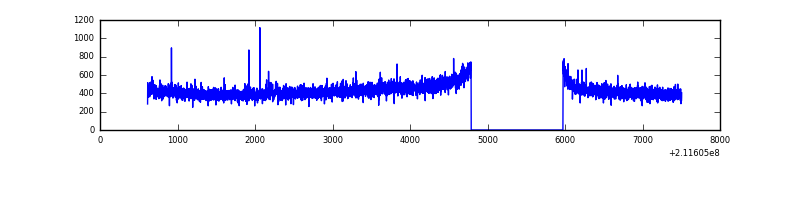 |
| D | 6892 | 5708 | 888 | 888 | 12.88% | 15.56% | 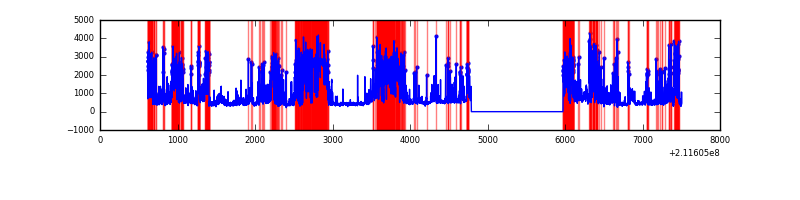 |
Top three noisy pixels from each quadrant. If the there are fewer than three noisy pixels in the level2.evt file, extra rows are filled as -1
| Pixel properties | Quadrant properties | ||||||
|---|---|---|---|---|---|---|---|
| Quadrant | DetID | PixID | Counts | Sigma | Mean | Median | Sigma |
| A | 0 | 50 | 135540 | 1047.07 | 640 | 627 | 128.8 |
| A | 13 | 251 | 11195 | 82.02 | 640 | 627 | 128.8 |
| A | 12 | 194 | 6414 | 44.91 | 640 | 627 | 128.8 |
| B | 4 | 80 | 107237 | 871.73 | 652 | 636 | 122.3 |
| B | 10 | 16 | 32368 | 259.49 | 652 | 636 | 122.3 |
| B | 4 | 48 | 20891 | 165.64 | 652 | 636 | 122.3 |
| C | 1 | 16 | 24591 | 170.18 | 617 | 619 | 140.9 |
| C | 13 | 61 | 4993 | 31.05 | 617 | 619 | 140.9 |
| C | 12 | 4 | 3229 | 18.53 | 617 | 619 | 140.9 |
| D | 11 | 145 | 3480403 | 25415.69 | 562 | 544 | 136.9 |
| D | 2 | 63 | 117036 | 850.82 | 562 | 544 | 136.9 |
| D | 2 | 33 | 83673 | 607.15 | 562 | 544 | 136.9 |
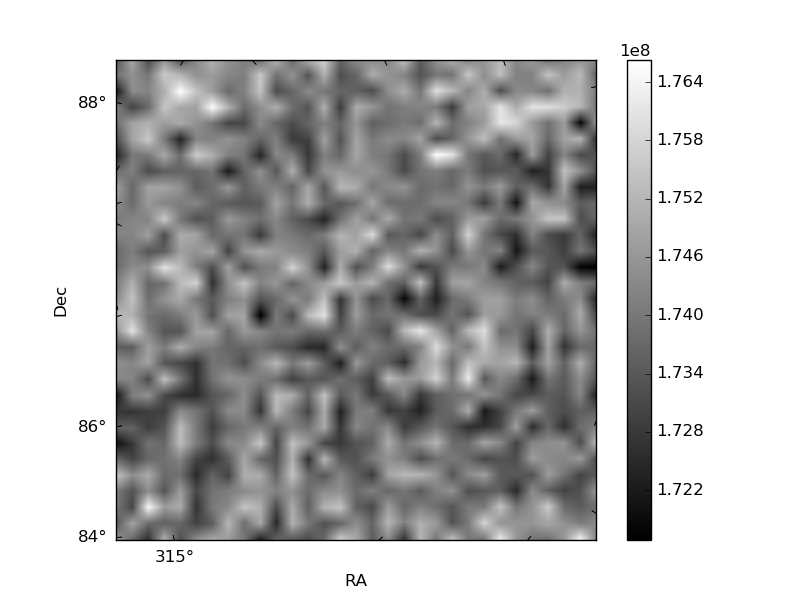
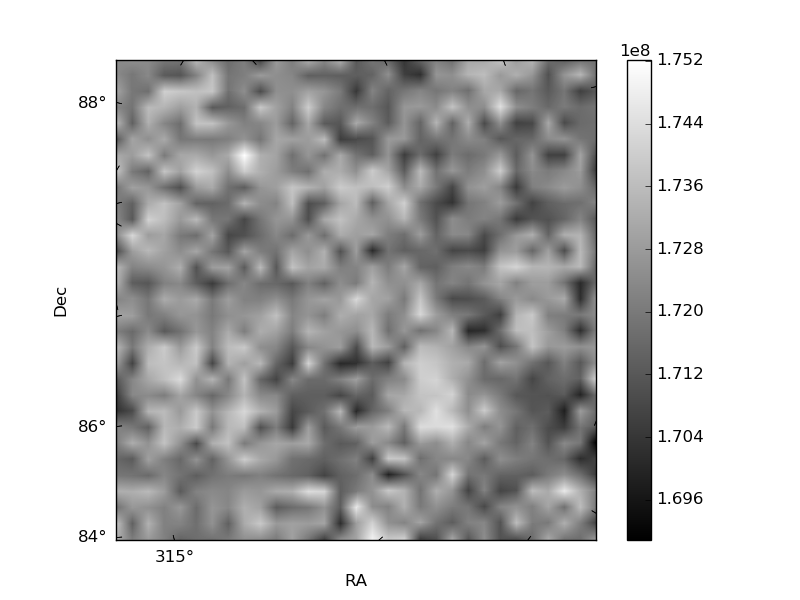
Histogram calculated using DETX and DETY for each event in the final _common_clean file
| Quadrant A | 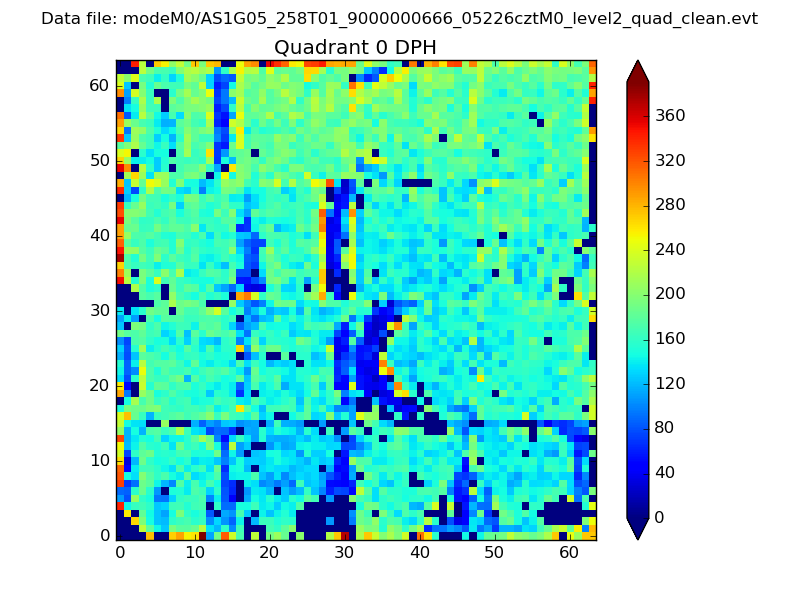 |
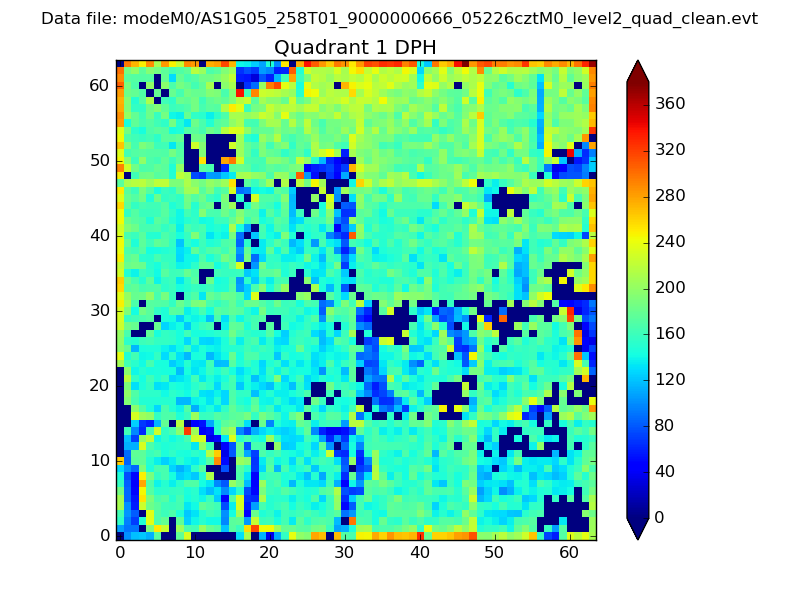 |
Quadrant B |
|---|---|---|---|
| Quadrant D | 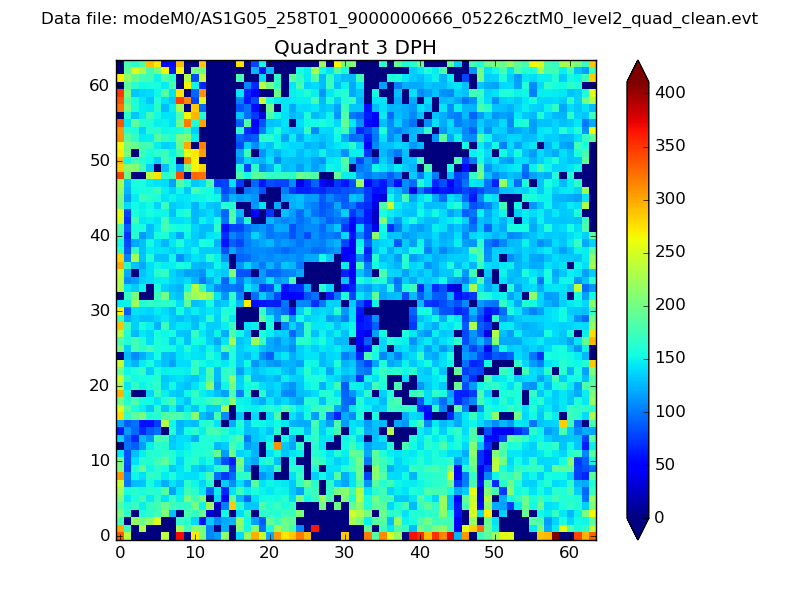 |
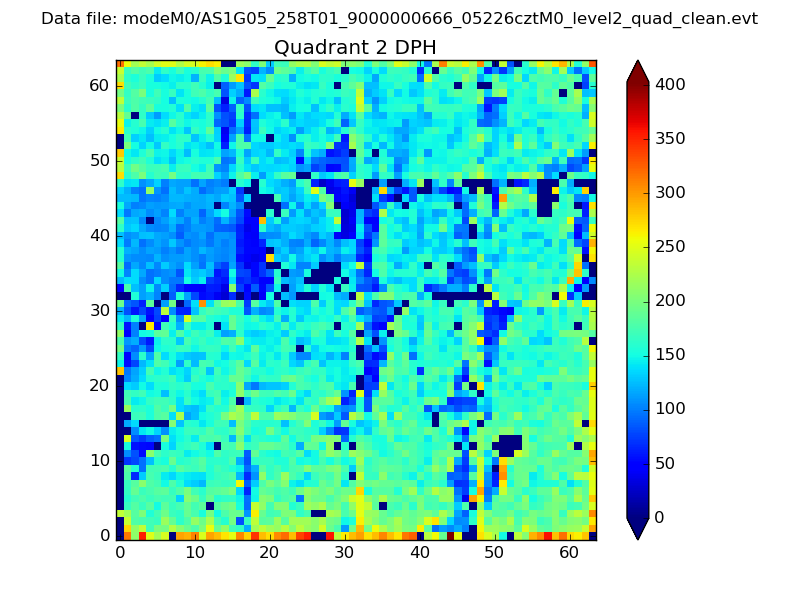 |
Quadrant C |
| Plot type | Count rate plots | Images |
|---|---|---|
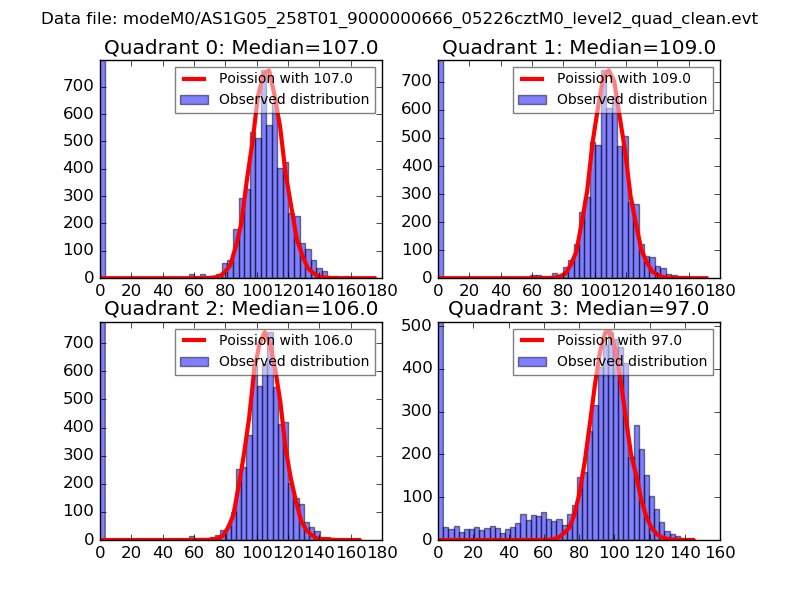
| Comparison with Poisson distribution Blue bars denote a histogram of data divided into 1 sec bins. Red curve is a Poisson curve with rate = median count rate of data. |
 |
 |
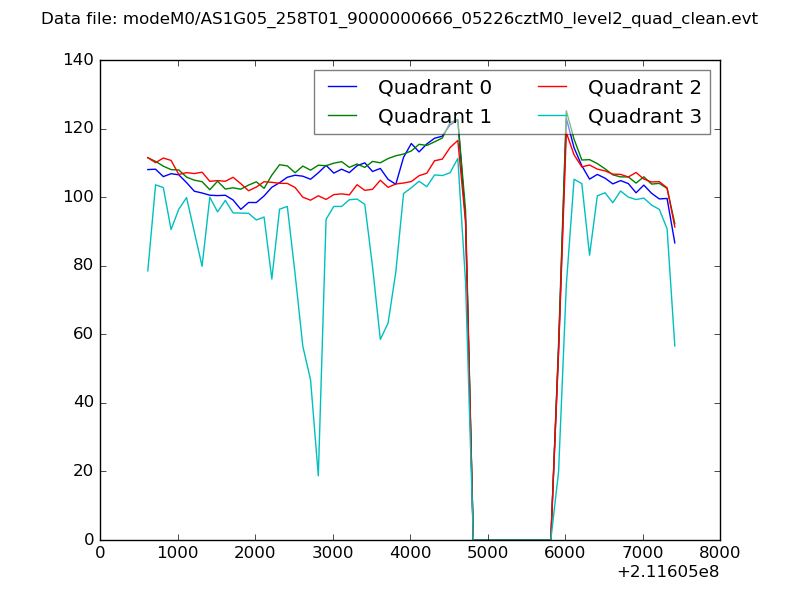
| Quadrant-wise count rates Data is divided into 100 sec bins |
 |
|
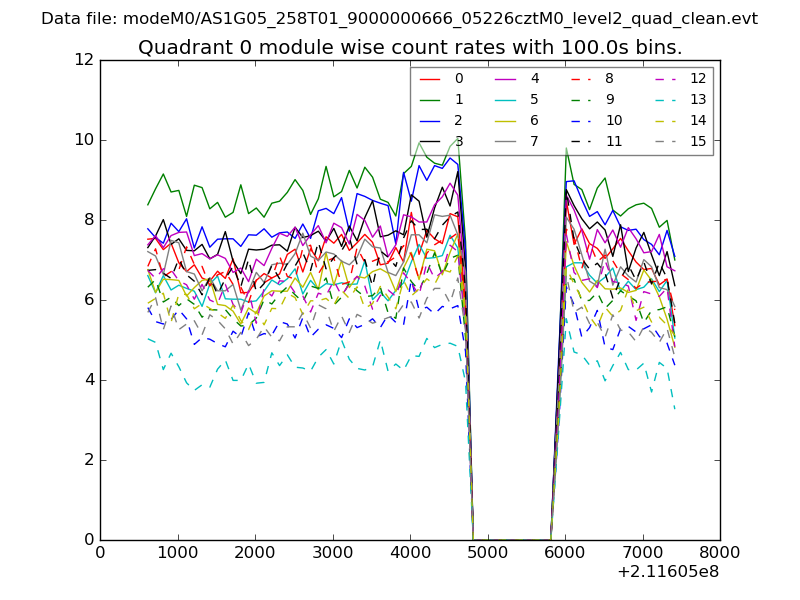
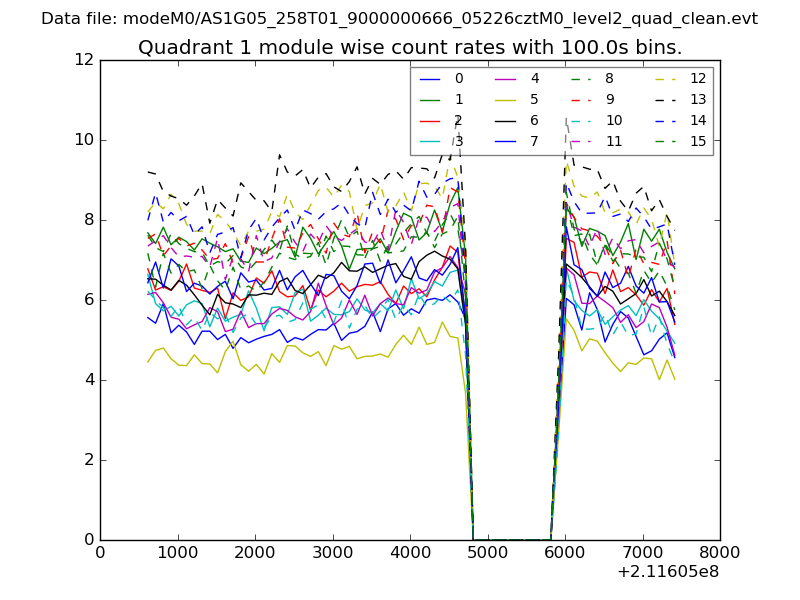
| Module-wise count rates for Quadrant A Data is divided into 100 sec bins |
 |
 |
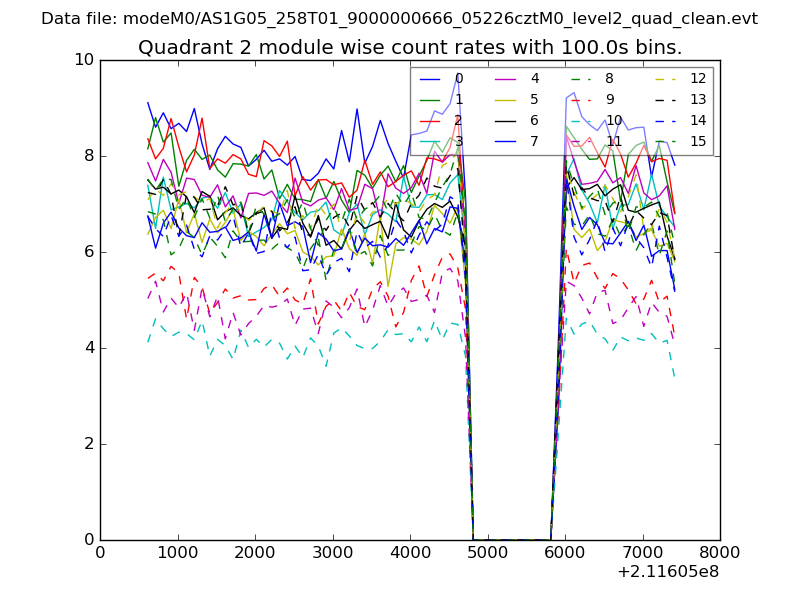
| Module-wise count rates for Quadrant B Data is divided into 100 sec bins |
 |
 |
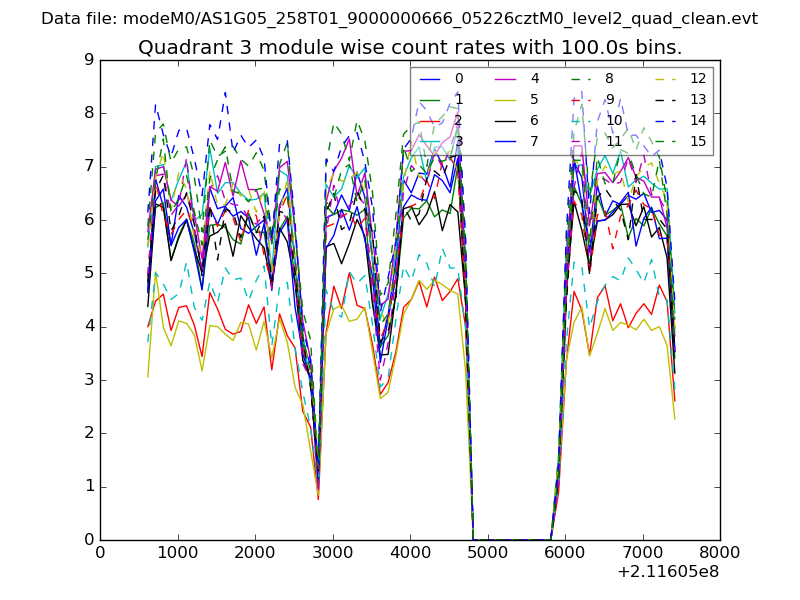
| Module-wise count rates for Quadrant C Data is divided into 100 sec bins |
 |
 |
| Module-wise count rates for Quadrant D Data is divided into 100 sec bins |
 |
 |
| Parameter | Plot |
|---|---|
| CZT HV Monitor |  |
| D_VDD | 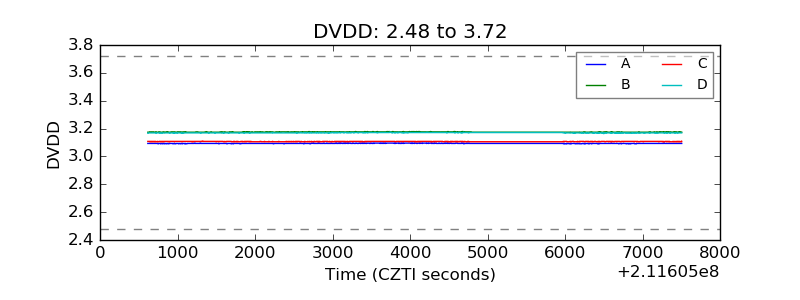 |
| Temperature 1 | 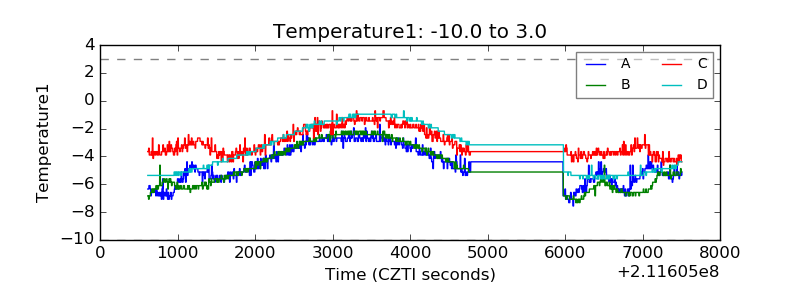 |
| Veto HV Monitor | 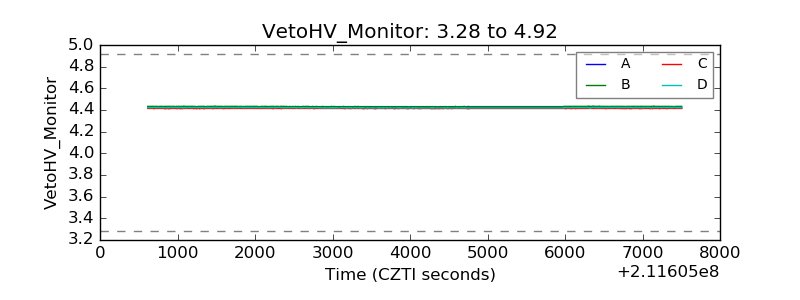 |
| Veto LLD | 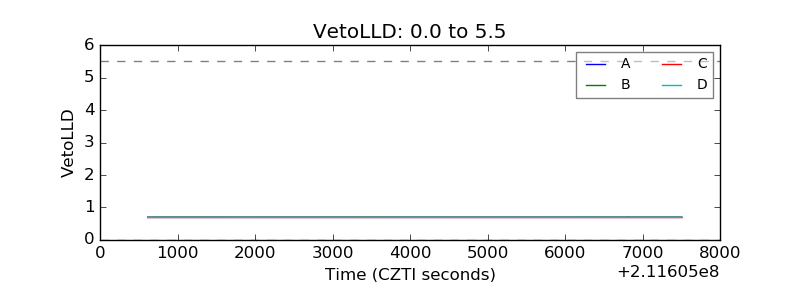 |
| Alpha Counter | 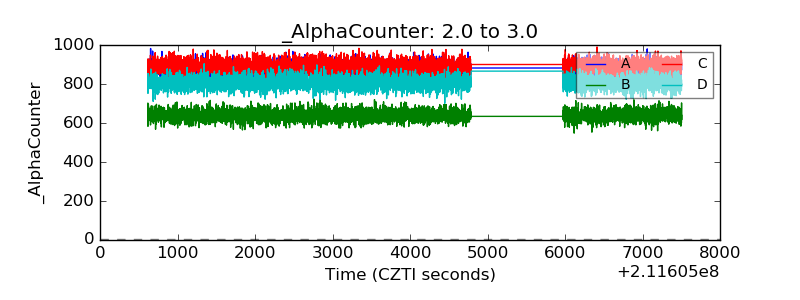 |
| _CPM_Rate | 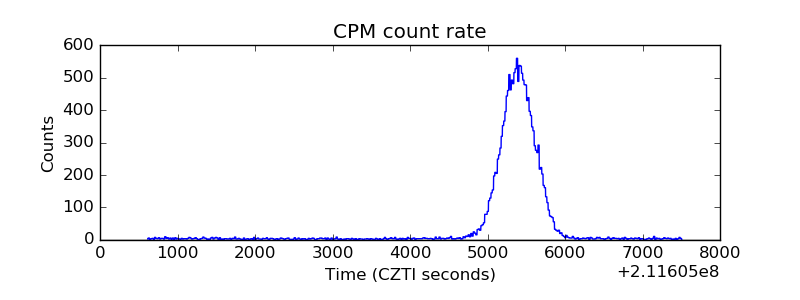 |
| CZT Counter | 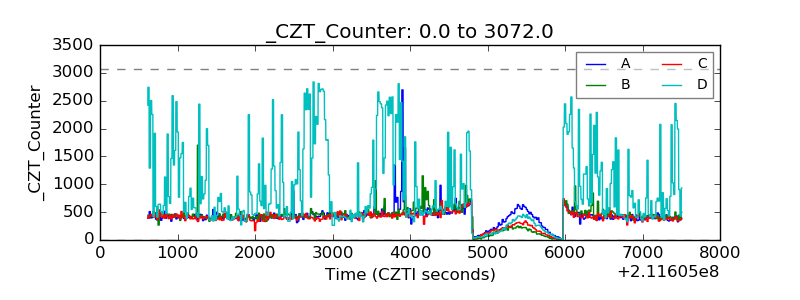 |
| +2.5 Volts monitor |  |
| +5 Volts monitor |  |
| _ROLL_ROT | 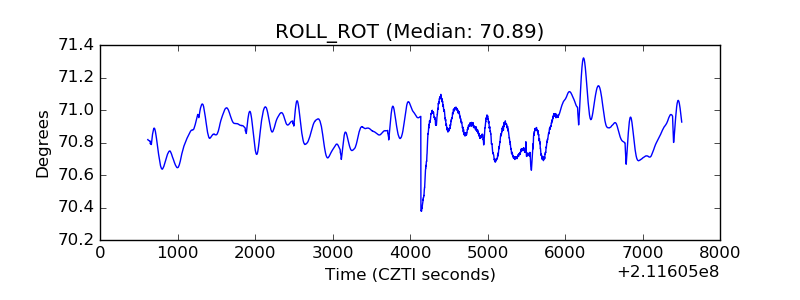 |
| _Roll_DEC |  |
| _Roll_RA | 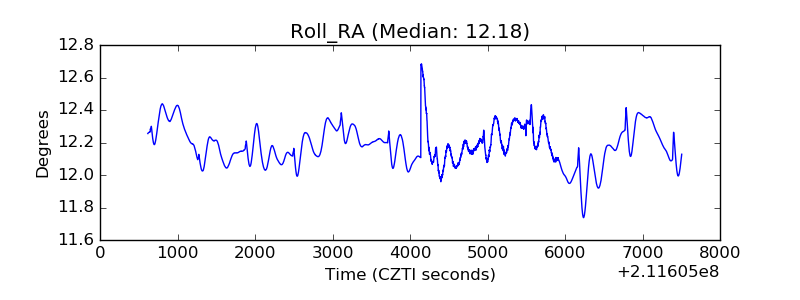 |
| Veto Counter | 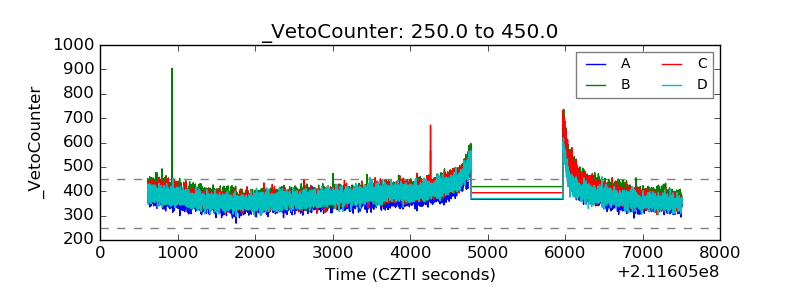 |