| Param | Original file | Final file |
|---|---|---|
| Filename | modeM0/AS1G05_258T01_9000000666_05227cztM0_level2.evt | modeM0/AS1G05_258T01_9000000666_05227cztM0_level2_quad_clean.evt |
| Size (bytes) | 488,102,400 | 91,382,400 |
| Size | 465.5 MB | 87.1 MB |
| Events in quadrant A | 2,487,536 | 590,326 |
| Events in quadrant B | 2,567,813 | 603,614 |
| Events in quadrant C | 2,425,354 | 584,343 |
| Events in quadrant D | 6,920,580 | 596,594 |
| Mode M0 | |||
|---|---|---|---|
| Quadrant | BADHDUFLAG | Total packets | Discarded packets |
| A | 0 | 12507 | 975 |
| B | 0 | 12483 | 957 |
| C | 0 | 12379 | 960 |
| D | 0 | 26840 | 2389 |
| Mode M9 | |||
|---|---|---|---|
| Quadrant | BADHDUFLAG | Total packets | Discarded packets |
| A | 0 | 10 | 0 |
| B | 0 | 10 | 0 |
| C | 0 | 10 | 0 |
| D | 0 | 10 | 0 |
| Mode SS | |||
|---|---|---|---|
| Quadrant | BADHDUFLAG | Total packets | Discarded packets |
| A | 0 | 124 | 10 |
| B | 0 | 123 | 9 |
| C | 0 | 124 | 10 |
| D | 0 | 124 | 14 |
| Quadrant | Total seconds | Saturated seconds | Saturation percentage |
|---|---|---|---|
| A | 5627 | 52 | 0.924116% |
| B | 5633 | 57 | 1.011894% |
| C | 5631 | 20 | 0.355177% |
| D | 5516 | 1413 | 25.616389% |
Noise dominated data is calculated using 1-second bins in cleaned event files. If a bin has >2000 counts, and if more than 50% of those come from <1% of pixels, then it is considered to be noise-dominated and hence unusable.
| Quadrant | # 1 sec bins | Bins with >0 counts | Bins with >2000 counts | High rate bins dominated by noise | Noise dominated (total time) | Noise dominated (detector-on time) | Marked lightcurve |
|---|---|---|---|---|---|---|---|
| A | 7066 | 5837 | 5 | 5 | 0.07% | 0.09% |  |
| B | 7066 | 5828 | 1 | 1 | 0.01% | 0.02% | 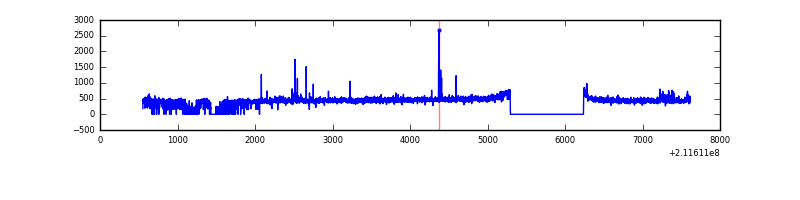 |
| C | 7066 | 5813 | 0 | 0 | 0.00% | 0.00% | 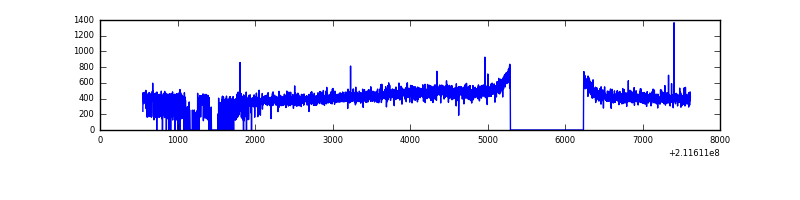 |
| D | 7066 | 5736 | 1204 | 1204 | 17.04% | 20.99% |  |
Top three noisy pixels from each quadrant. If the there are fewer than three noisy pixels in the level2.evt file, extra rows are filled as -1
| Pixel properties | Quadrant properties | ||||||
|---|---|---|---|---|---|---|---|
| Quadrant | DetID | PixID | Counts | Sigma | Mean | Median | Sigma |
| A | 0 | 50 | 54809 | 421.63 | 631 | 616 | 128.5 |
| A | 12 | 194 | 6340 | 44.53 | 631 | 616 | 128.5 |
| A | 0 | 226 | 6140 | 42.97 | 631 | 616 | 128.5 |
| B | 4 | 80 | 34267 | 277.6 | 640 | 625 | 121.2 |
| B | 4 | 48 | 24198 | 194.52 | 640 | 625 | 121.2 |
| B | 0 | 219 | 19785 | 158.1 | 640 | 625 | 121.2 |
| C | 1 | 16 | 42307 | 298.12 | 609 | 610 | 139.9 |
| C | 13 | 61 | 5065 | 31.85 | 609 | 610 | 139.9 |
| C | 14 | 67 | 4159 | 25.37 | 609 | 610 | 139.9 |
| D | 11 | 145 | 4616464 | 35246.16 | 529 | 511 | 131.0 |
| D | 2 | 63 | 192807 | 1468.32 | 529 | 511 | 131.0 |
| D | 8 | 195 | 37781 | 284.58 | 529 | 511 | 131.0 |
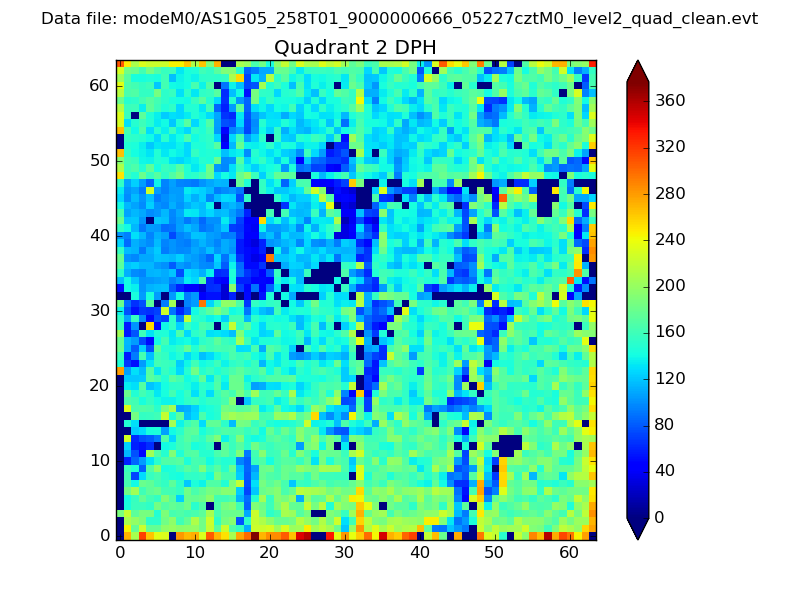
Histogram calculated using DETX and DETY for each event in the final _common_clean file
| Quadrant A | 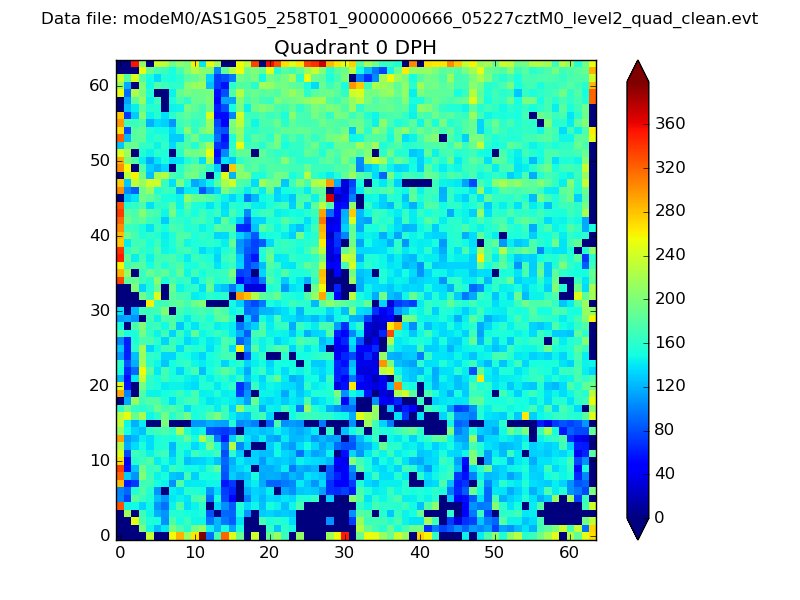 |
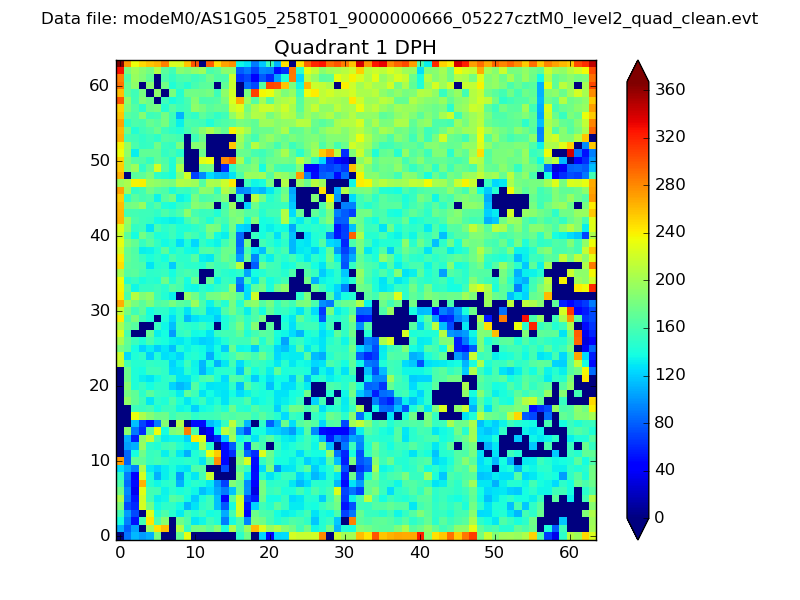 |
Quadrant B |
|---|---|---|---|
| Quadrant D |  |
 |
Quadrant C |
| Plot type | Count rate plots | Images |
|---|---|---|
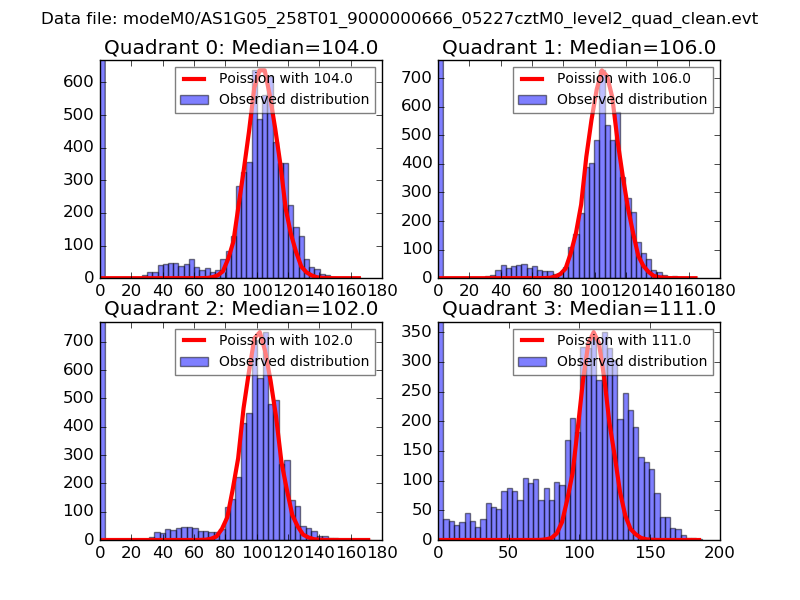
| Comparison with Poisson distribution Blue bars denote a histogram of data divided into 1 sec bins. Red curve is a Poisson curve with rate = median count rate of data. |
 |
 |
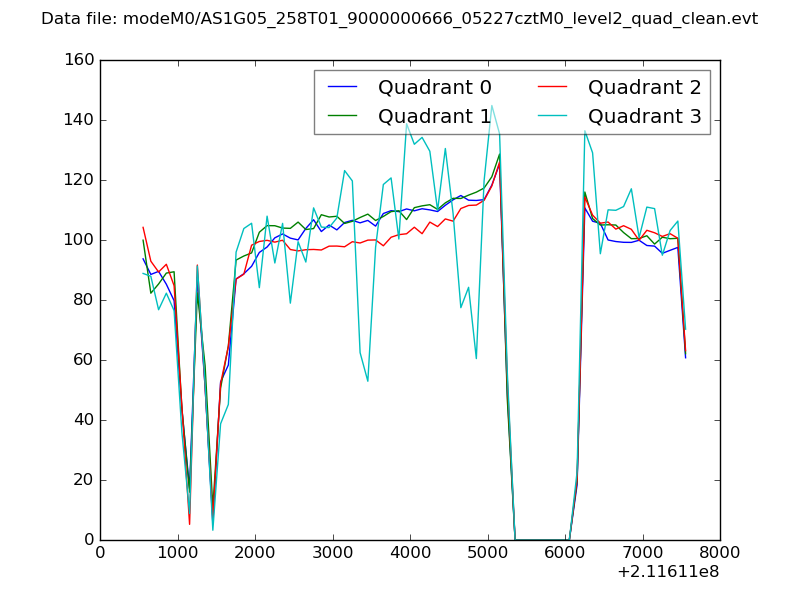
| Quadrant-wise count rates Data is divided into 100 sec bins |
 |
|
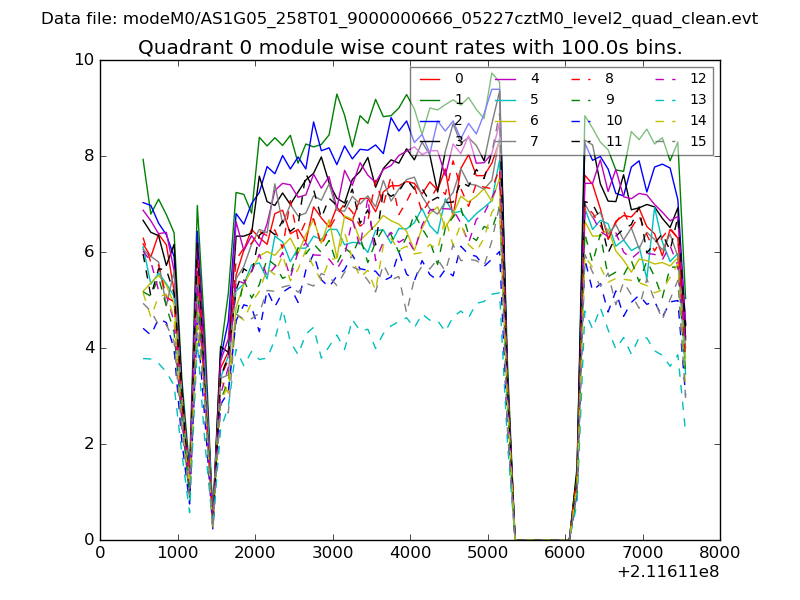
| Module-wise count rates for Quadrant A Data is divided into 100 sec bins |
 |
 |
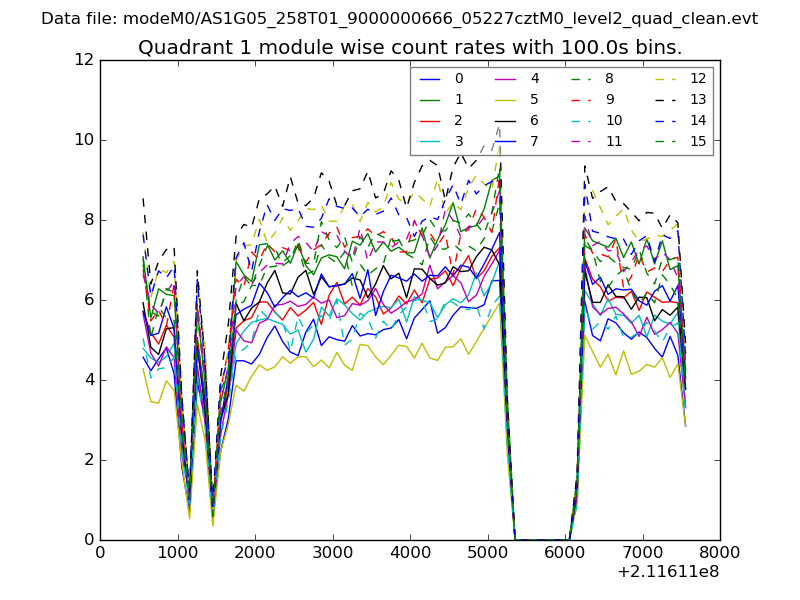
| Module-wise count rates for Quadrant B Data is divided into 100 sec bins |
 |
 |
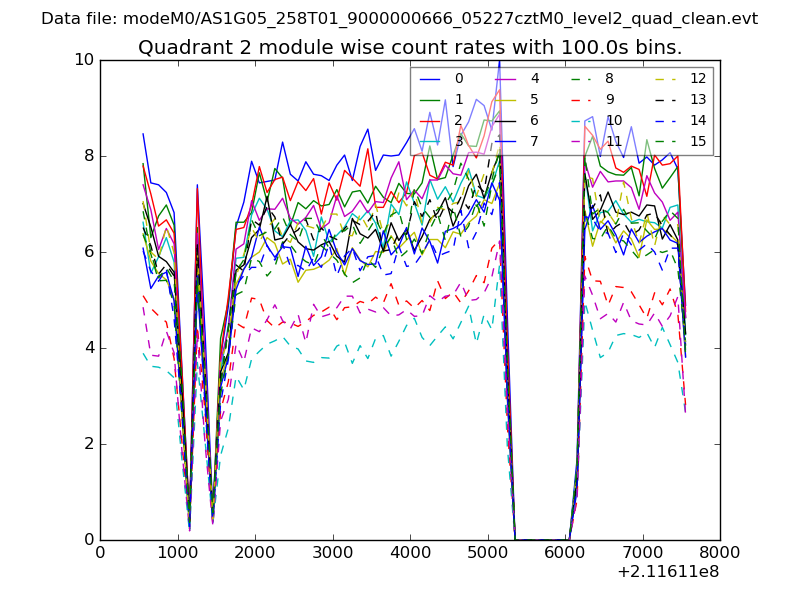
| Module-wise count rates for Quadrant C Data is divided into 100 sec bins |
 |
 |
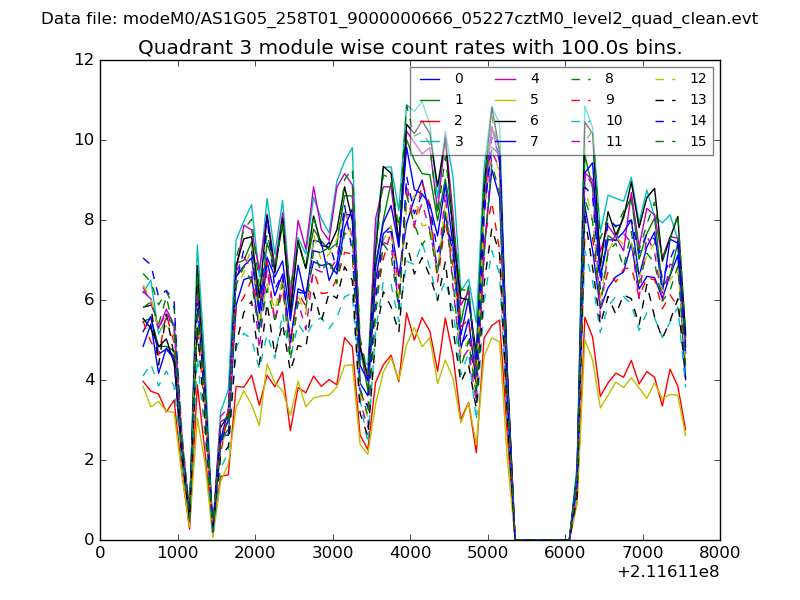
| Module-wise count rates for Quadrant D Data is divided into 100 sec bins |
 |
 |
| Parameter | Plot |
|---|---|
| CZT HV Monitor | 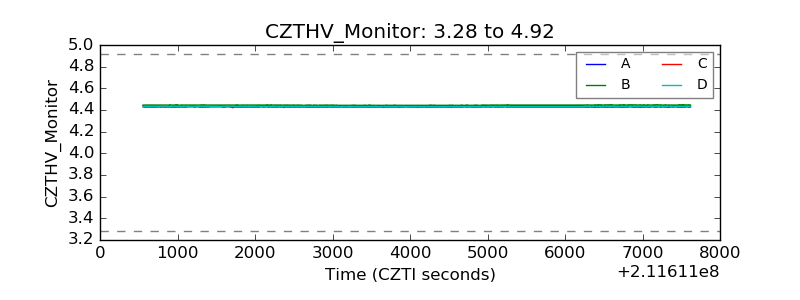 |
| D_VDD | 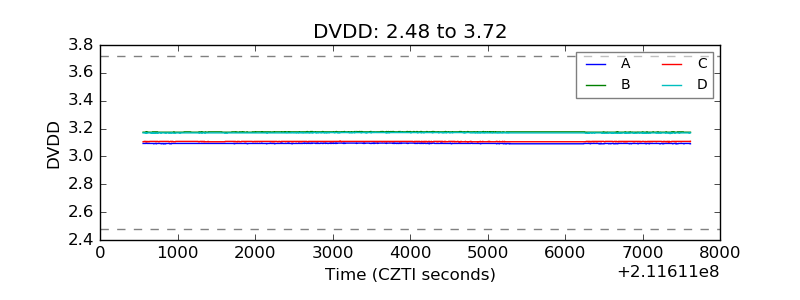 |
| Temperature 1 | 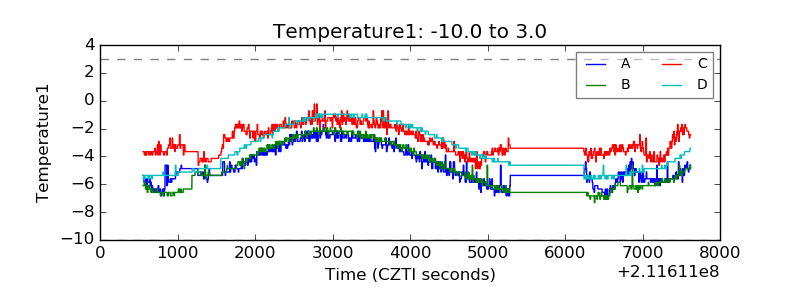 |
| Veto HV Monitor | 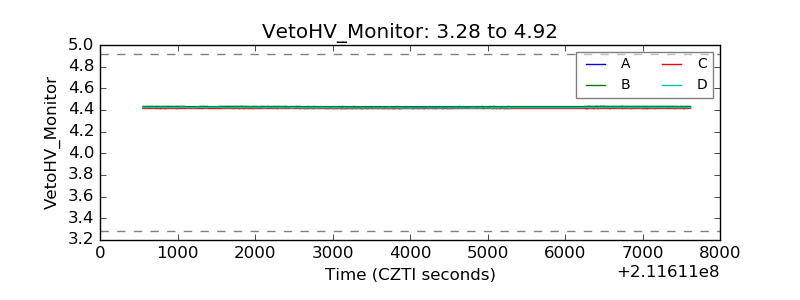 |
| Veto LLD | 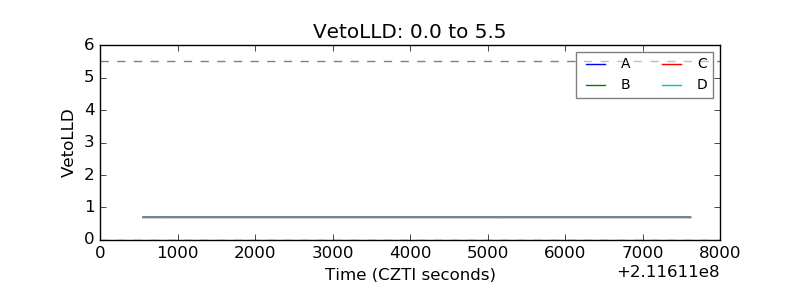 |
| Alpha Counter | 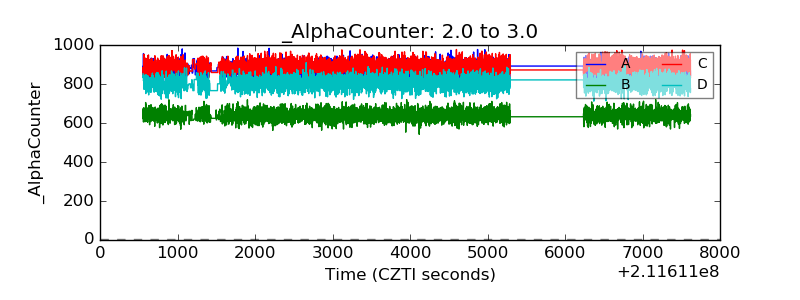 |
| _CPM_Rate | 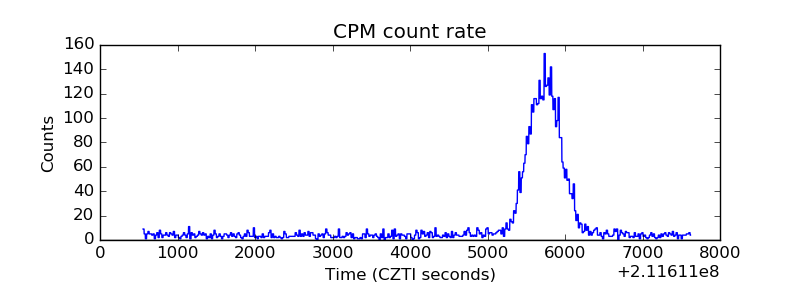 |
| CZT Counter | 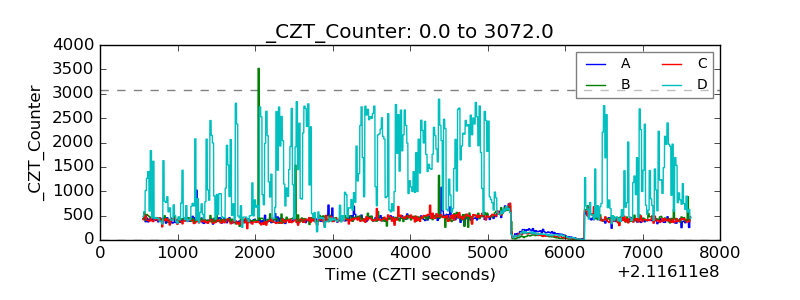 |
| +2.5 Volts monitor | 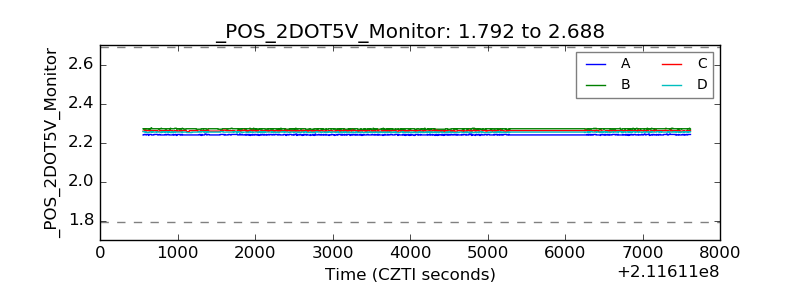 |
| +5 Volts monitor |  |
| _ROLL_ROT | 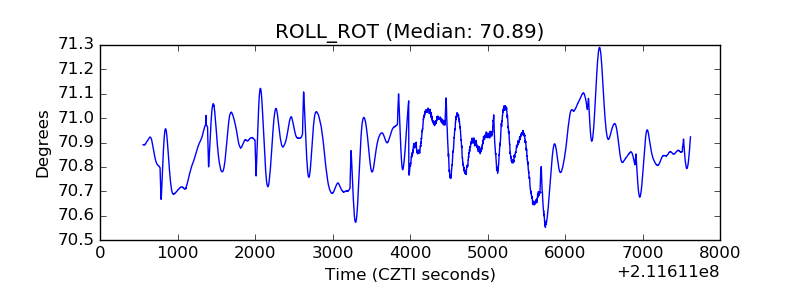 |
| _Roll_DEC | 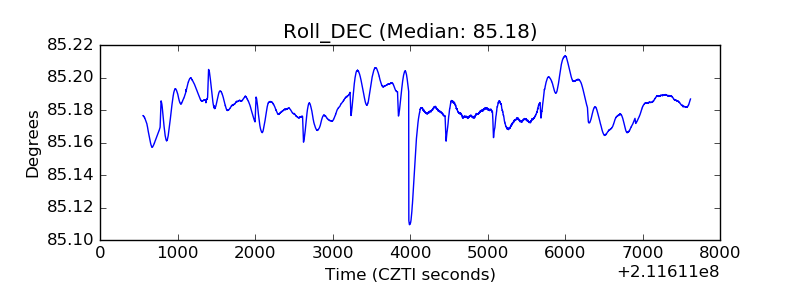 |
| _Roll_RA | 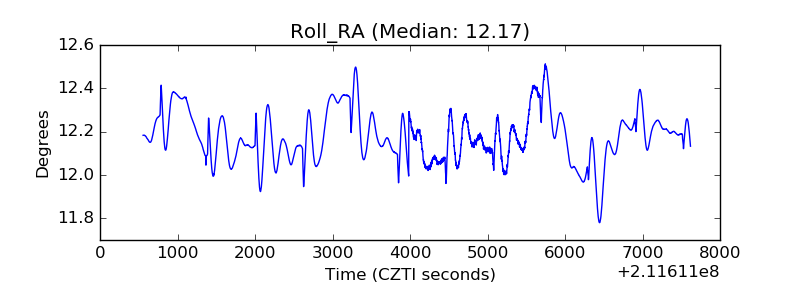 |
| Veto Counter | 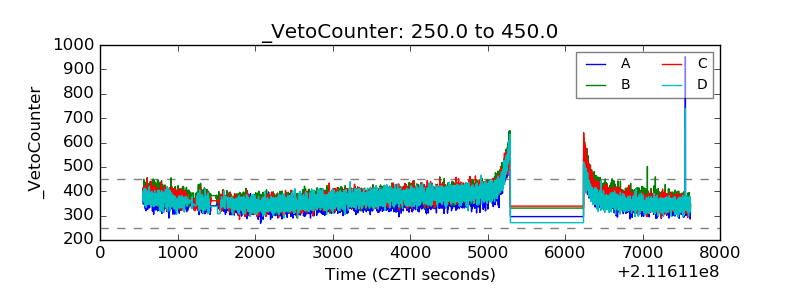 |