| Param | Original file | Final file |
|---|---|---|
| Filename | modeM0/AS1G05_258T01_9000000666_05228cztM0_level2.evt | modeM0/AS1G05_258T01_9000000666_05228cztM0_level2_quad_clean.evt |
| Size (bytes) | 966,934,080 | 173,018,880 |
| Size | 922.1 MB | 165.0 MB |
| Events in quadrant A | 5,078,838 | 1,167,910 |
| Events in quadrant B | 5,371,930 | 1,191,042 |
| Events in quadrant C | 4,890,354 | 1,150,224 |
| Events in quadrant D | 13,182,600 | 952,579 |
| Mode M0 | |||
|---|---|---|---|
| Quadrant | BADHDUFLAG | Total packets | Discarded packets |
| A | 0 | 23346 | 4 |
| B | 0 | 23595 | 3 |
| C | 0 | 22847 | 3 |
| D | 0 | 47290 | 3 |
| Mode M9 | |||
|---|---|---|---|
| Quadrant | BADHDUFLAG | Total packets | Discarded packets |
| A | 0 | 15 | 0 |
| B | 0 | 15 | 0 |
| C | 0 | 15 | 0 |
| D | 0 | 15 | 0 |
| Mode SS | |||
|---|---|---|---|
| Quadrant | BADHDUFLAG | Total packets | Discarded packets |
| A | 0 | 228 | 0 |
| B | 0 | 228 | 0 |
| C | 0 | 228 | 0 |
| D | 0 | 228 | 0 |
| Quadrant | Total seconds | Saturated seconds | Saturation percentage |
|---|---|---|---|
| A | 11236 | 166 | 1.477394% |
| B | 11236 | 134 | 1.192595% |
| C | 11236 | 47 | 0.418298% |
| D | 11236 | 2740 | 24.385902% |
Noise dominated data is calculated using 1-second bins in cleaned event files. If a bin has >2000 counts, and if more than 50% of those come from <1% of pixels, then it is considered to be noise-dominated and hence unusable.
| Quadrant | # 1 sec bins | Bins with >0 counts | Bins with >2000 counts | High rate bins dominated by noise | Noise dominated (total time) | Noise dominated (detector-on time) | Marked lightcurve |
|---|---|---|---|---|---|---|---|
| A | 12696 | 11239 | 40 | 40 | 0.32% | 0.36% | 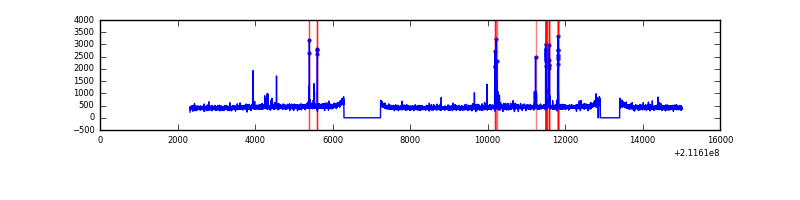 |
| B | 12696 | 11239 | 11 | 11 | 0.09% | 0.10% | 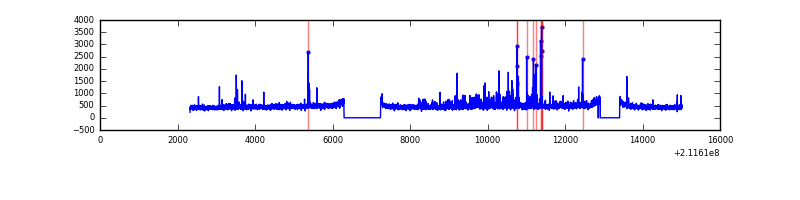 |
| C | 12696 | 11239 | 0 | 0 | 0.00% | 0.00% | 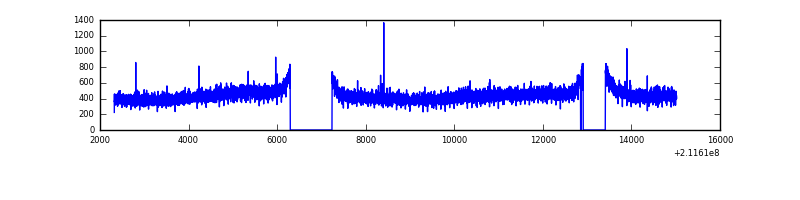 |
| D | 12696 | 11238 | 2299 | 2299 | 18.11% | 20.46% | 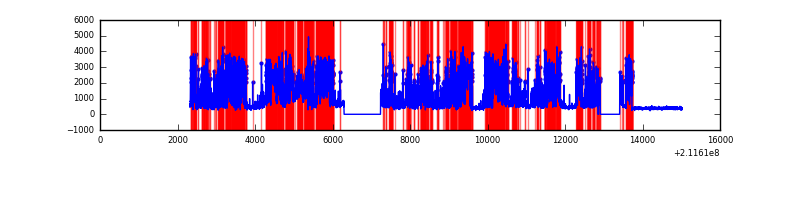 |
Top three noisy pixels from each quadrant. If the there are fewer than three noisy pixels in the level2.evt file, extra rows are filled as -1
| Pixel properties | Quadrant properties | ||||||
|---|---|---|---|---|---|---|---|
| Quadrant | DetID | PixID | Counts | Sigma | Mean | Median | Sigma |
| A | 0 | 50 | 212324 | 827.04 | 1262 | 1235 | 255.2 |
| A | 13 | 14 | 12918 | 45.77 | 1262 | 1235 | 255.2 |
| A | 12 | 194 | 12627 | 44.63 | 1262 | 1235 | 255.2 |
| B | 4 | 80 | 289938 | 1201.85 | 1279 | 1247 | 240.2 |
| B | 4 | 48 | 55009 | 223.82 | 1279 | 1247 | 240.2 |
| B | 0 | 219 | 42456 | 171.56 | 1279 | 1247 | 240.2 |
| C | 1 | 16 | 133545 | 475.97 | 1217 | 1221 | 278.0 |
| C | 13 | 61 | 10108 | 31.97 | 1217 | 1221 | 278.0 |
| C | 14 | 67 | 4984 | 13.54 | 1217 | 1221 | 278.0 |
| D | 11 | 145 | 8673456 | 32881.65 | 1081 | 1044 | 263.7 |
| D | 2 | 63 | 201775 | 761.08 | 1081 | 1044 | 263.7 |
| D | 1 | 31 | 41346 | 152.81 | 1081 | 1044 | 263.7 |
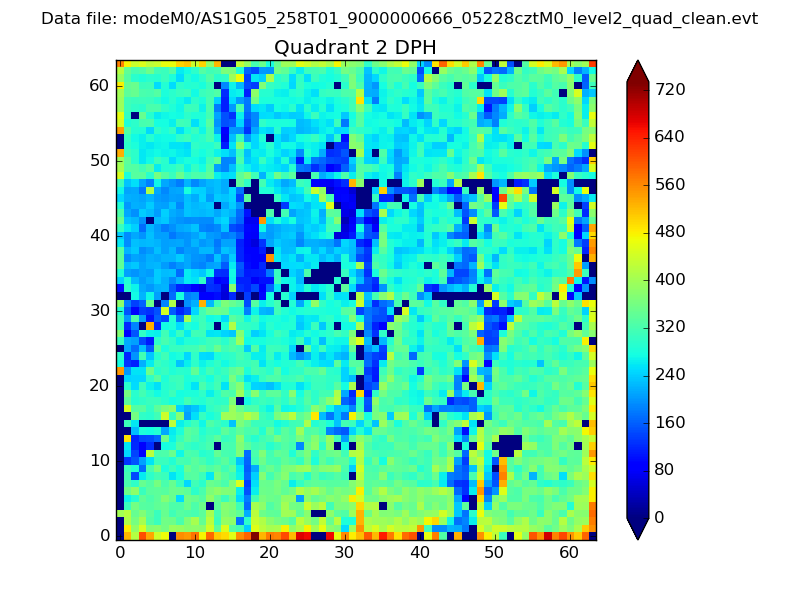
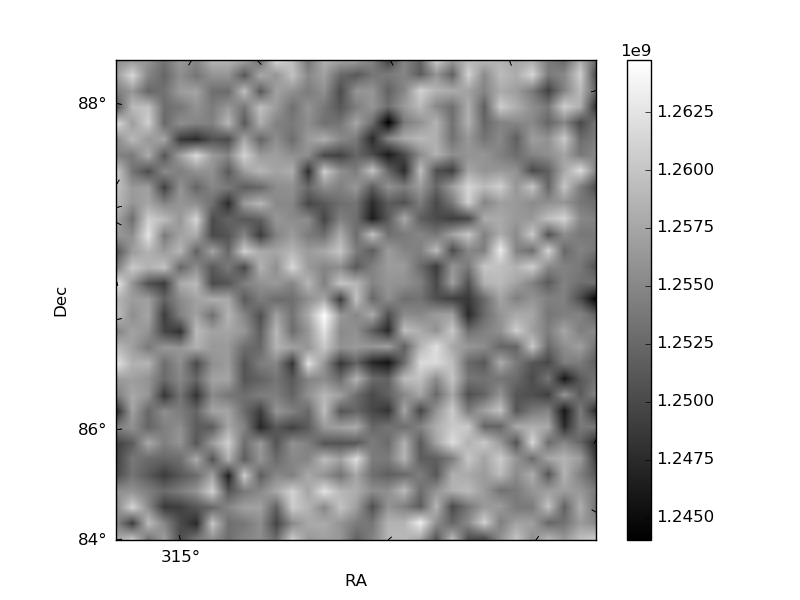
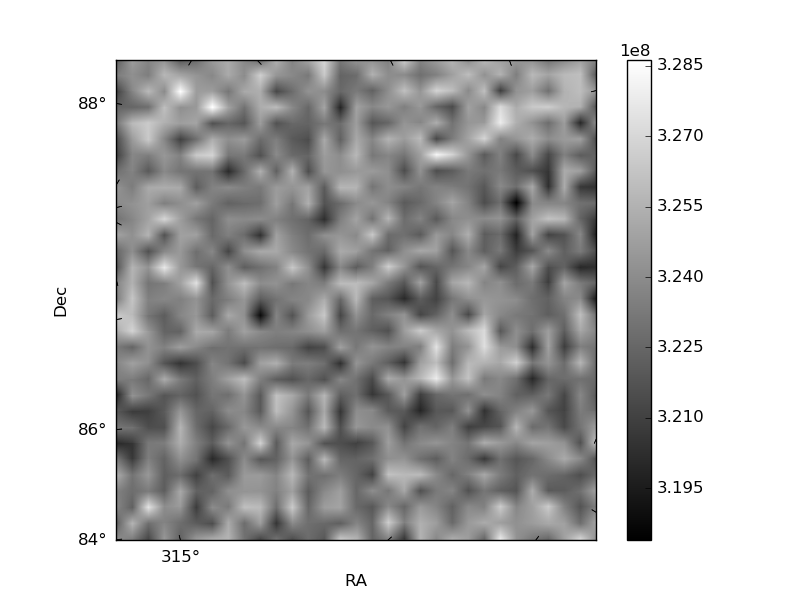
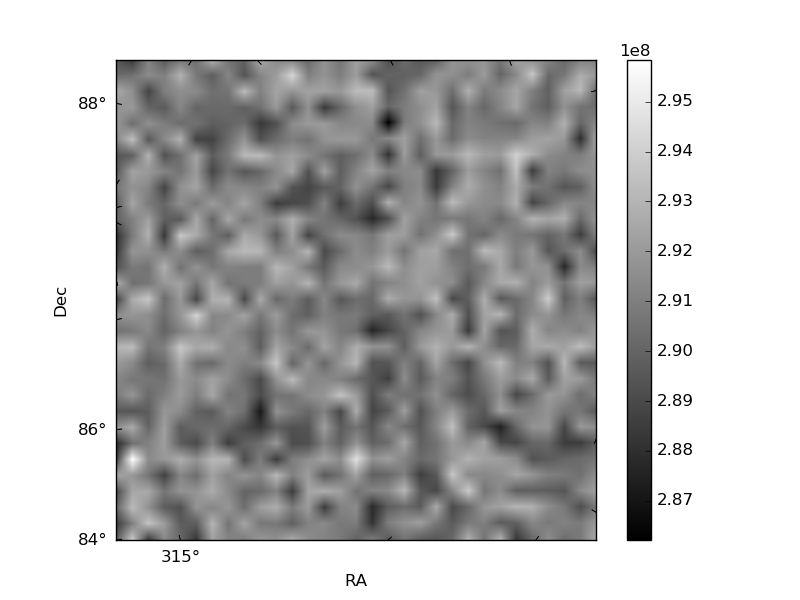
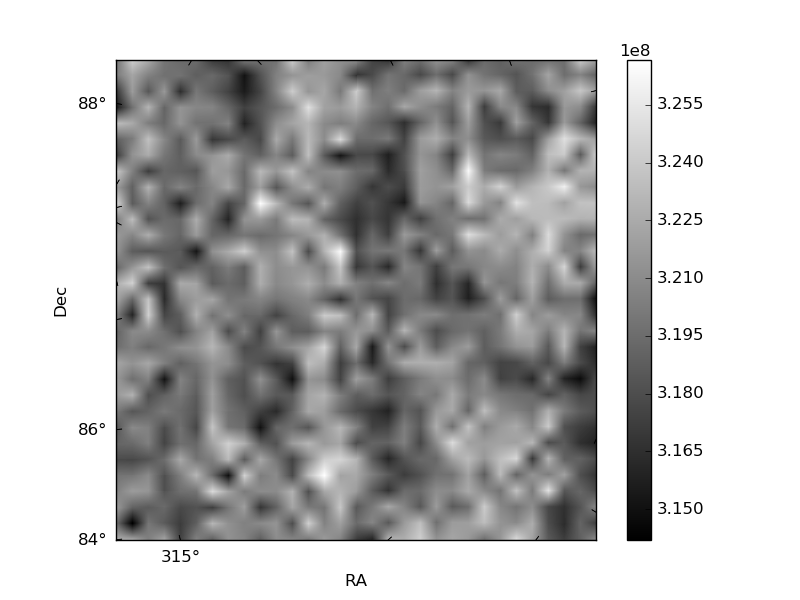
Histogram calculated using DETX and DETY for each event in the final _common_clean file
| Quadrant A | 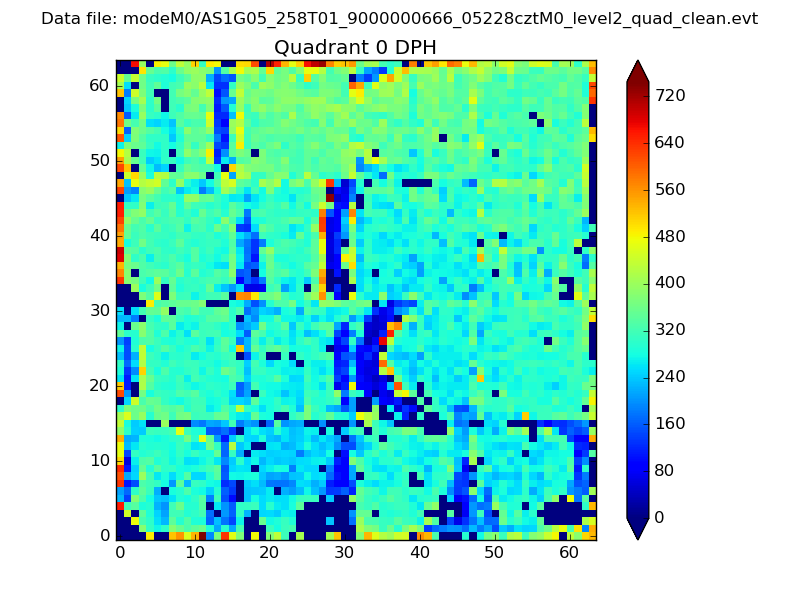 |
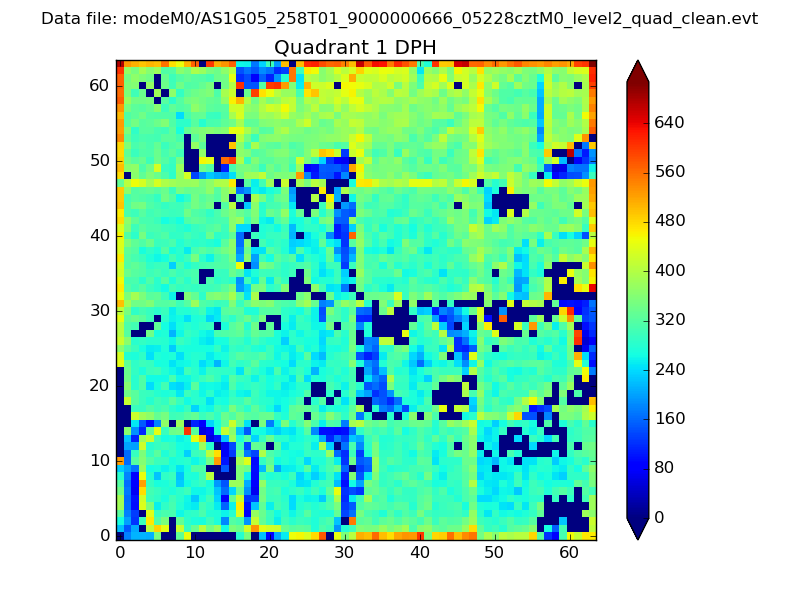 |
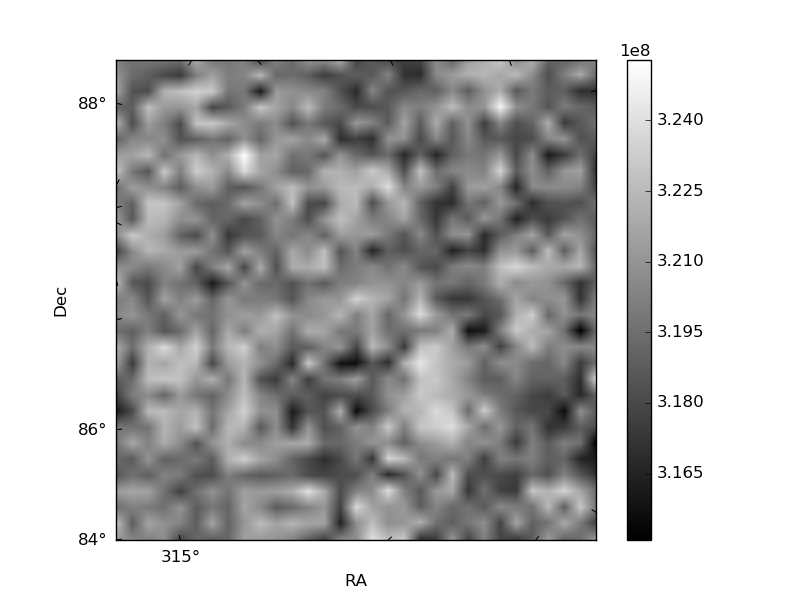
Quadrant B |
|---|---|---|---|
| Quadrant D | 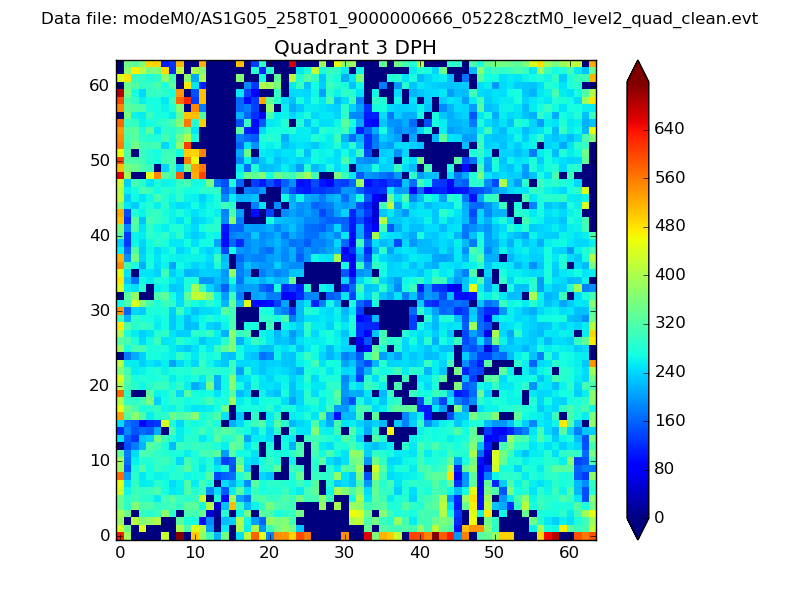 |
 |
Quadrant C |
| Plot type | Count rate plots | Images |
|---|---|---|
| Comparison with Poisson distribution Blue bars denote a histogram of data divided into 1 sec bins. Red curve is a Poisson curve with rate = median count rate of data. |
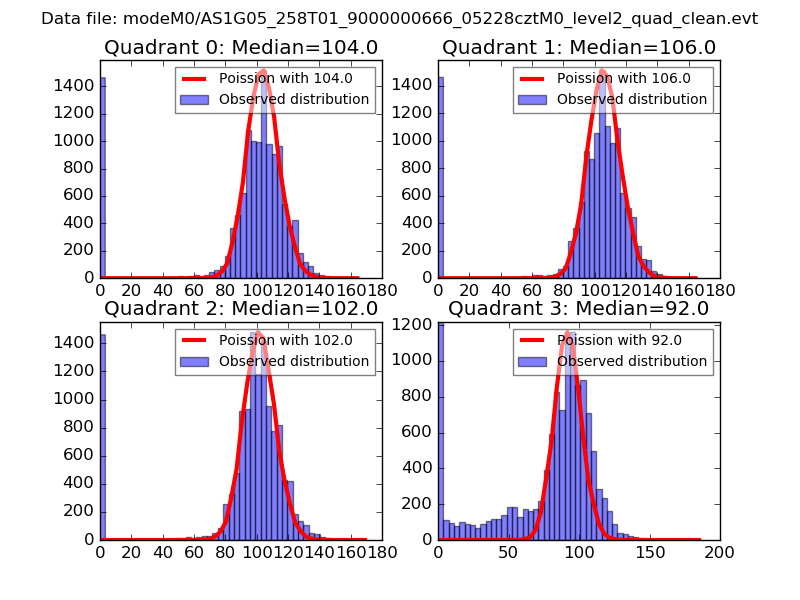 |
 |
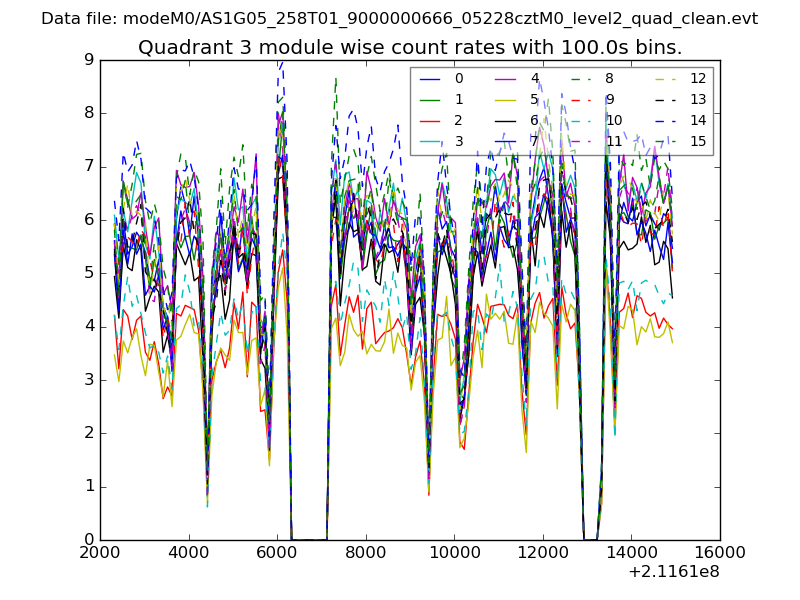
| Quadrant-wise count rates Data is divided into 100 sec bins |
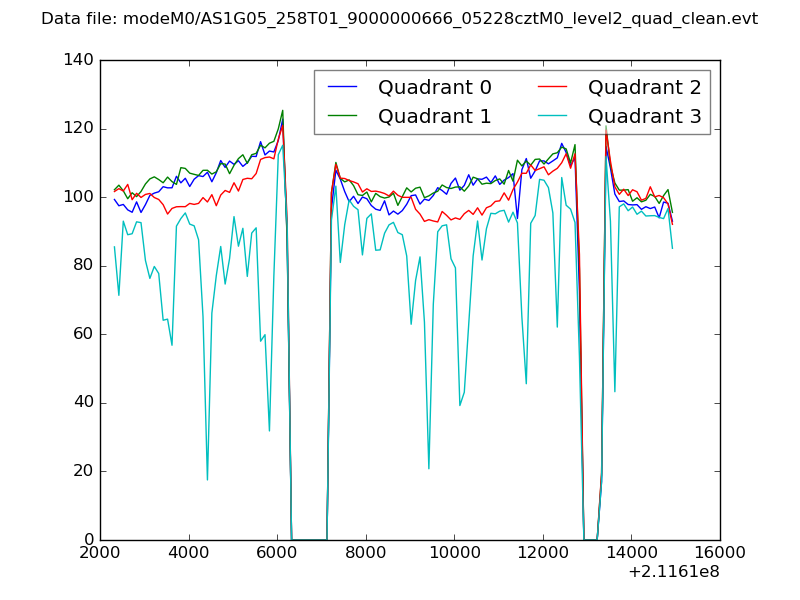 |
|
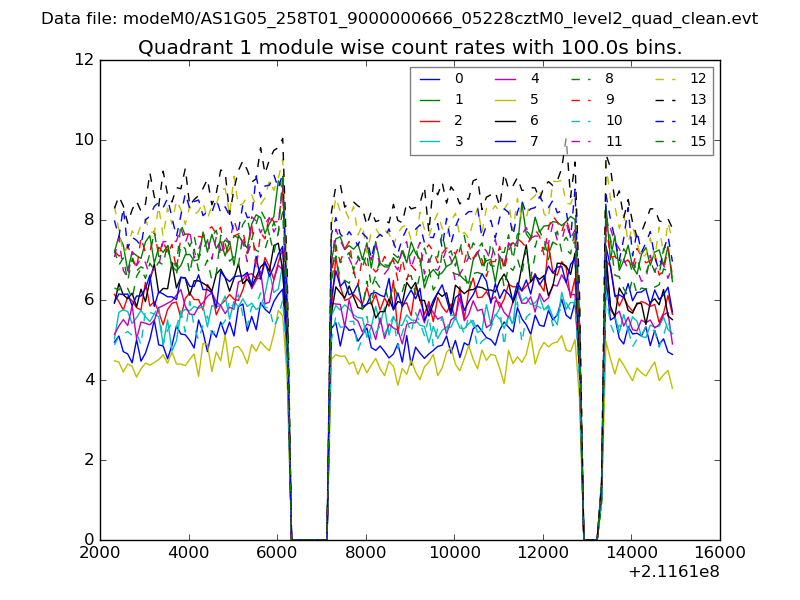
| Module-wise count rates for Quadrant A Data is divided into 100 sec bins |
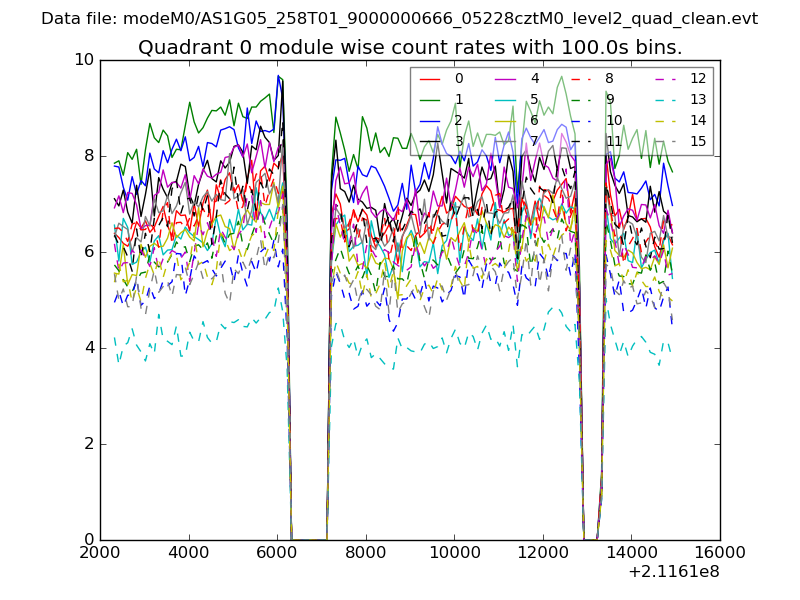 |
 |
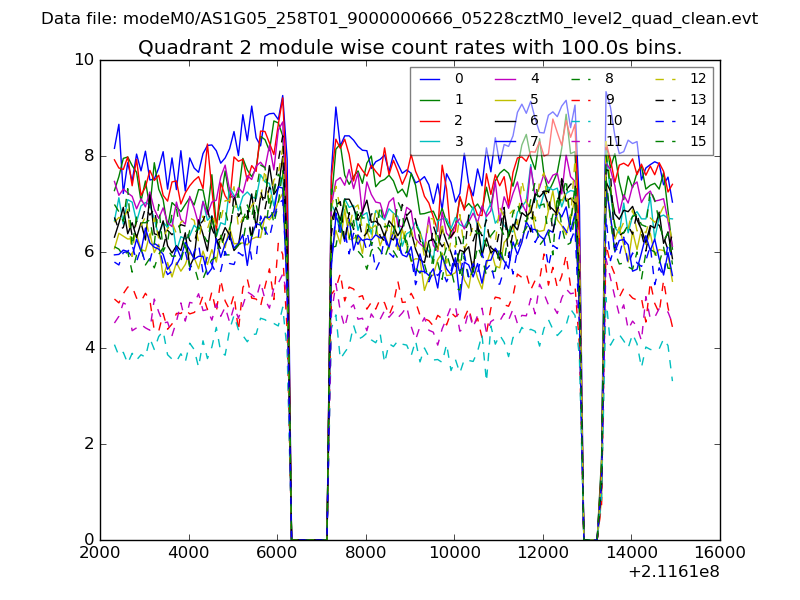
| Module-wise count rates for Quadrant B Data is divided into 100 sec bins |
 |
 |
| Module-wise count rates for Quadrant C Data is divided into 100 sec bins |
 |
 |
| Module-wise count rates for Quadrant D Data is divided into 100 sec bins |
 |
 |
| Parameter | Plot |
|---|---|
| CZT HV Monitor | 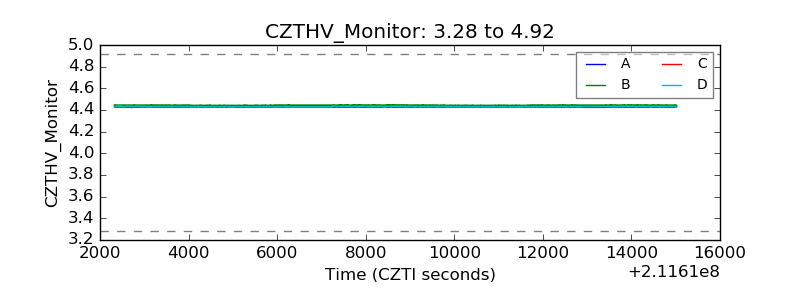 |
| D_VDD | 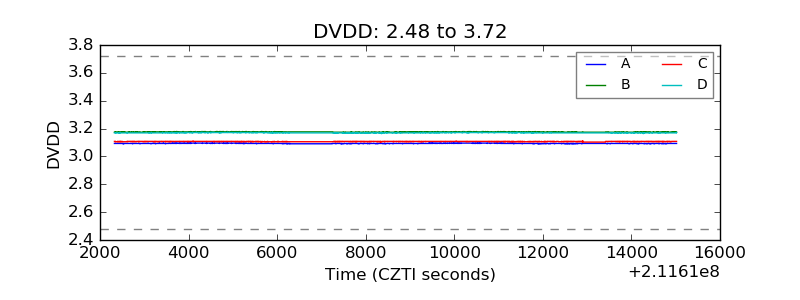 |
| Temperature 1 | 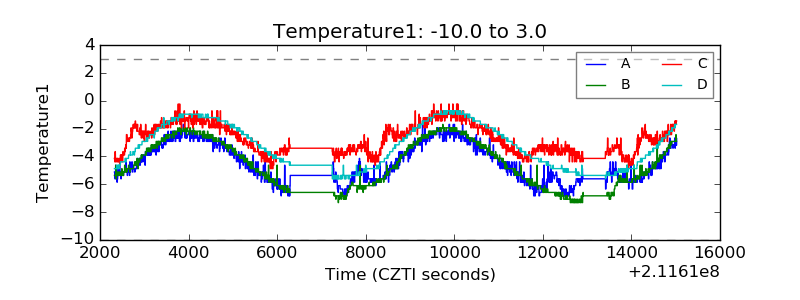 |
| Veto HV Monitor | 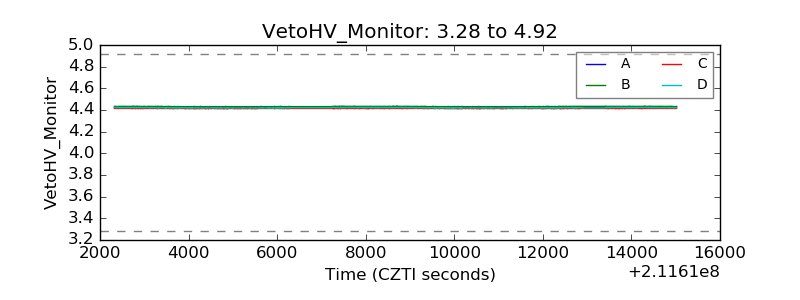 |
| Veto LLD | 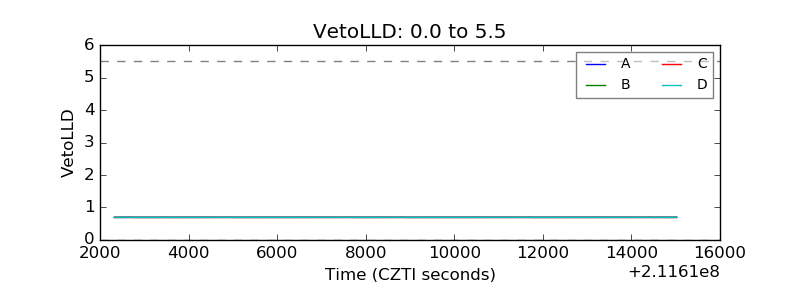 |
| Alpha Counter | 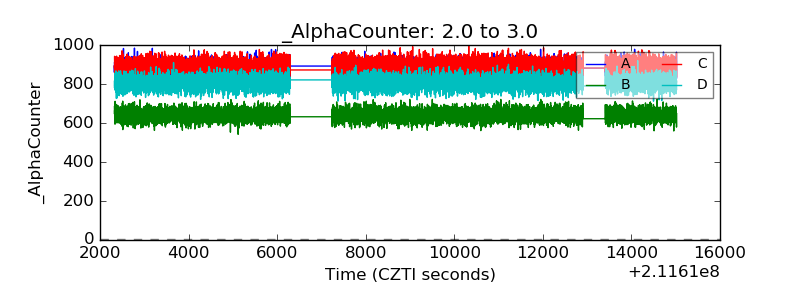 |
| _CPM_Rate | 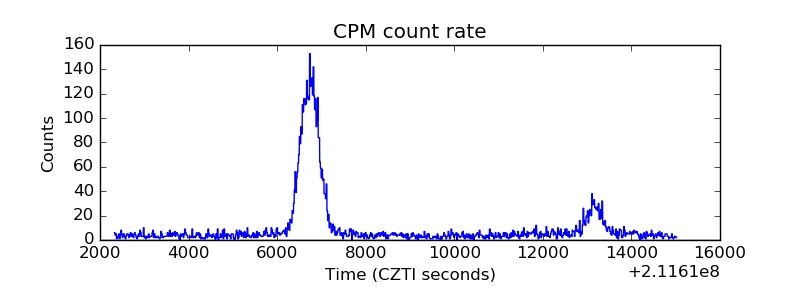 |
| CZT Counter | 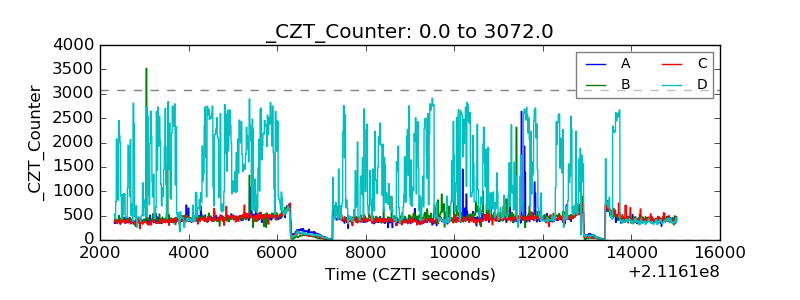 |
| +2.5 Volts monitor | 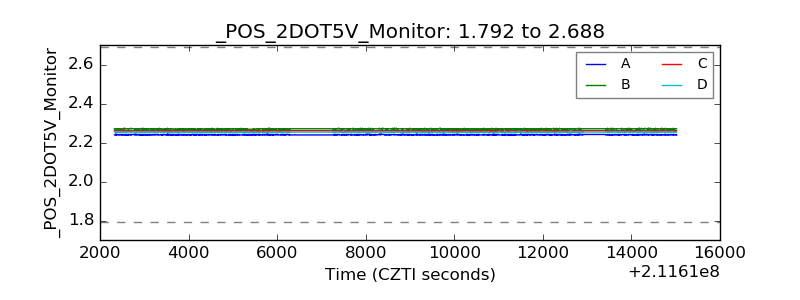 |
| +5 Volts monitor |  |
| _ROLL_ROT | 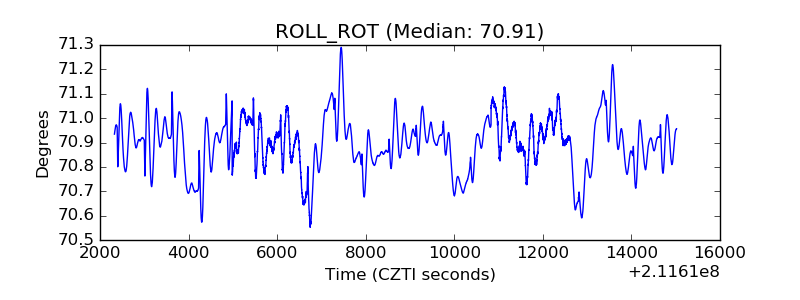 |
| _Roll_DEC | 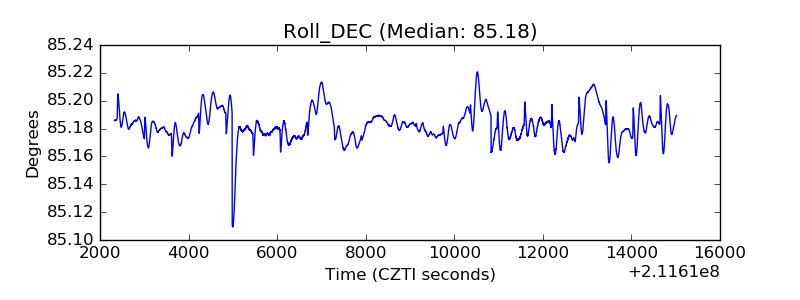 |
| _Roll_RA | 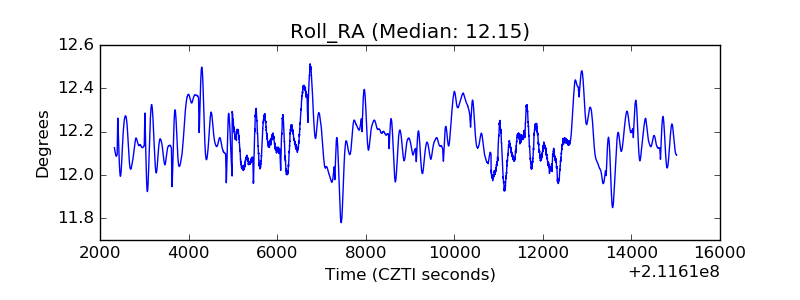 |
| Veto Counter | 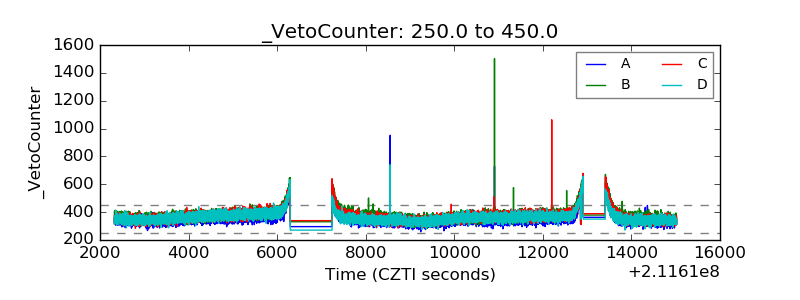 |