| Param | Original file | Final file |
|---|---|---|
| Filename | modeM0/AS1G05_240T02_9000000670_05251cztM0_level2.evt | modeM0/AS1G05_240T02_9000000670_05251cztM0_level2_quad_clean.evt |
| Size (bytes) | 312,995,520 | 56,312,640 |
| Size | 298.5 MB | 53.7 MB |
| Events in quadrant A | 2,127,586 | 356,263 |
| Events in quadrant B | 2,050,674 | 362,104 |
| Events in quadrant C | 1,973,344 | 352,147 |
| Events in quadrant D | 3,033,632 | 331,179 |
| Mode SS | |||
|---|---|---|---|
| Quadrant | BADHDUFLAG | Total packets | Discarded packets |
| A | 0 | 86 | 0 |
| B | 0 | 86 | 0 |
| C | 0 | 86 | 0 |
| D | 0 | 86 | 0 |
| Mode M9 | |||
|---|---|---|---|
| Quadrant | BADHDUFLAG | Total packets | Discarded packets |
| A | 0 | 12 | 0 |
| B | 0 | 12 | 0 |
| C | 0 | 12 | 0 |
| D | 0 | 12 | 0 |
| Mode M0 | |||
|---|---|---|---|
| Quadrant | BADHDUFLAG | Total packets | Discarded packets |
| A | 0 | 8968 | 2 |
| B | 0 | 8940 | 1 |
| C | 0 | 8818 | 1 |
| D | 0 | 11872 | 1 |
| Quadrant | Total seconds | Saturated seconds | Saturation percentage |
|---|---|---|---|
| A | 4314 | 39 | 0.904033% |
| B | 4314 | 21 | 0.486787% |
| C | 4314 | 13 | 0.301344% |
| D | 4314 | 206 | 4.775151% |
Noise dominated data is calculated using 1-second bins in cleaned event files. If a bin has >2000 counts, and if more than 50% of those come from <1% of pixels, then it is considered to be noise-dominated and hence unusable.
| Quadrant | # 1 sec bins | Bins with >0 counts | Bins with >2000 counts | High rate bins dominated by noise | Noise dominated (total time) | Noise dominated (detector-on time) | Marked lightcurve |
|---|---|---|---|---|---|---|---|
| A | 5474 | 4315 | 7 | 7 | 0.13% | 0.16% | 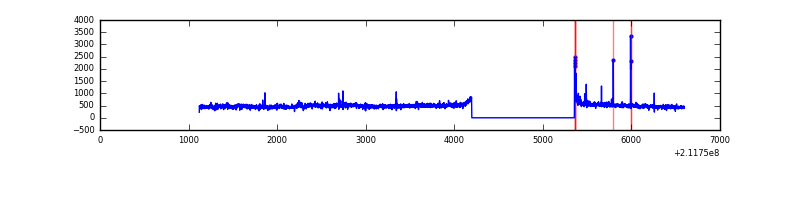 |
| B | 5474 | 4315 | 0 | 0 | 0.00% | 0.00% |  |
| C | 5474 | 4315 | 0 | 0 | 0.00% | 0.00% | 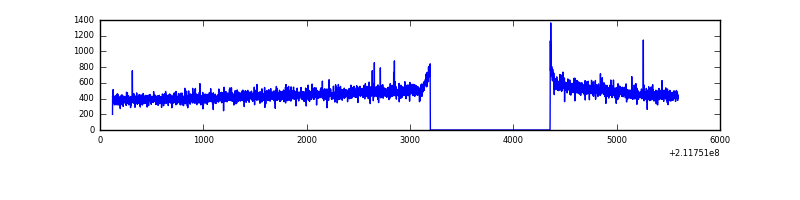 |
| D | 5474 | 4315 | 132 | 132 | 2.41% | 3.06% |  |
Top three noisy pixels from each quadrant. If the there are fewer than three noisy pixels in the level2.evt file, extra rows are filled as -1
| Pixel properties | Quadrant properties | ||||||
|---|---|---|---|---|---|---|---|
| Quadrant | DetID | PixID | Counts | Sigma | Mean | Median | Sigma |
| A | 0 | 247 | 106532 | 1019.28 | 509 | 499 | 104.0 |
| A | 0 | 50 | 40150 | 381.16 | 509 | 499 | 104.0 |
| A | 0 | 226 | 13905 | 128.87 | 509 | 499 | 104.0 |
| B | 0 | 229 | 17753 | 175.34 | 516 | 504 | 98.4 |
| B | 4 | 239 | 15404 | 151.46 | 516 | 504 | 98.4 |
| B | 12 | 111 | 9222 | 88.62 | 516 | 504 | 98.4 |
| C | 1 | 16 | 7489 | 59.64 | 502 | 504 | 117.1 |
| C | 13 | 61 | 4067 | 30.42 | 502 | 504 | 117.1 |
| C | 7 | 159 | 3116 | 22.3 | 502 | 504 | 117.1 |
| D | 11 | 145 | 538355 | 4507.21 | 488 | 473 | 119.3 |
| D | 2 | 16 | 341642 | 2858.84 | 488 | 473 | 119.3 |
| D | 8 | 195 | 211476 | 1768.11 | 488 | 473 | 119.3 |
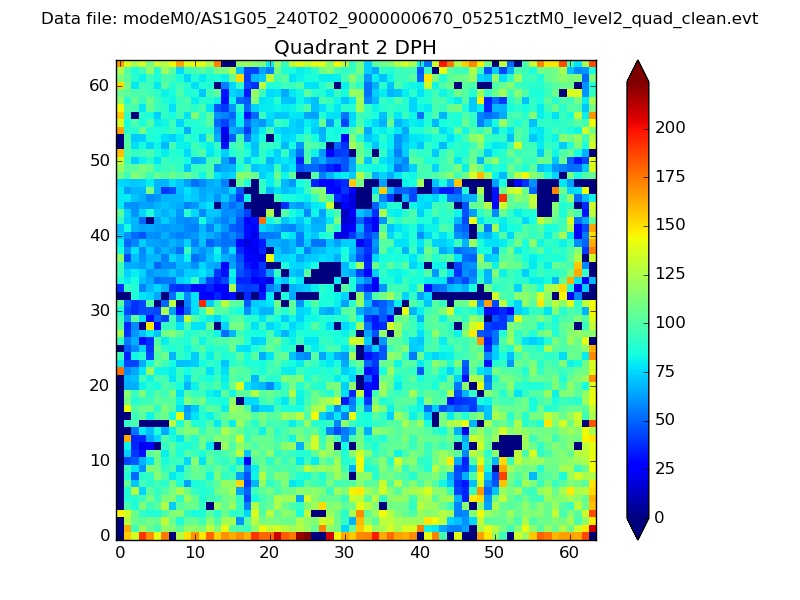
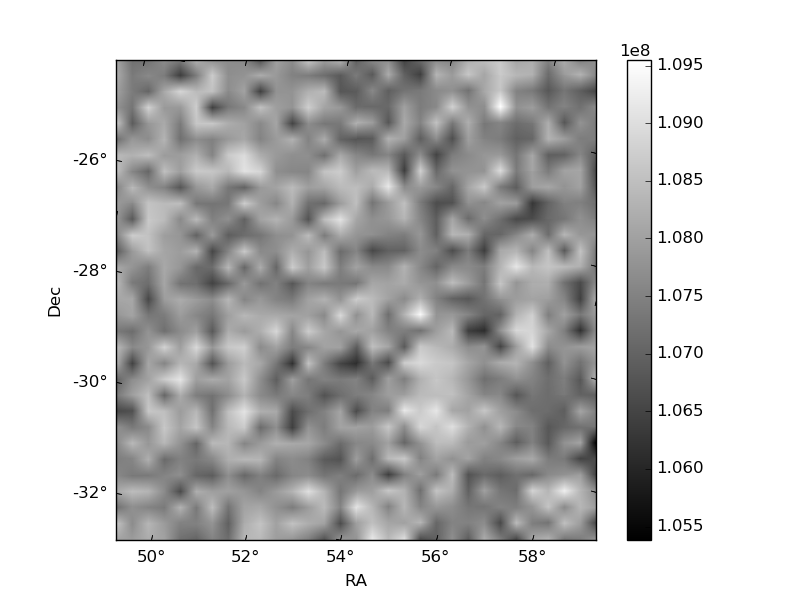
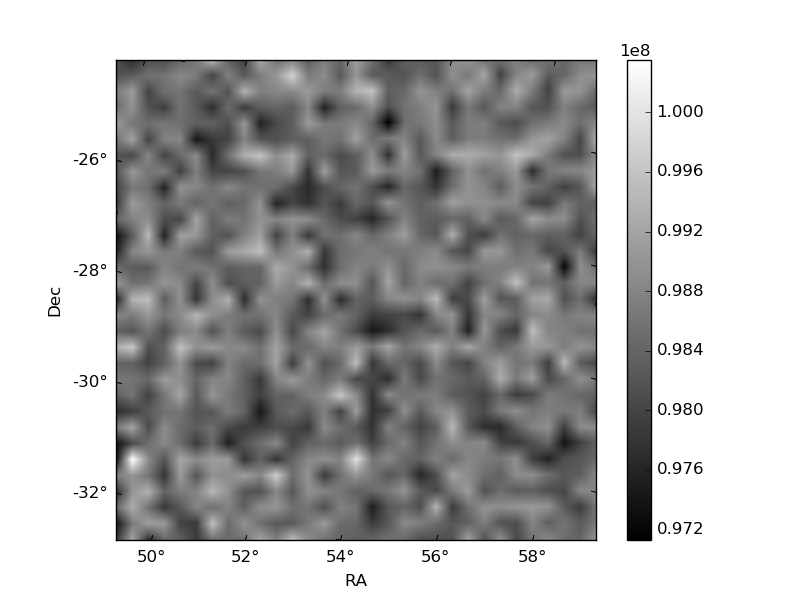
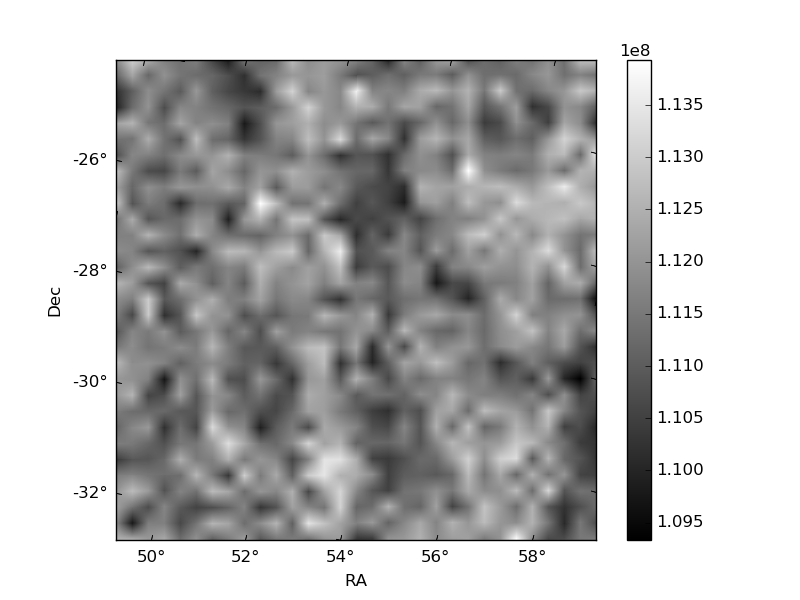
Histogram calculated using DETX and DETY for each event in the final _common_clean file
| Quadrant A | 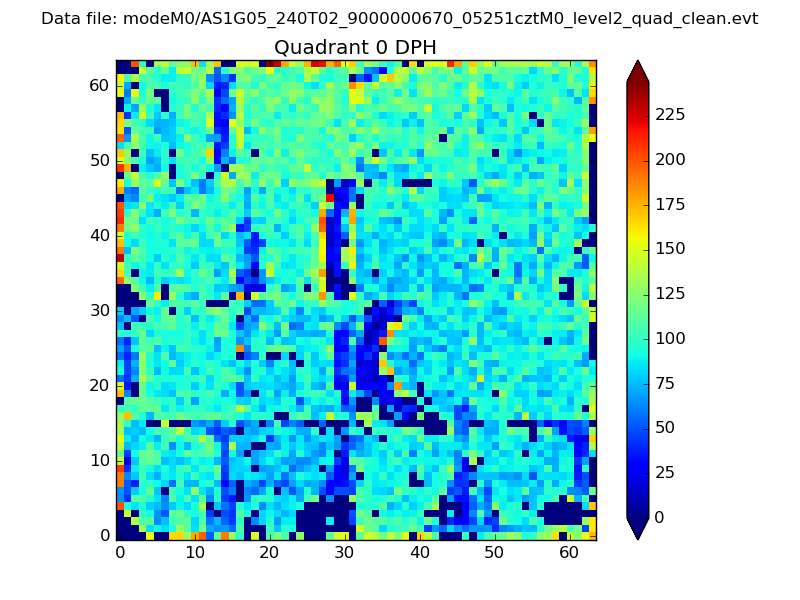 |
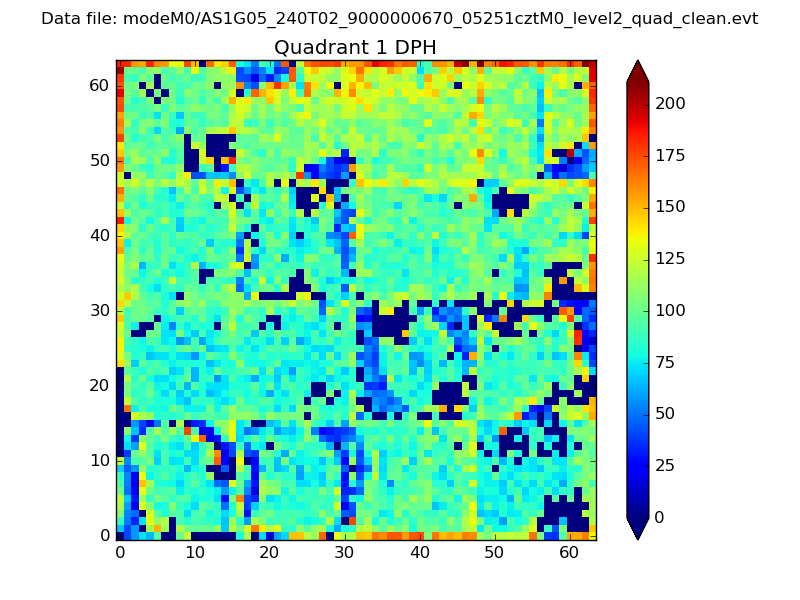 |
Quadrant B |
|---|---|---|---|
| Quadrant D | 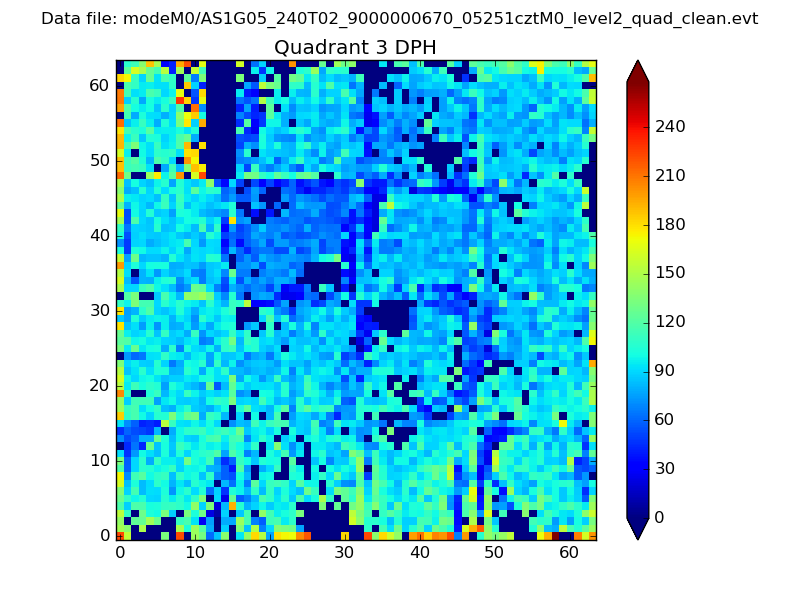 |
 |
Quadrant C |
| Plot type | Count rate plots | Images |
|---|---|---|
| Comparison with Poisson distribution Blue bars denote a histogram of data divided into 1 sec bins. Red curve is a Poisson curve with rate = median count rate of data. |
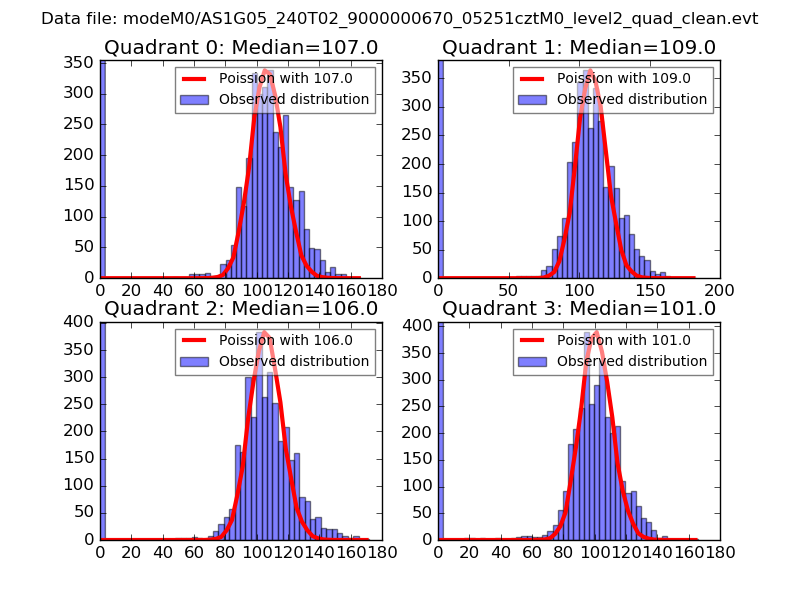 |
 |
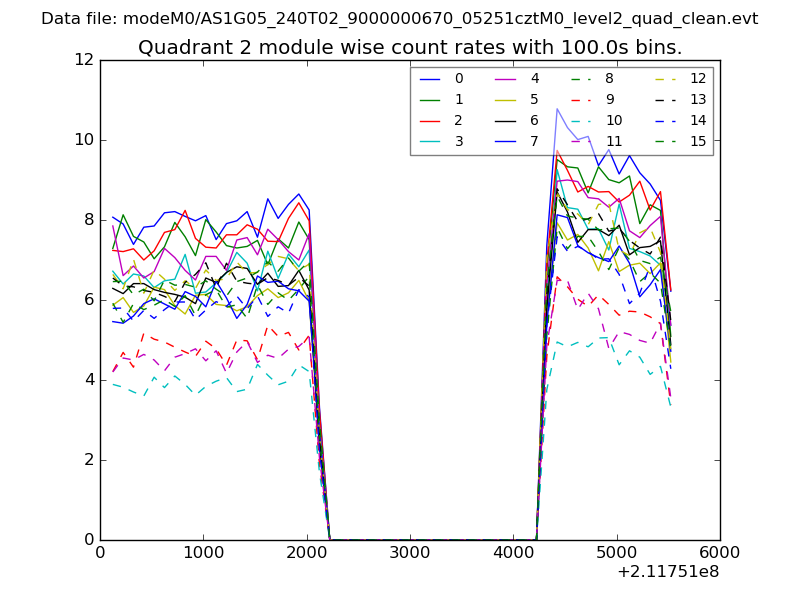
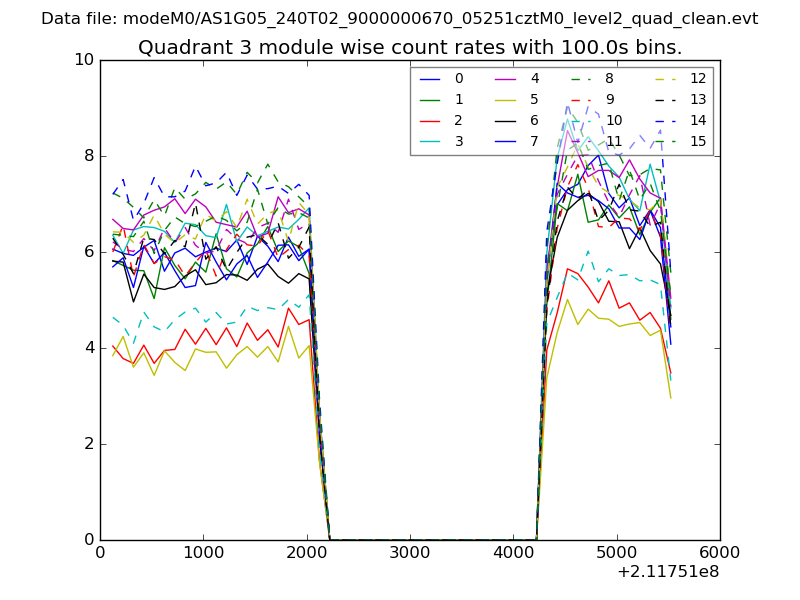
| Quadrant-wise count rates Data is divided into 100 sec bins |
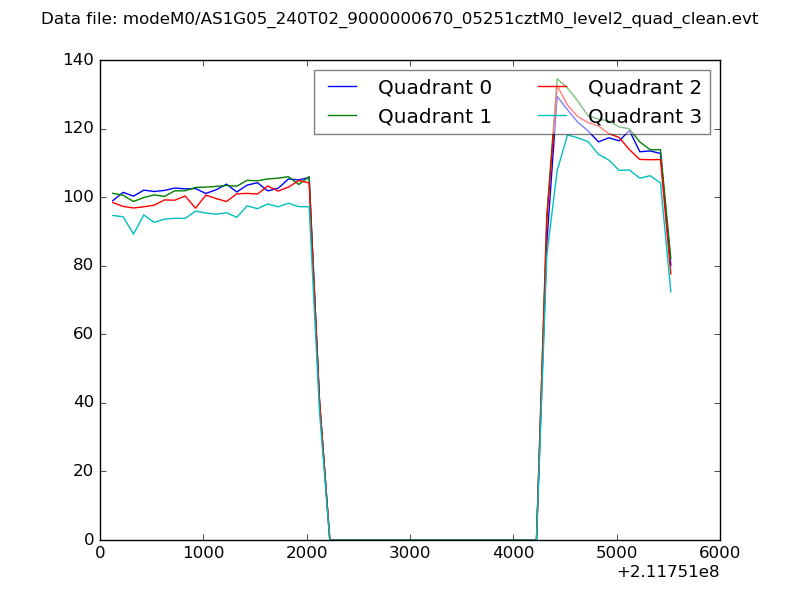 |
|
| Module-wise count rates for Quadrant A Data is divided into 100 sec bins |
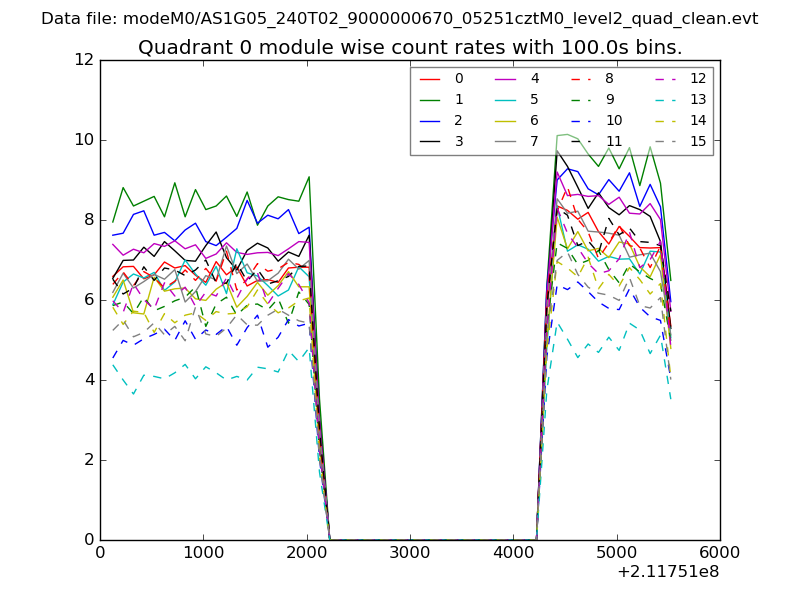 |
 |
| Module-wise count rates for Quadrant B Data is divided into 100 sec bins |
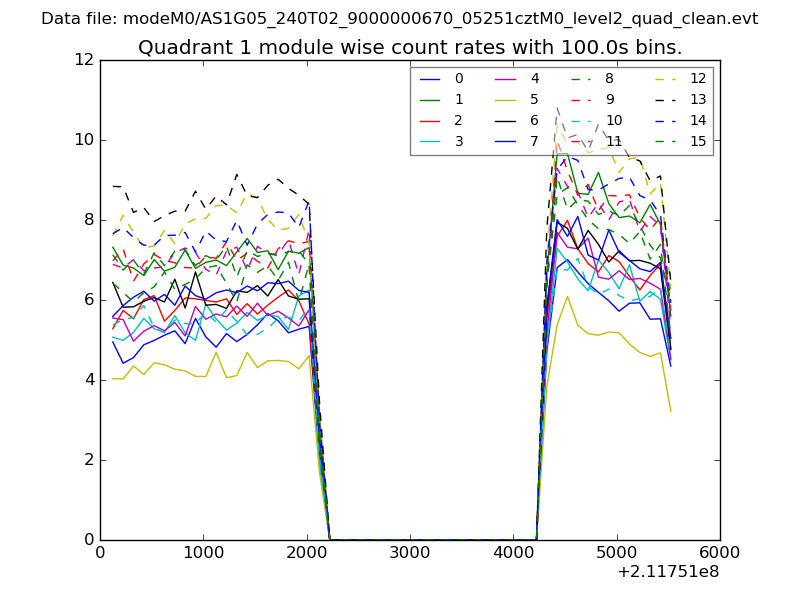 |
 |
| Module-wise count rates for Quadrant C Data is divided into 100 sec bins |
 |
 |
| Module-wise count rates for Quadrant D Data is divided into 100 sec bins |
 |
 |
| Parameter | Plot |
|---|---|
| CZT HV Monitor | 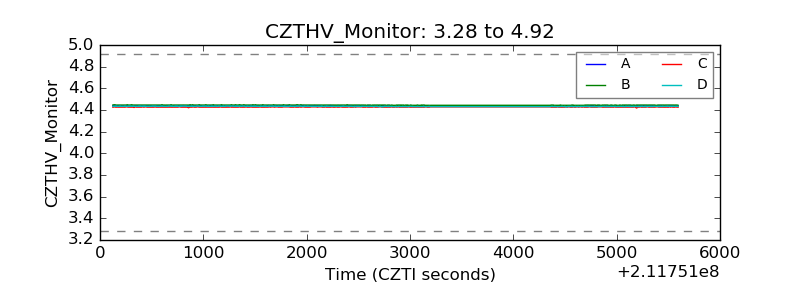 |
| D_VDD | 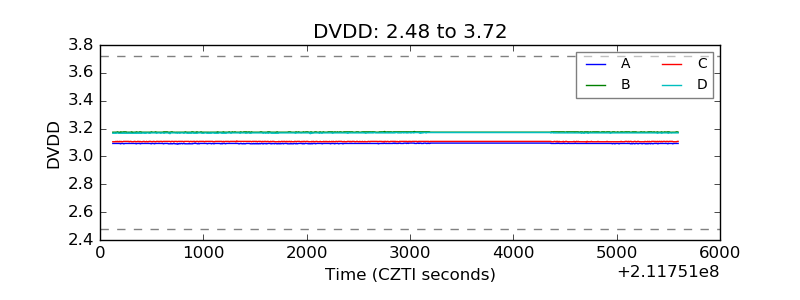 |
| Temperature 1 |  |
| Veto HV Monitor | 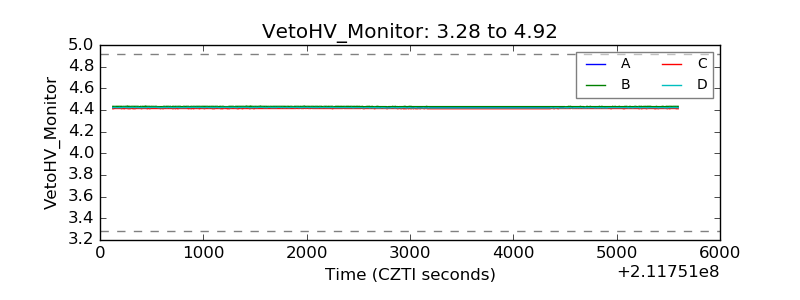 |
| Veto LLD | 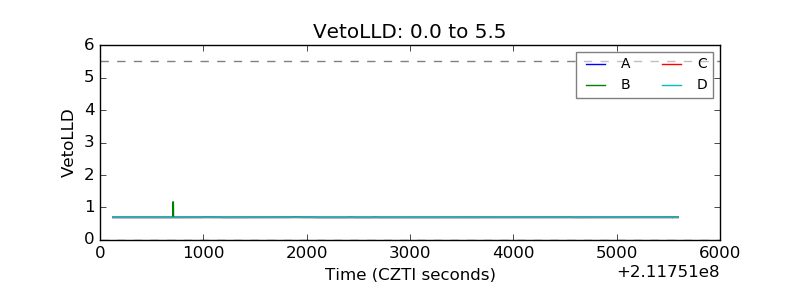 |
| Alpha Counter | 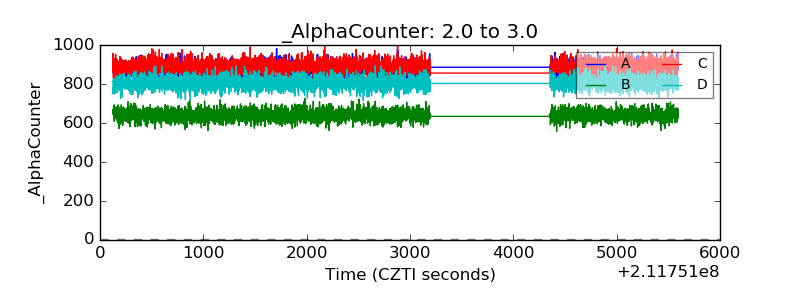 |
| _CPM_Rate | 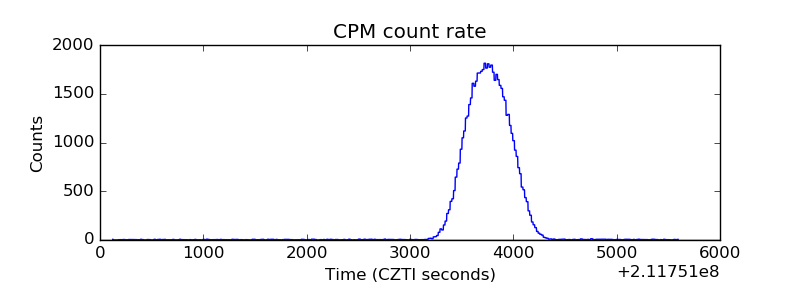 |
| CZT Counter | 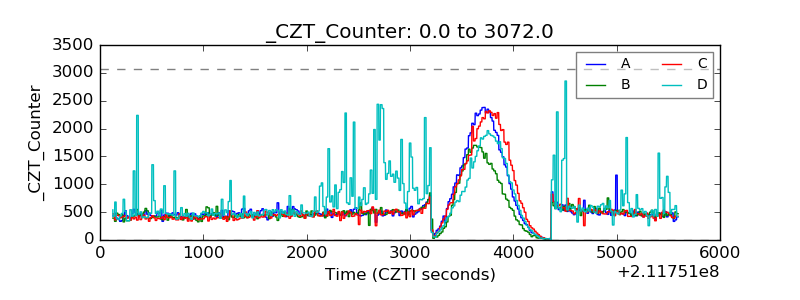 |
| +2.5 Volts monitor |  |
| +5 Volts monitor |  |
| _ROLL_ROT | 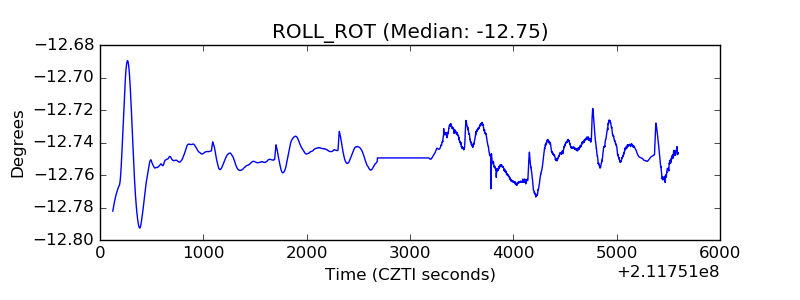 |
| _Roll_DEC | 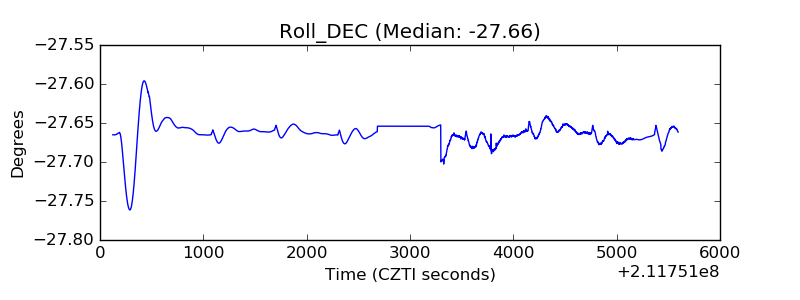 |
| _Roll_RA | 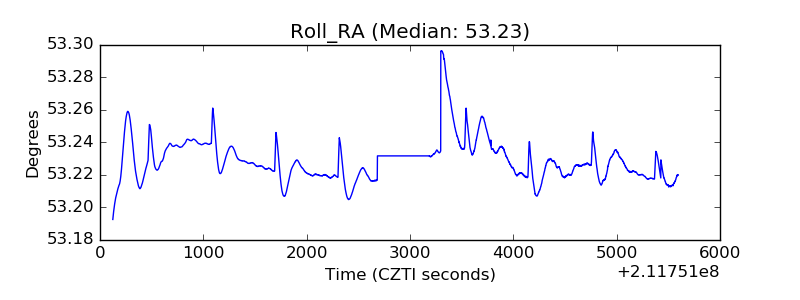 |
| Veto Counter | 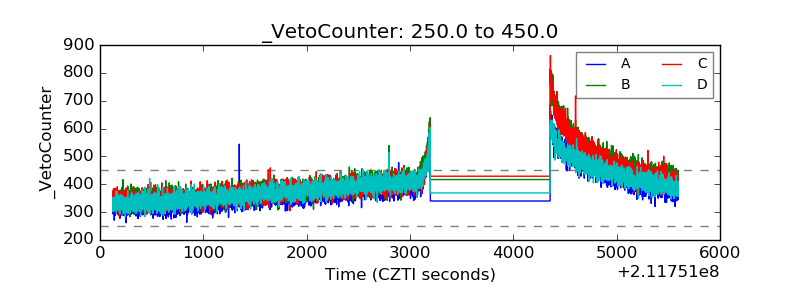 |