| Param | Original file | Final file |
|---|---|---|
| Filename | modeM0/AS1G05_240T02_9000000670_05255cztM0_level2.evt | modeM0/AS1G05_240T02_9000000670_05255cztM0_level2_quad_clean.evt |
| Size (bytes) | 538,035,840 | 70,819,200 |
| Size | 513.1 MB | 67.5 MB |
| Events in quadrant A | 2,847,665 | 444,981 |
| Events in quadrant B | 2,913,918 | 451,896 |
| Events in quadrant C | 2,978,750 | 441,086 |
| Events in quadrant D | 7,134,997 | 375,383 |
| Mode SS | |||
|---|---|---|---|
| Quadrant | BADHDUFLAG | Total packets | Discarded packets |
| A | 0 | 126 | 0 |
| B | 0 | 126 | 0 |
| C | 0 | 126 | 0 |
| D | 0 | 126 | 0 |
| Mode M9 | |||
|---|---|---|---|
| Quadrant | BADHDUFLAG | Total packets | Discarded packets |
| A | 0 | 12 | 0 |
| B | 0 | 12 | 0 |
| C | 0 | 12 | 0 |
| D | 0 | 12 | 0 |
| Mode M0 | |||
|---|---|---|---|
| Quadrant | BADHDUFLAG | Total packets | Discarded packets |
| A | 0 | 12670 | 5 |
| B | 0 | 12708 | 2 |
| C | 0 | 12845 | 2 |
| D | 0 | 25451 | 20 |
| Quadrant | Total seconds | Saturated seconds | Saturation percentage |
|---|---|---|---|
| A | 6168 | 35 | 0.567445% |
| B | 6169 | 41 | 0.664613% |
| C | 6169 | 32 | 0.518723% |
| D | 6165 | 1808 | 29.326845% |
Noise dominated data is calculated using 1-second bins in cleaned event files. If a bin has >2000 counts, and if more than 50% of those come from <1% of pixels, then it is considered to be noise-dominated and hence unusable.
| Quadrant | # 1 sec bins | Bins with >0 counts | Bins with >2000 counts | High rate bins dominated by noise | Noise dominated (total time) | Noise dominated (detector-on time) | Marked lightcurve |
|---|---|---|---|---|---|---|---|
| A | 7384 | 6171 | 0 | 0 | 0.00% | 0.00% |  |
| B | 7384 | 6171 | 0 | 0 | 0.00% | 0.00% |  |
| C | 7384 | 6171 | 0 | 0 | 0.00% | 0.00% | 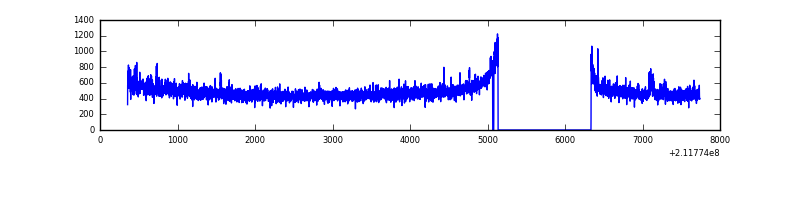 |
| D | 7384 | 6170 | 1425 | 1425 | 19.30% | 23.10% |  |
Top three noisy pixels from each quadrant. If the there are fewer than three noisy pixels in the level2.evt file, extra rows are filled as -1
| Pixel properties | Quadrant properties | ||||||
|---|---|---|---|---|---|---|---|
| Quadrant | DetID | PixID | Counts | Sigma | Mean | Median | Sigma |
| A | 0 | 50 | 18222 | 117.67 | 735 | 719 | 148.8 |
| A | 12 | 194 | 7262 | 43.99 | 735 | 719 | 148.8 |
| A | 0 | 226 | 7073 | 42.72 | 735 | 719 | 148.8 |
| B | 0 | 219 | 16618 | 111.05 | 743 | 724 | 143.1 |
| B | 12 | 111 | 13176 | 87.0 | 743 | 724 | 143.1 |
| B | 4 | 48 | 12070 | 79.28 | 743 | 724 | 143.1 |
| C | 1 | 16 | 143063 | 846.31 | 725 | 730 | 168.2 |
| C | 13 | 61 | 5858 | 30.49 | 725 | 730 | 168.2 |
| C | 8 | 222 | 2534 | 10.73 | 725 | 730 | 168.2 |
| D | 11 | 145 | 4629019 | 32410.95 | 584 | 568 | 142.8 |
| D | 8 | 195 | 149591 | 1043.54 | 584 | 568 | 142.8 |
| D | 2 | 136 | 66767 | 463.56 | 584 | 568 | 142.8 |
Histogram calculated using DETX and DETY for each event in the final _common_clean file
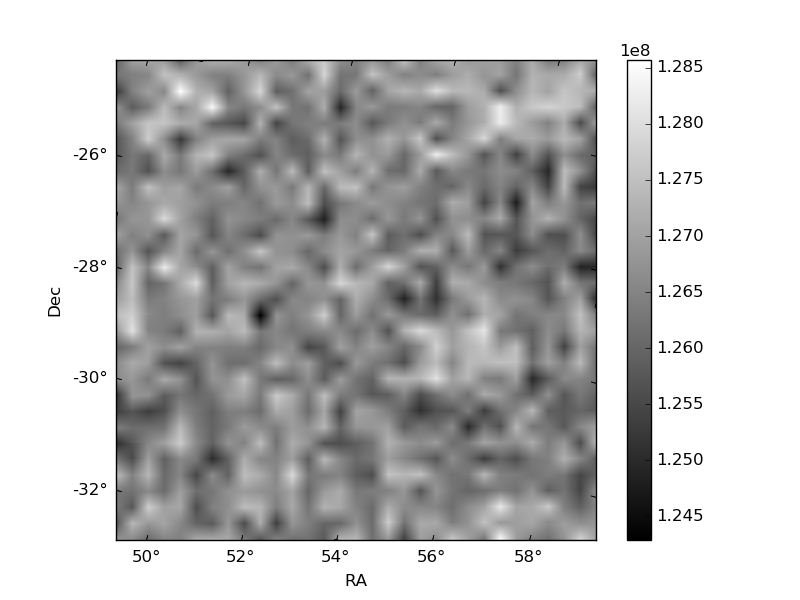
| Quadrant A | 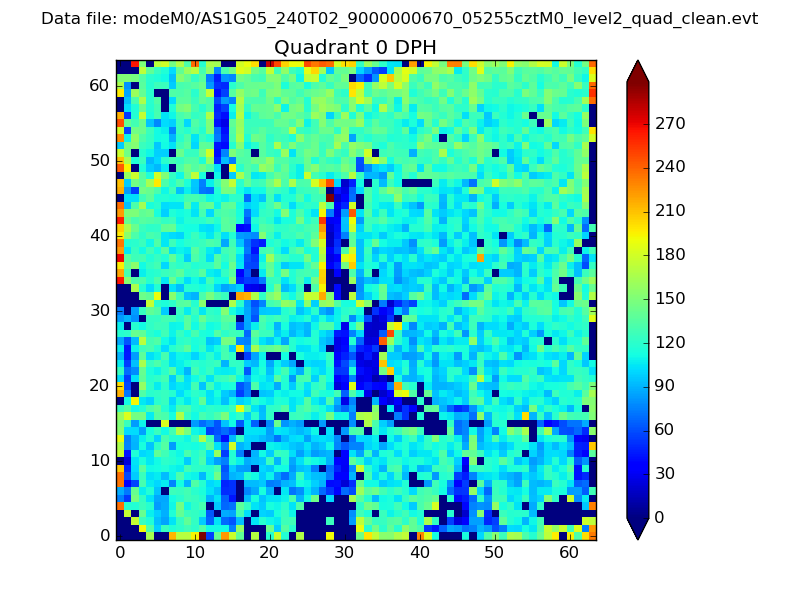 |
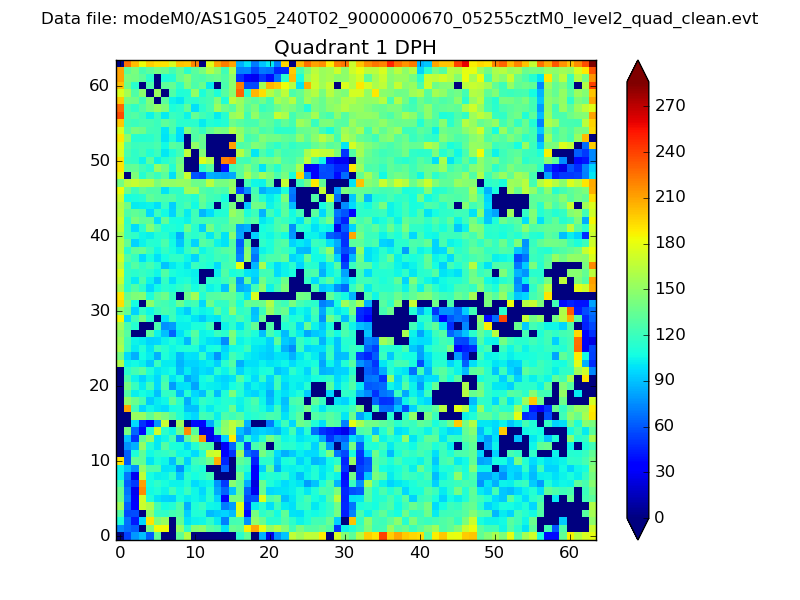 |
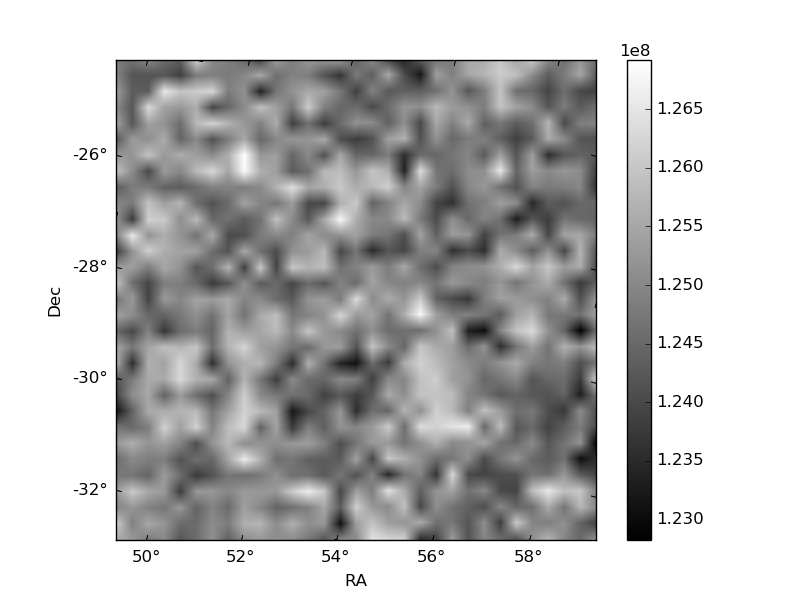
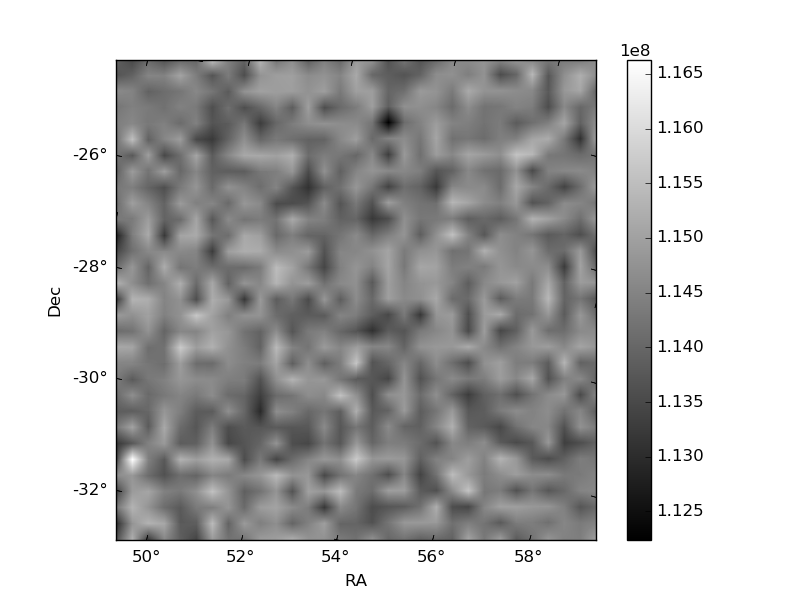
Quadrant B |
|---|---|---|---|
| Quadrant D | 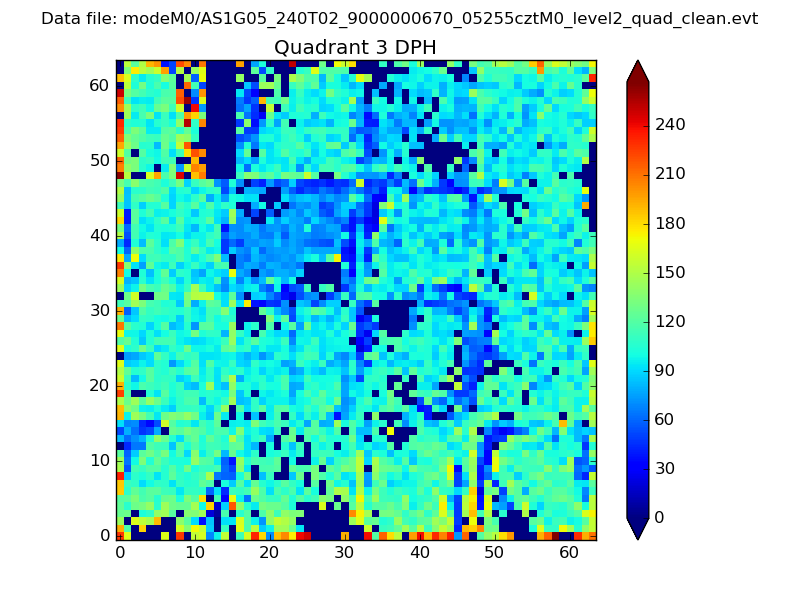 |
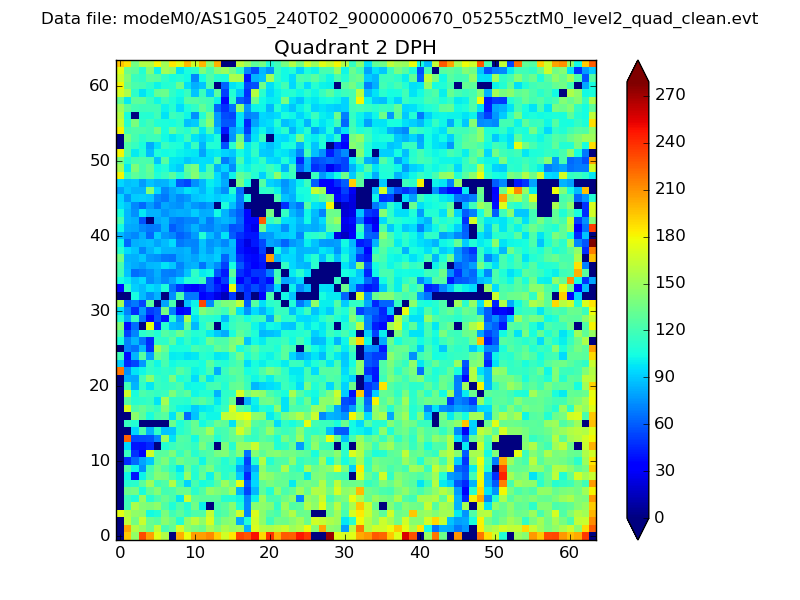 |
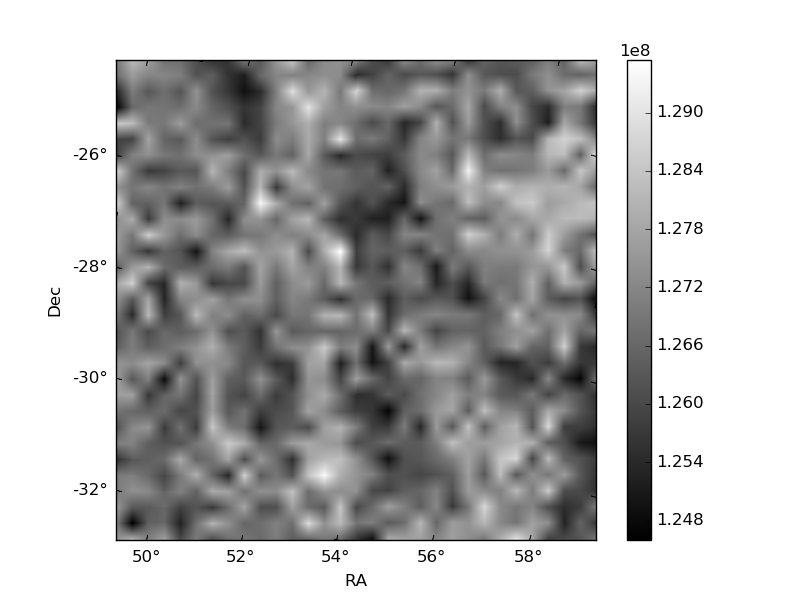
Quadrant C |
| Plot type | Count rate plots | Images |
|---|---|---|
| Comparison with Poisson distribution Blue bars denote a histogram of data divided into 1 sec bins. Red curve is a Poisson curve with rate = median count rate of data. |
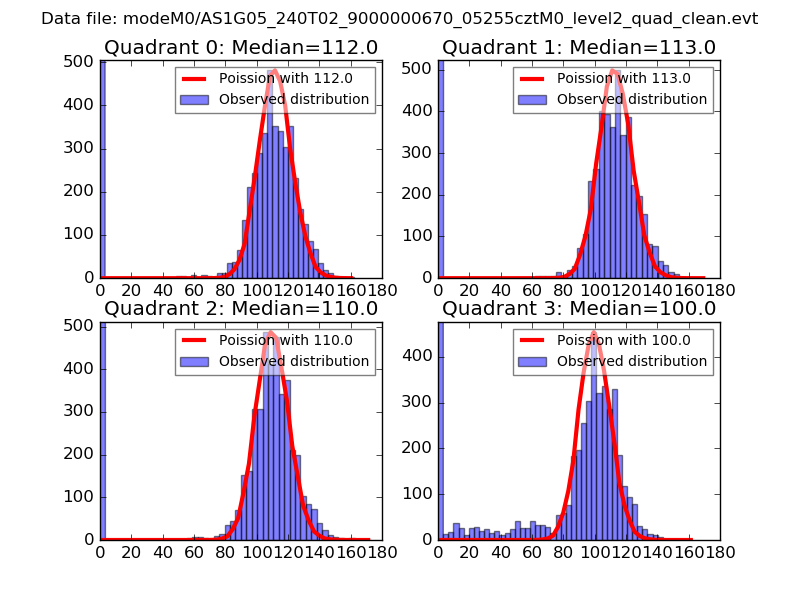 |
 |
| Quadrant-wise count rates Data is divided into 100 sec bins |
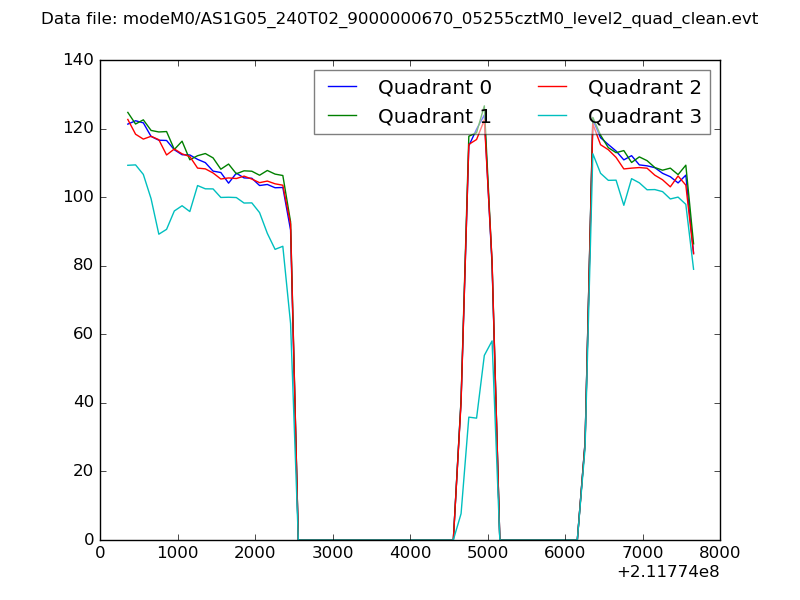 |
|
| Module-wise count rates for Quadrant A Data is divided into 100 sec bins |
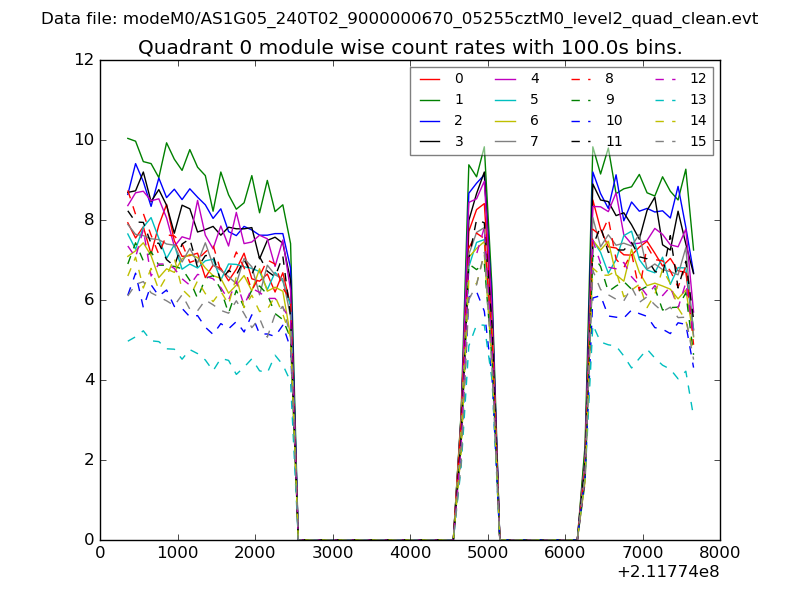 |
 |
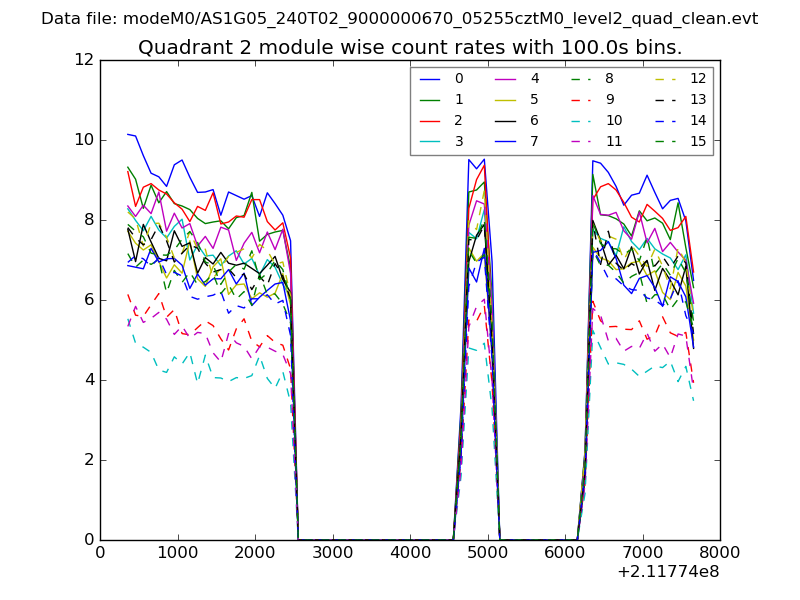
| Module-wise count rates for Quadrant B Data is divided into 100 sec bins |
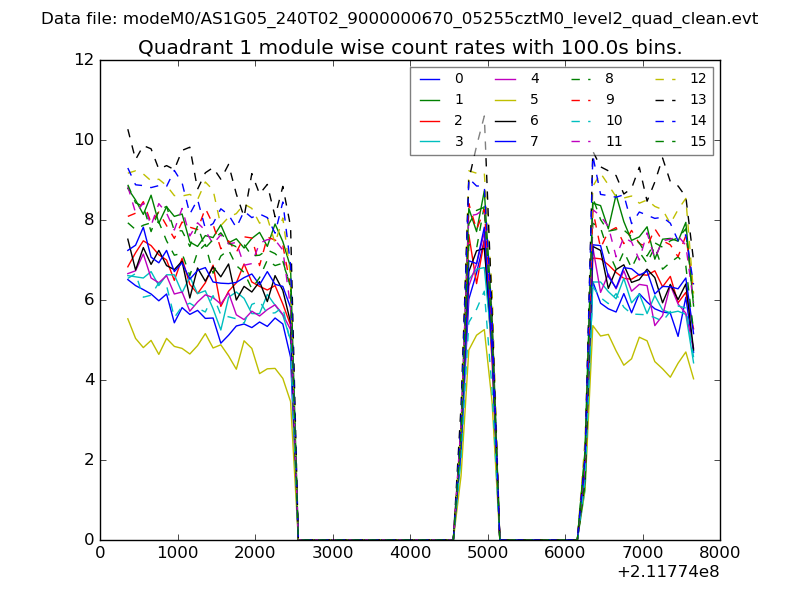 |
 |
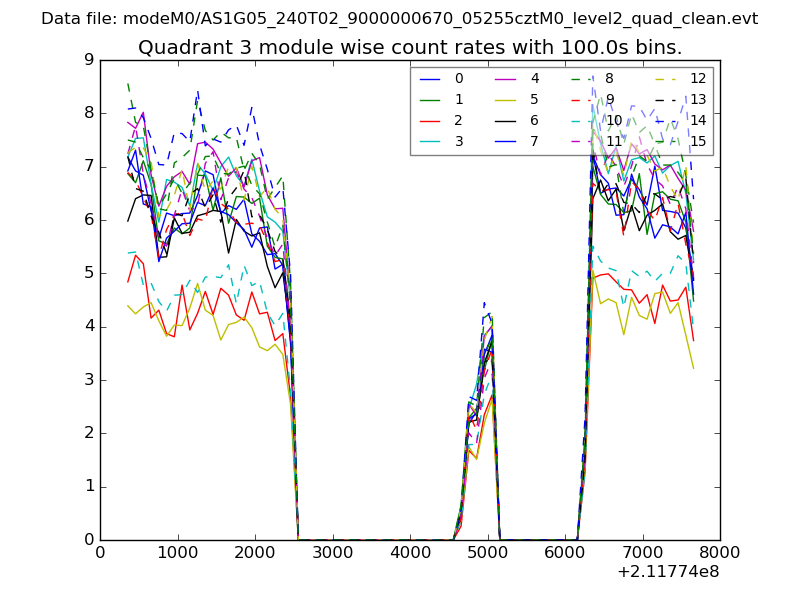
| Module-wise count rates for Quadrant C Data is divided into 100 sec bins |
 |
 |
| Module-wise count rates for Quadrant D Data is divided into 100 sec bins |
 |
 |
| Parameter | Plot |
|---|---|
| CZT HV Monitor | 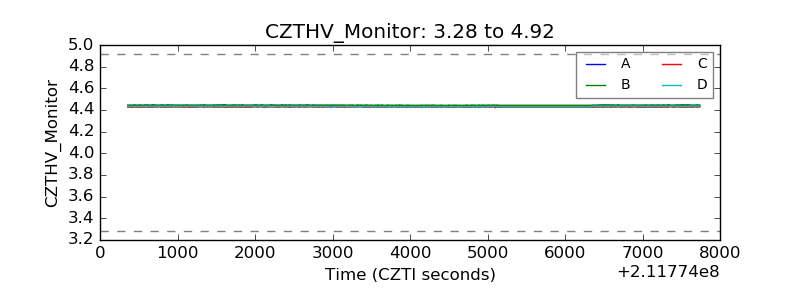 |
| D_VDD | 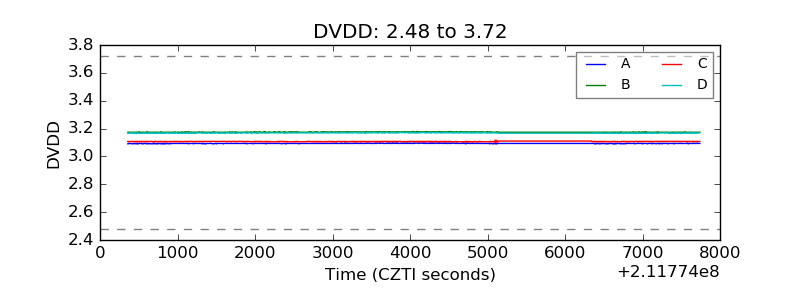 |
| Temperature 1 |  |
| Veto HV Monitor | 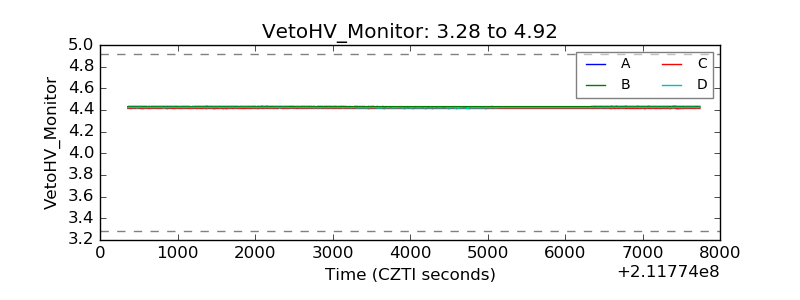 |
| Veto LLD |  |
| Alpha Counter | 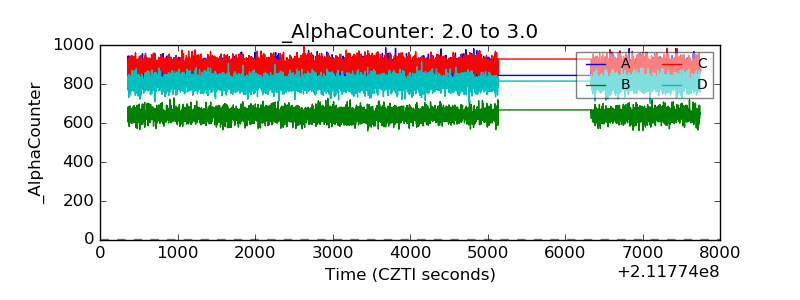 |
| _CPM_Rate | 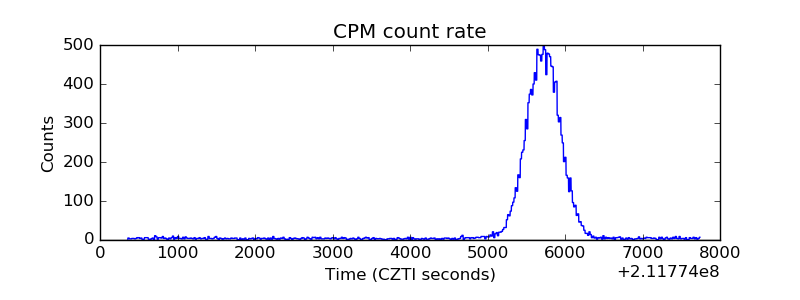 |
| CZT Counter | 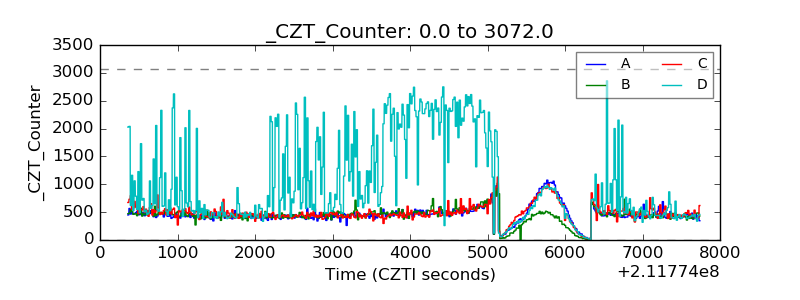 |
| +2.5 Volts monitor |  |
| +5 Volts monitor |  |
| _ROLL_ROT | 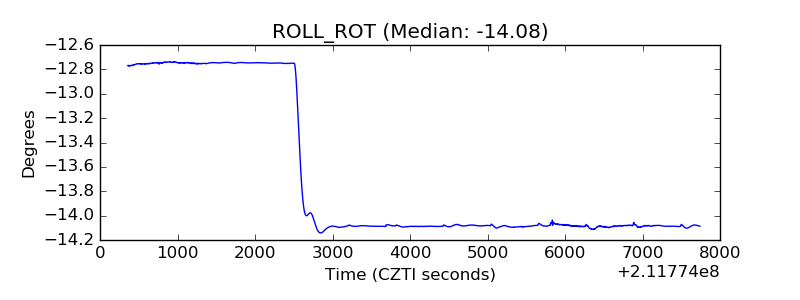 |
| _Roll_DEC | 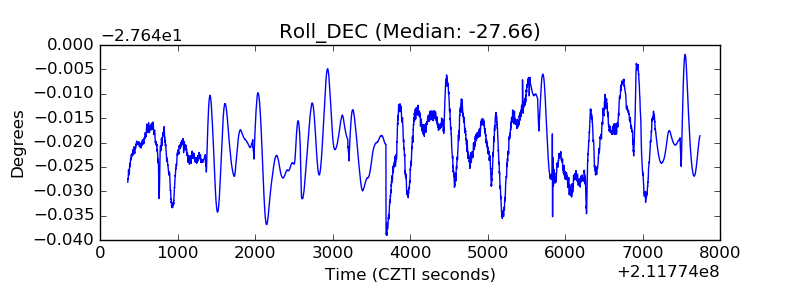 |
| _Roll_RA | 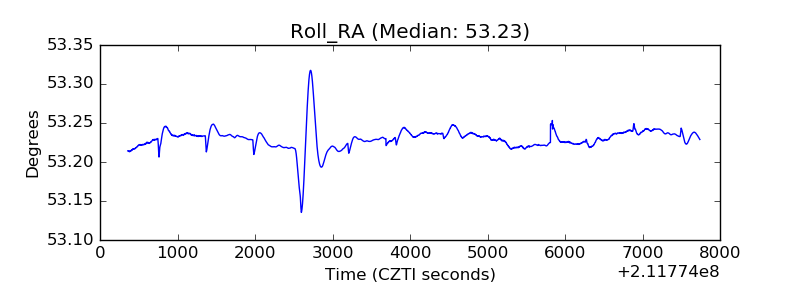 |
| Veto Counter | 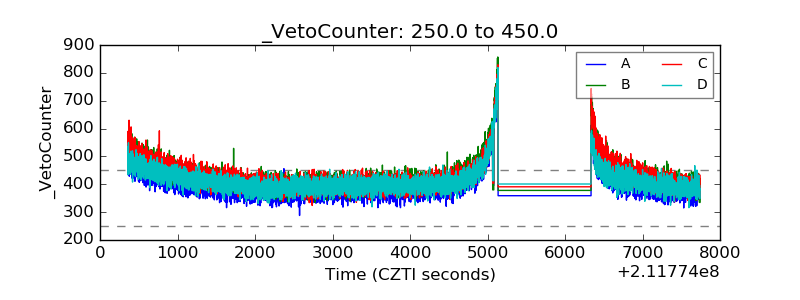 |