| Param | Original file | Final file |
|---|---|---|
| Filename | modeM0/AS1G05_240T02_9000000670_05256cztM0_level2.evt | modeM0/AS1G05_240T02_9000000670_05256cztM0_level2_quad_clean.evt |
| Size (bytes) | 448,015,680 | 59,114,880 |
| Size | 427.3 MB | 56.4 MB |
| Events in quadrant A | 2,874,963 | 358,996 |
| Events in quadrant B | 2,591,457 | 363,765 |
| Events in quadrant C | 2,541,327 | 355,892 |
| Events in quadrant D | 5,190,217 | 329,799 |
| Mode SS | |||
|---|---|---|---|
| Quadrant | BADHDUFLAG | Total packets | Discarded packets |
| A | 0 | 112 | 2 |
| B | 0 | 112 | 0 |
| C | 0 | 112 | 0 |
| D | 0 | 112 | 0 |
| Mode M9 | |||
|---|---|---|---|
| Quadrant | BADHDUFLAG | Total packets | Discarded packets |
| A | 0 | 9 | 0 |
| B | 0 | 9 | 0 |
| C | 0 | 9 | 0 |
| D | 0 | 10 | 0 |
| Mode M0 | |||
|---|---|---|---|
| Quadrant | BADHDUFLAG | Total packets | Discarded packets |
| A | 0 | 12256 | 71 |
| B | 0 | 11358 | 68 |
| C | 0 | 11313 | 79 |
| D | 0 | 19392 | 234 |
| Quadrant | Total seconds | Saturated seconds | Saturation percentage |
|---|---|---|---|
| A | 5455 | 85 | 1.558203% |
| B | 5453 | 44 | 0.806895% |
| C | 5449 | 33 | 0.605616% |
| D | 5422 | 763 | 14.072298% |
Noise dominated data is calculated using 1-second bins in cleaned event files. If a bin has >2000 counts, and if more than 50% of those come from <1% of pixels, then it is considered to be noise-dominated and hence unusable.
| Quadrant | # 1 sec bins | Bins with >0 counts | Bins with >2000 counts | High rate bins dominated by noise | Noise dominated (total time) | Noise dominated (detector-on time) | Marked lightcurve |
|---|---|---|---|---|---|---|---|
| A | 6424 | 5485 | 36 | 36 | 0.56% | 0.66% | 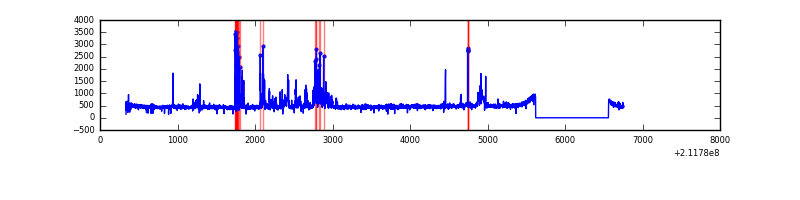 |
| B | 6424 | 5485 | 4 | 4 | 0.06% | 0.07% | 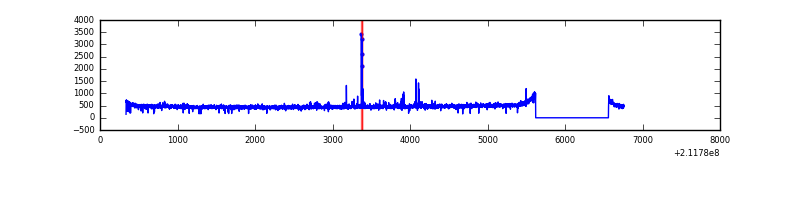 |
| C | 6424 | 5485 | 0 | 0 | 0.00% | 0.00% | 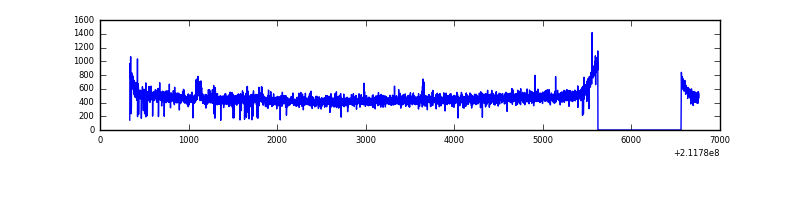 |
| D | 6424 | 5483 | 566 | 566 | 8.81% | 10.32% | 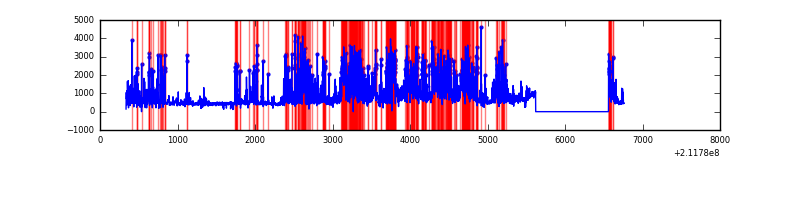 |
Top three noisy pixels from each quadrant. If the there are fewer than three noisy pixels in the level2.evt file, extra rows are filled as -1
| Pixel properties | Quadrant properties | ||||||
|---|---|---|---|---|---|---|---|
| Quadrant | DetID | PixID | Counts | Sigma | Mean | Median | Sigma |
| A | 0 | 50 | 390388 | 2947.05 | 644 | 629 | 132.3 |
| A | 13 | 251 | 6922 | 47.58 | 644 | 629 | 132.3 |
| A | 12 | 194 | 6468 | 44.15 | 644 | 629 | 132.3 |
| B | 4 | 48 | 39780 | 311.5 | 652 | 637 | 125.7 |
| B | 0 | 219 | 17951 | 137.78 | 652 | 637 | 125.7 |
| B | 12 | 111 | 11976 | 90.23 | 652 | 637 | 125.7 |
| C | 1 | 16 | 59427 | 395.23 | 634 | 638 | 148.7 |
| C | 13 | 61 | 5059 | 29.72 | 634 | 638 | 148.7 |
| C | 1 | 3 | 4363 | 25.04 | 634 | 638 | 148.7 |
| D | 11 | 145 | 2626812 | 17718.73 | 597 | 577 | 148.2 |
| D | 8 | 195 | 164028 | 1102.77 | 597 | 577 | 148.2 |
| D | 2 | 136 | 75139 | 503.06 | 597 | 577 | 148.2 |
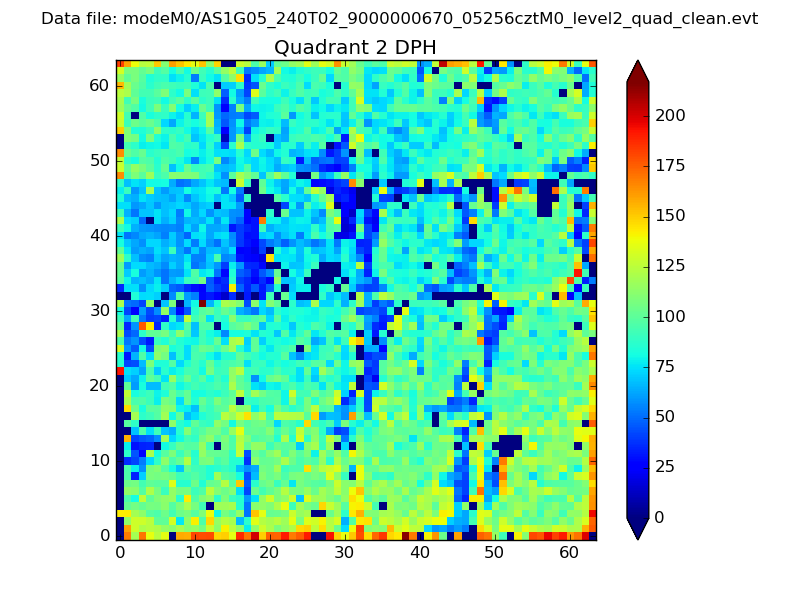
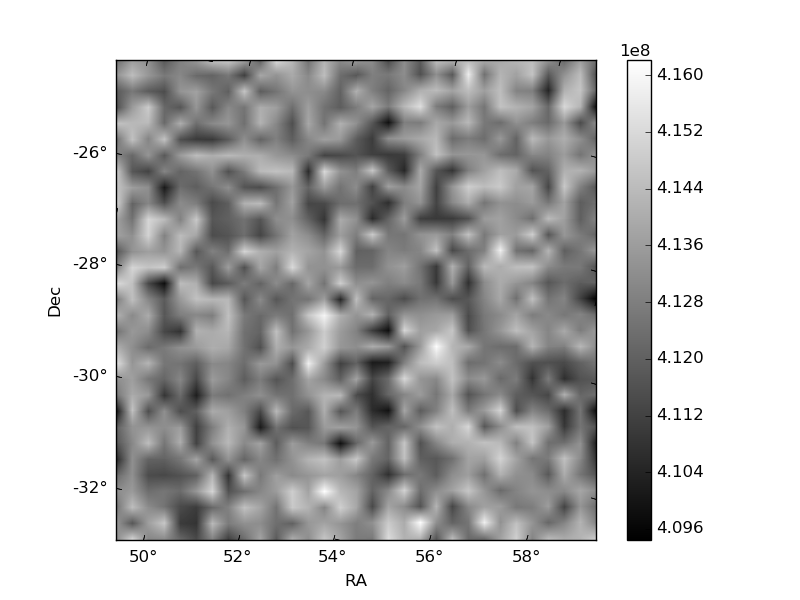
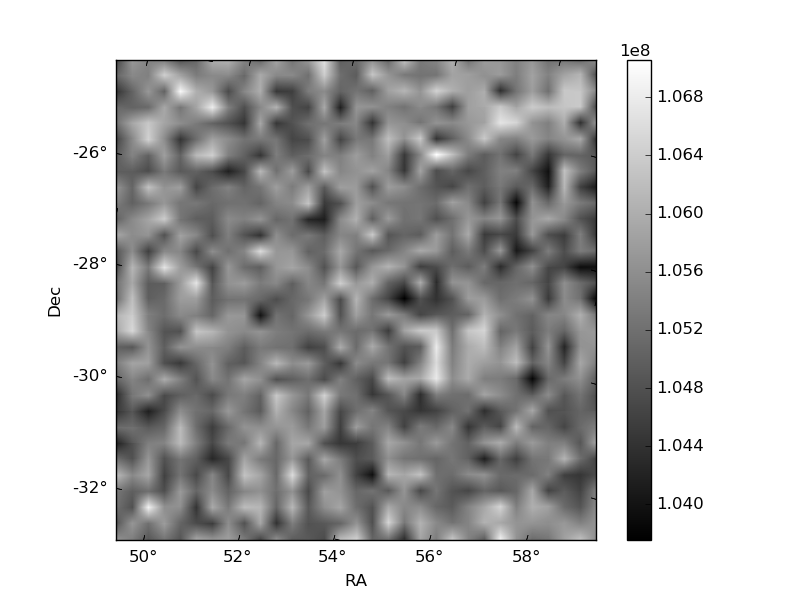
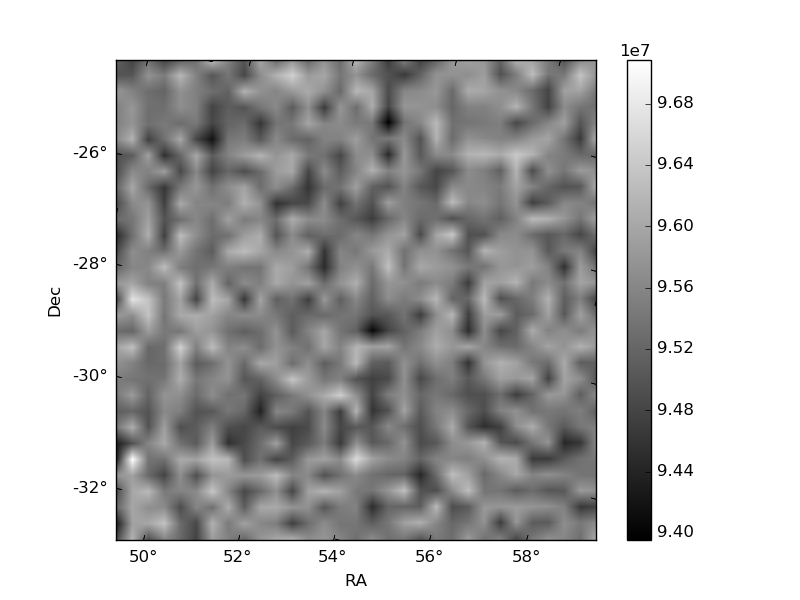
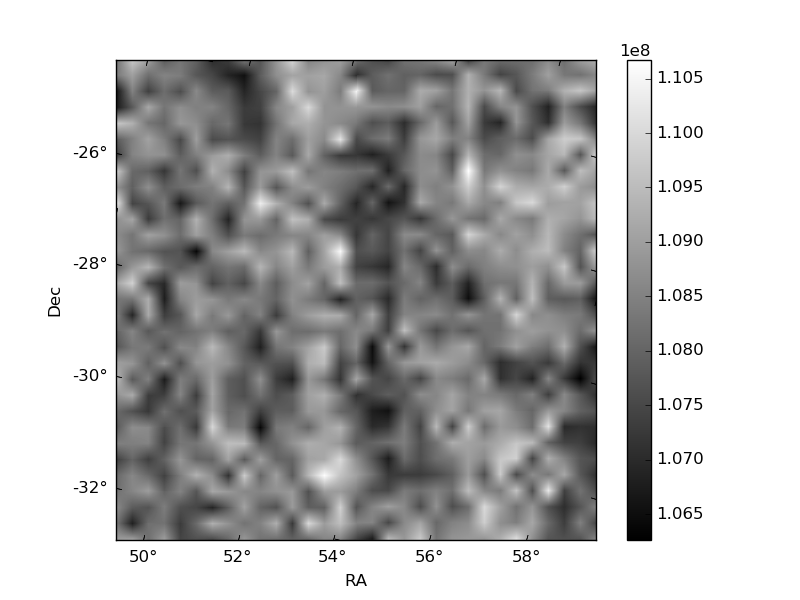
Histogram calculated using DETX and DETY for each event in the final _common_clean file
| Quadrant A | 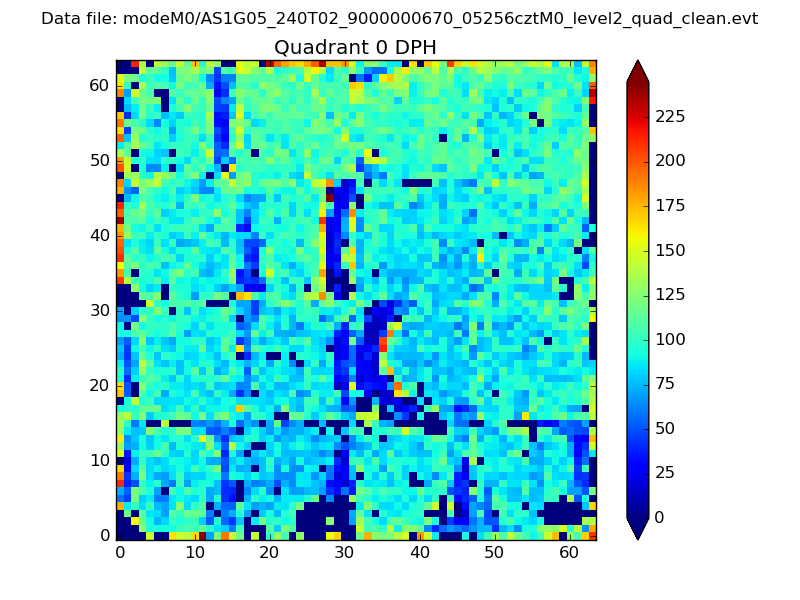 |
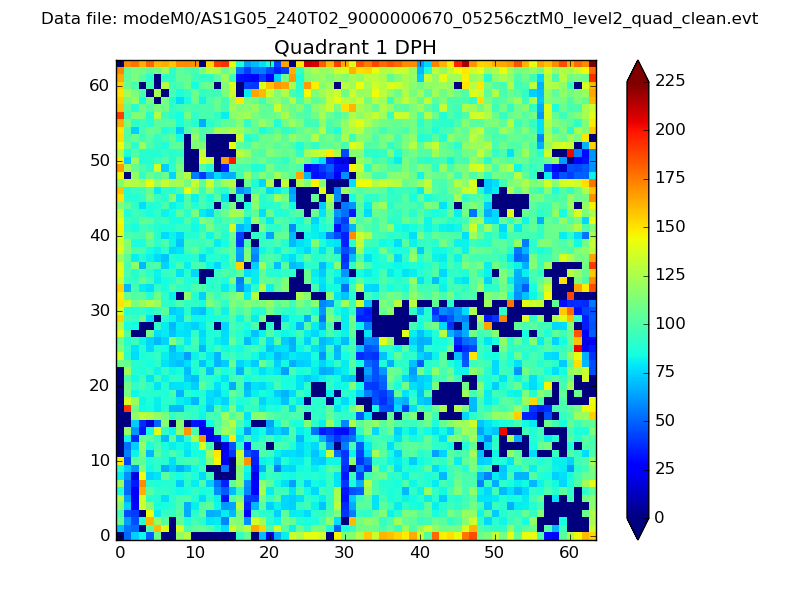 |
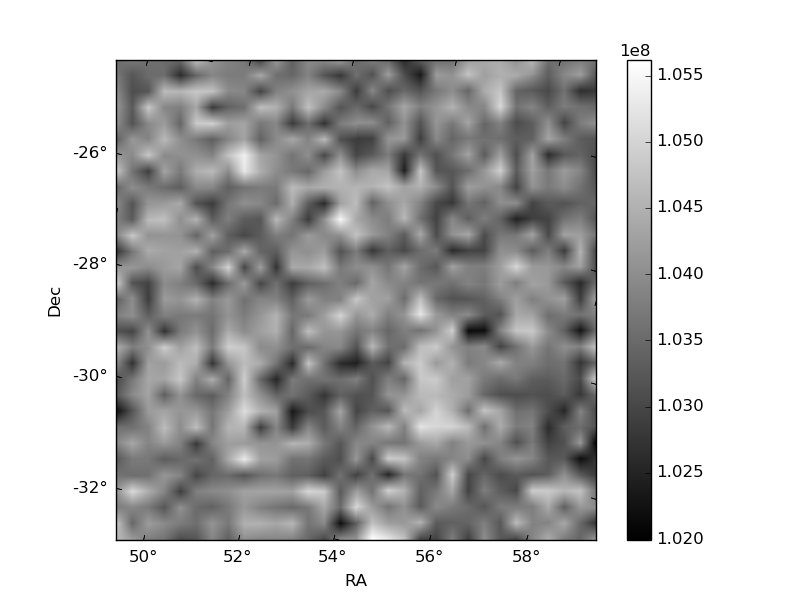
Quadrant B |
|---|---|---|---|
| Quadrant D | 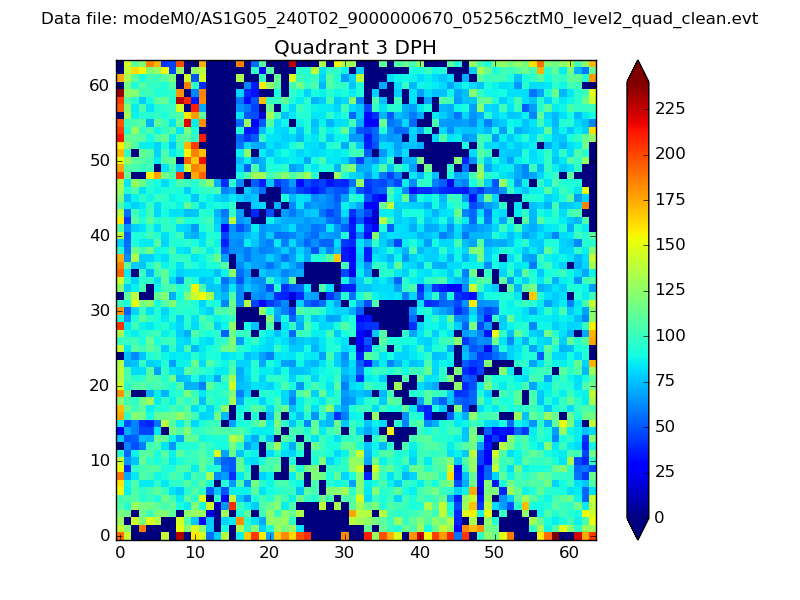 |
 |
Quadrant C |
| Plot type | Count rate plots | Images |
|---|---|---|
| Comparison with Poisson distribution Blue bars denote a histogram of data divided into 1 sec bins. Red curve is a Poisson curve with rate = median count rate of data. |
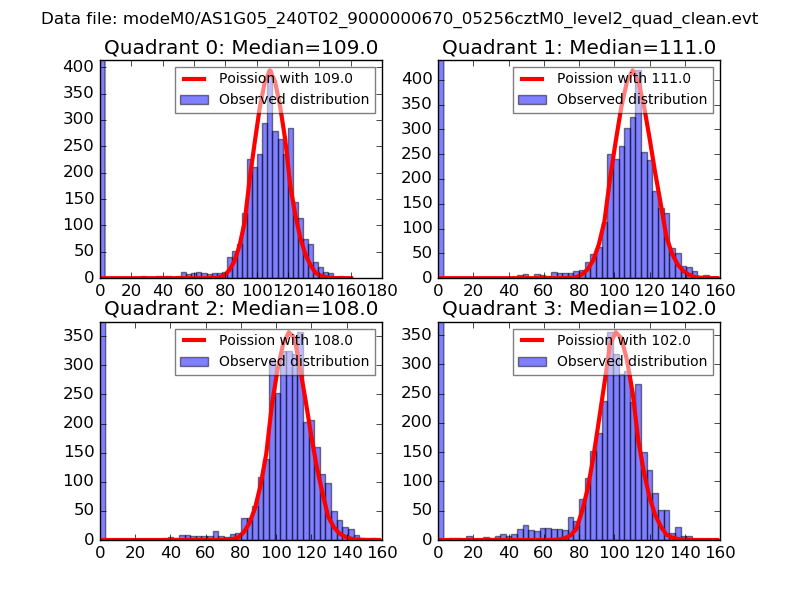 |
 |
| Quadrant-wise count rates Data is divided into 100 sec bins |
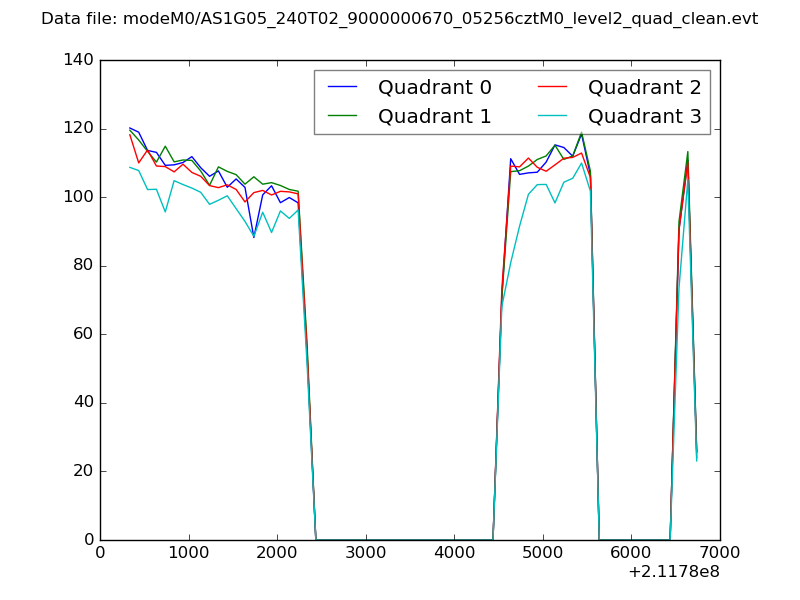 |
|
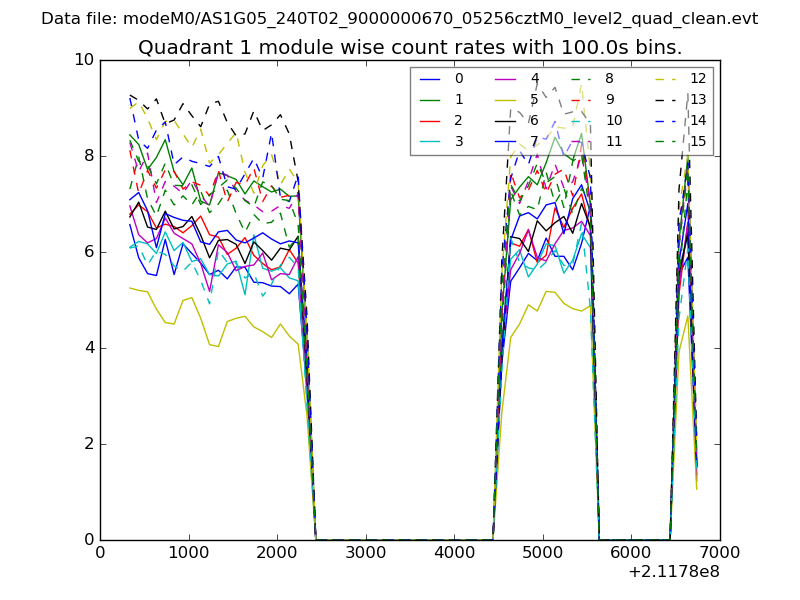
| Module-wise count rates for Quadrant A Data is divided into 100 sec bins |
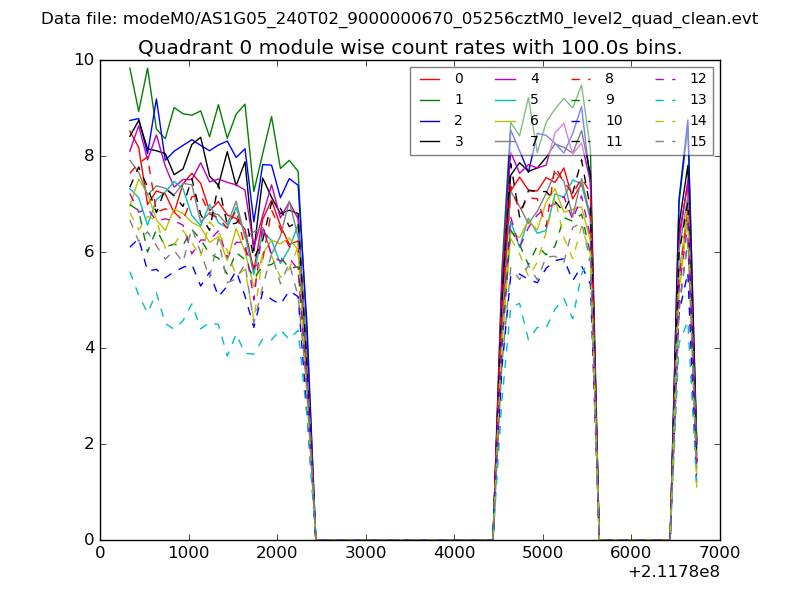 |
 |
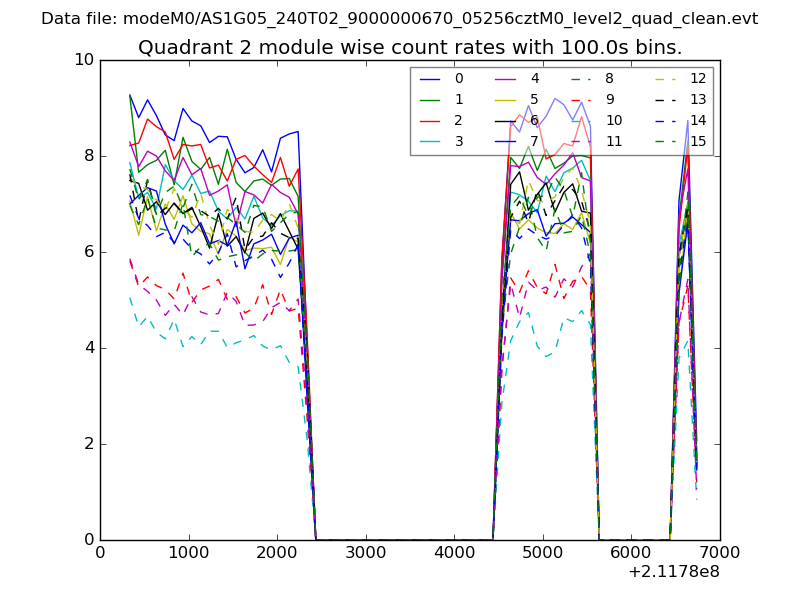
| Module-wise count rates for Quadrant B Data is divided into 100 sec bins |
 |
 |
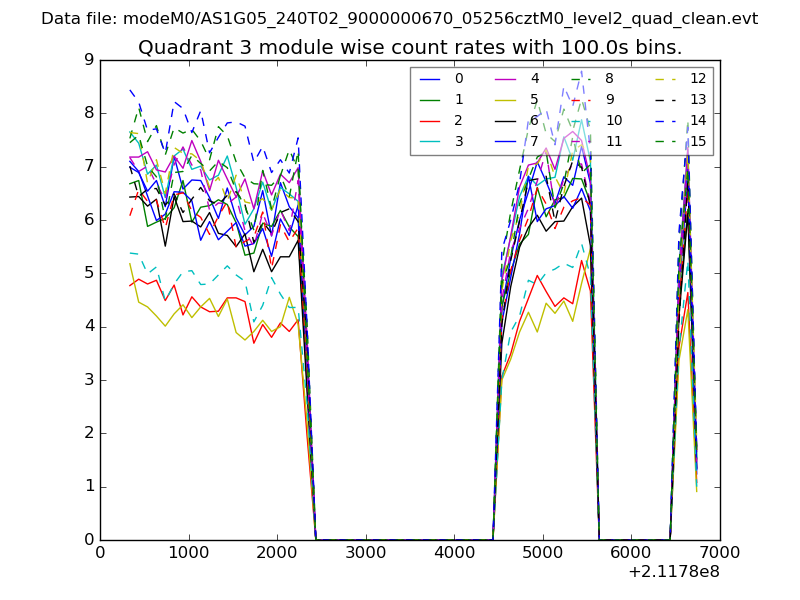
| Module-wise count rates for Quadrant C Data is divided into 100 sec bins |
 |
 |
| Module-wise count rates for Quadrant D Data is divided into 100 sec bins |
 |
 |
| Parameter | Plot |
|---|---|
| CZT HV Monitor | 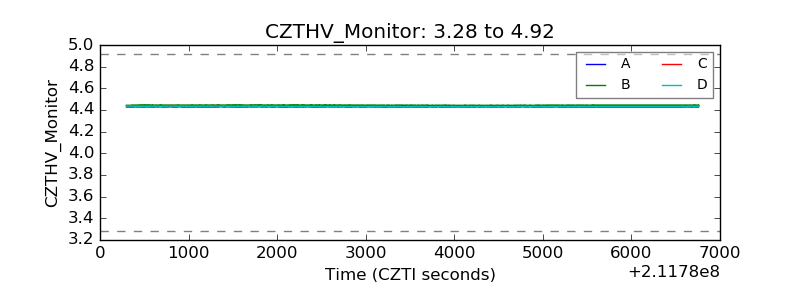 |
| D_VDD |  |
| Temperature 1 | 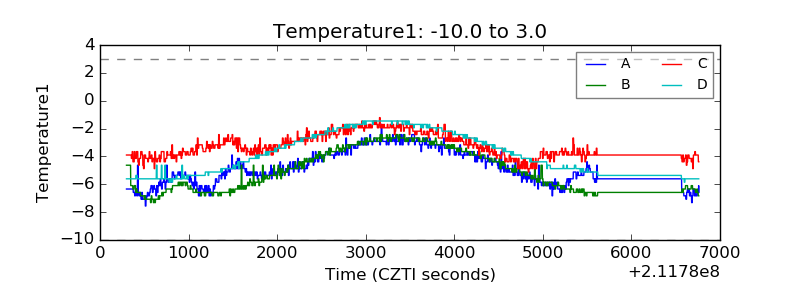 |
| Veto HV Monitor | 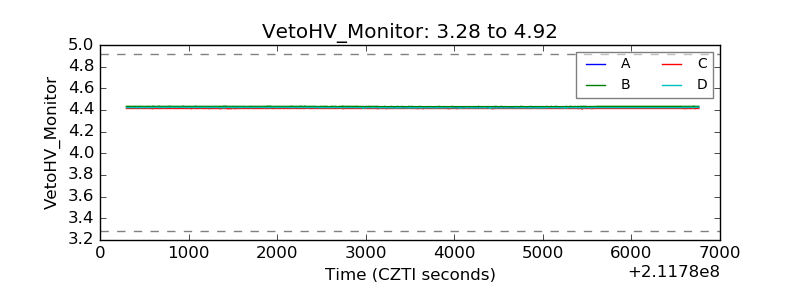 |
| Veto LLD | 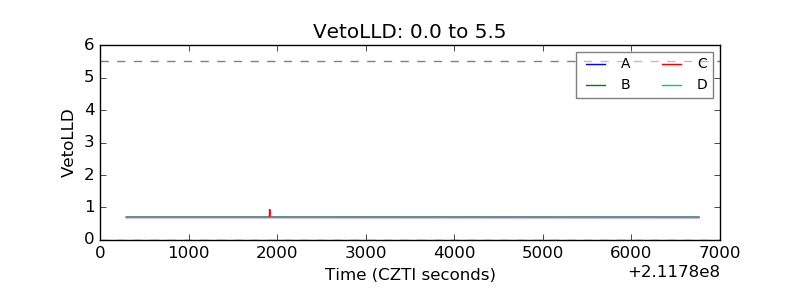 |
| Alpha Counter | 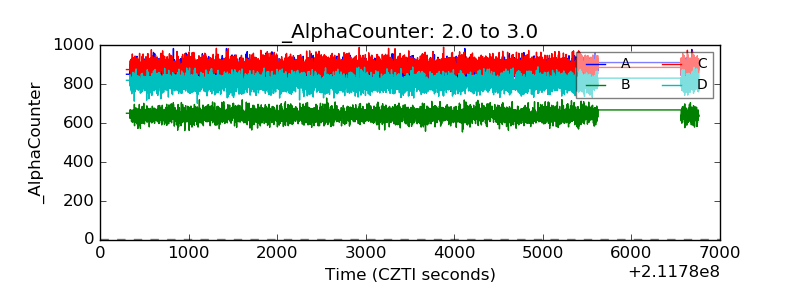 |
| _CPM_Rate | 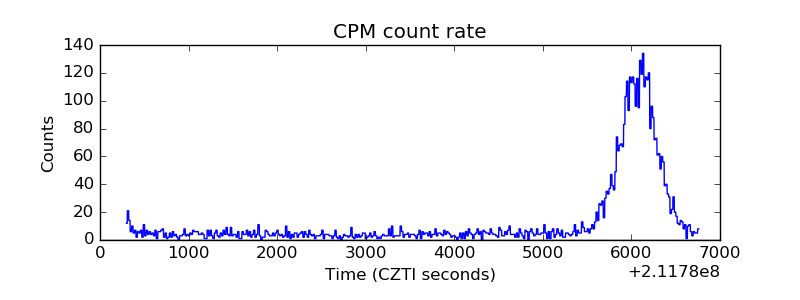 |
| CZT Counter | 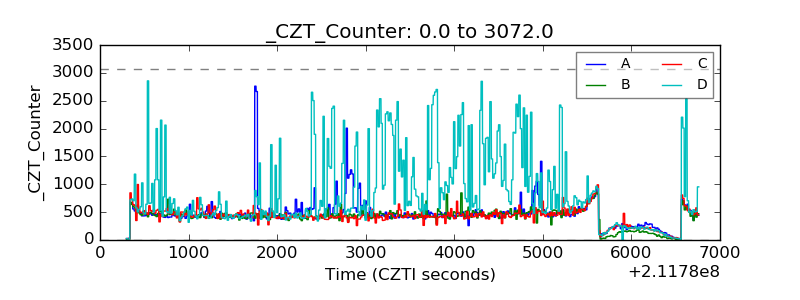 |
| +2.5 Volts monitor |  |
| +5 Volts monitor |  |
| _ROLL_ROT | 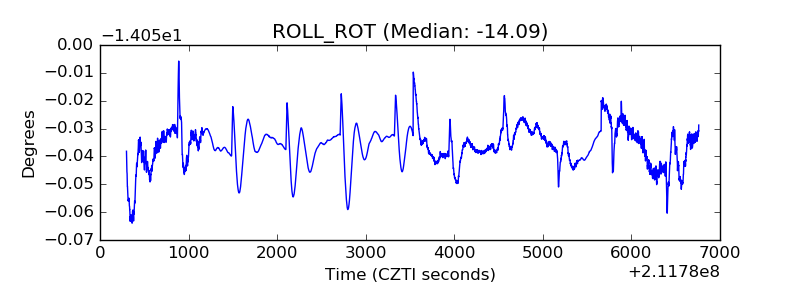 |
| _Roll_DEC | 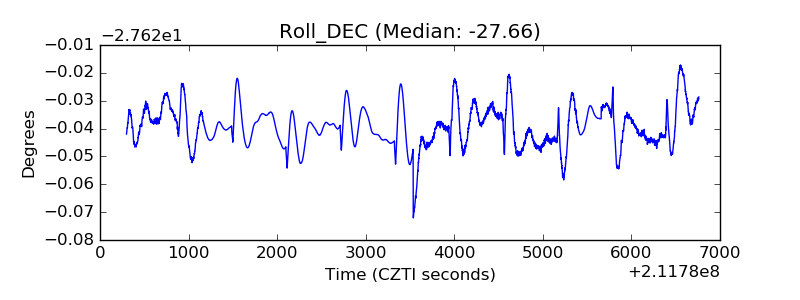 |
| _Roll_RA | 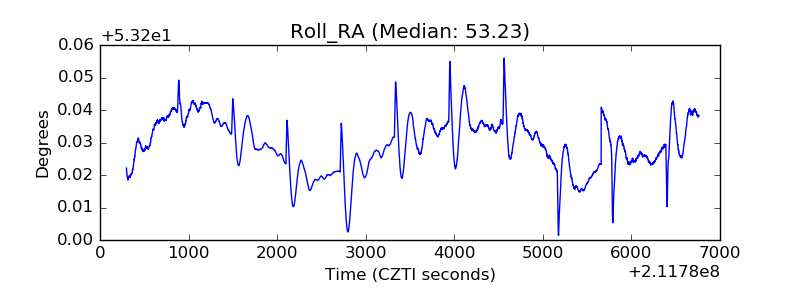 |
| Veto Counter | 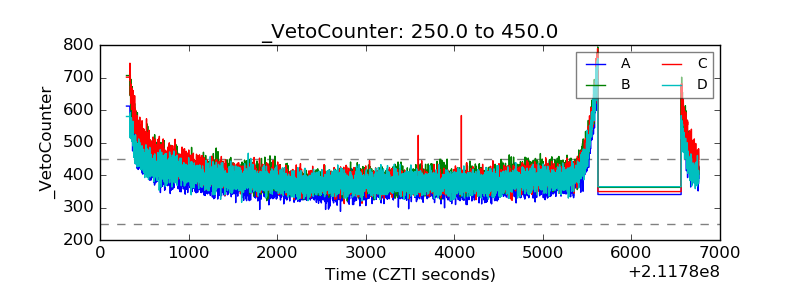 |