| Param | Original file | Final file |
|---|---|---|
| Filename | modeM0/AS1G05_240T02_9000000670_05262cztM0_level2.evt | modeM0/AS1G05_240T02_9000000670_05262cztM0_level2_quad_clean.evt |
| Size (bytes) | 26,245,440 | 4,276,800 |
| Size | 25.0 MB | 4.1 MB |
| Events in quadrant A | 184,274 | 24,968 |
| Events in quadrant B | 188,862 | 27,965 |
| Events in quadrant C | 184,208 | 26,278 |
| Events in quadrant D | 216,924 | 23,848 |
| Mode SS | |||
|---|---|---|---|
| Quadrant | BADHDUFLAG | Total packets | Discarded packets |
| A | 0 | 12 | 4 |
| B | 0 | 12 | 4 |
| C | 0 | 12 | 8 |
| D | 0 | 12 | 4 |
| Mode M9 | |||
|---|---|---|---|
| Quadrant | BADHDUFLAG | Total packets | Discarded packets |
| A | 0 | 1 | 0 |
| B | 0 | 1 | 0 |
| C | 0 | 1 | 0 |
| D | 0 | 1 | 0 |
| Mode M0 | |||
|---|---|---|---|
| Quadrant | BADHDUFLAG | Total packets | Discarded packets |
| A | 0 | 1423 | 728 |
| B | 0 | 1410 | 706 |
| C | 0 | 1475 | 773 |
| D | 0 | 1719 | 908 |
| Quadrant | Total seconds | Saturated seconds | Saturation percentage |
|---|---|---|---|
| A | 246 | 145 | 58.943089% |
| B | 256 | 152 | 59.375000% |
| C | 237 | 113 | 47.679325% |
| D | 242 | 140 | 57.851240% |
Noise dominated data is calculated using 1-second bins in cleaned event files. If a bin has >2000 counts, and if more than 50% of those come from <1% of pixels, then it is considered to be noise-dominated and hence unusable.
| Quadrant | # 1 sec bins | Bins with >0 counts | Bins with >2000 counts | High rate bins dominated by noise | Noise dominated (total time) | Noise dominated (detector-on time) | Marked lightcurve |
|---|---|---|---|---|---|---|---|
| A | 606 | 327 | 0 | 0 | 0.00% | 0.00% | 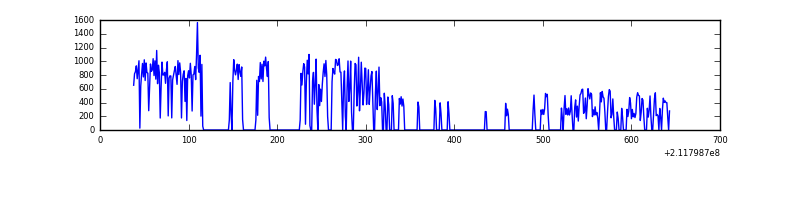 |
| B | 603 | 339 | 0 | 0 | 0.00% | 0.00% | 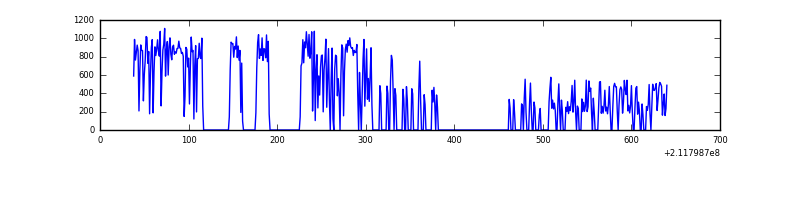 |
| C | 601 | 315 | 0 | 0 | 0.00% | 0.00% | 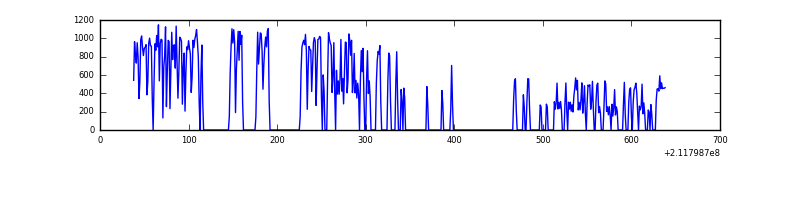 |
| D | 606 | 322 | 3 | 3 | 0.50% | 0.93% | 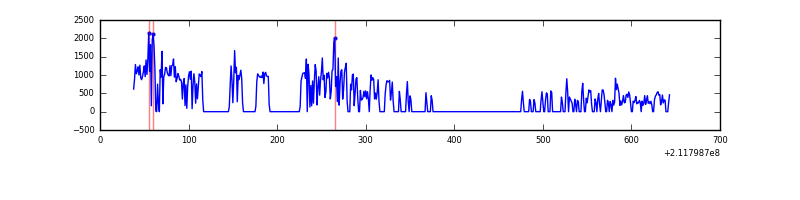 |
Top three noisy pixels from each quadrant. If the there are fewer than three noisy pixels in the level2.evt file, extra rows are filled as -1
| Pixel properties | Quadrant properties | ||||||
|---|---|---|---|---|---|---|---|
| Quadrant | DetID | PixID | Counts | Sigma | Mean | Median | Sigma |
| A | 13 | 251 | 4700 | 365.55 | 46 | 45 | 12.7 |
| A | 12 | 194 | 503 | 35.97 | 46 | 45 | 12.7 |
| A | 0 | 226 | 410 | 28.66 | 46 | 45 | 12.7 |
| B | 12 | 111 | 1133 | 83.19 | 48 | 46 | 13.1 |
| B | 11 | 111 | 921 | 66.97 | 48 | 46 | 13.1 |
| B | 14 | 111 | 595 | 42.02 | 48 | 46 | 13.1 |
| C | 7 | 159 | 1352 | 95.42 | 46 | 45 | 13.7 |
| C | 8 | 128 | 775 | 53.29 | 46 | 45 | 13.7 |
| C | 1 | 16 | 676 | 46.07 | 46 | 45 | 13.7 |
| D | 11 | 145 | 36213 | 2587.79 | 46 | 44 | 14.0 |
| D | 8 | 195 | 4913 | 348.36 | 46 | 44 | 14.0 |
| D | 13 | 53 | 1587 | 110.4 | 46 | 44 | 14.0 |
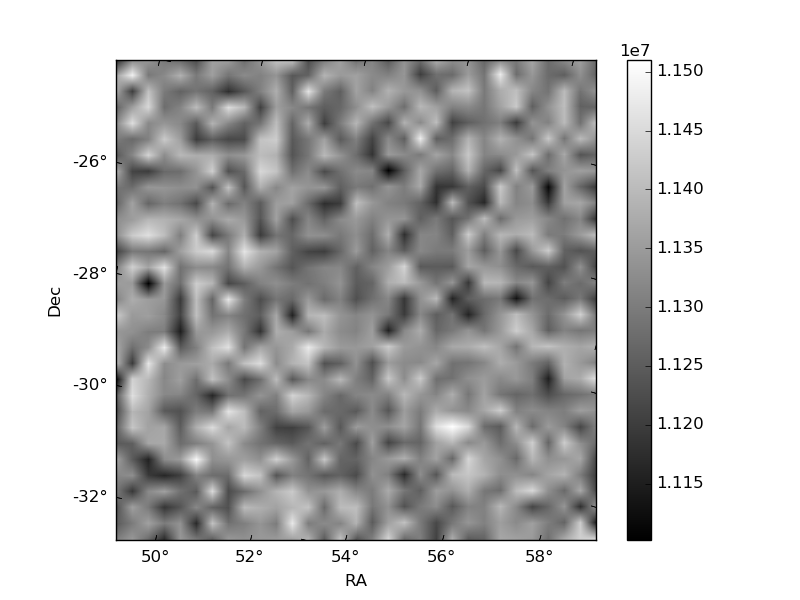
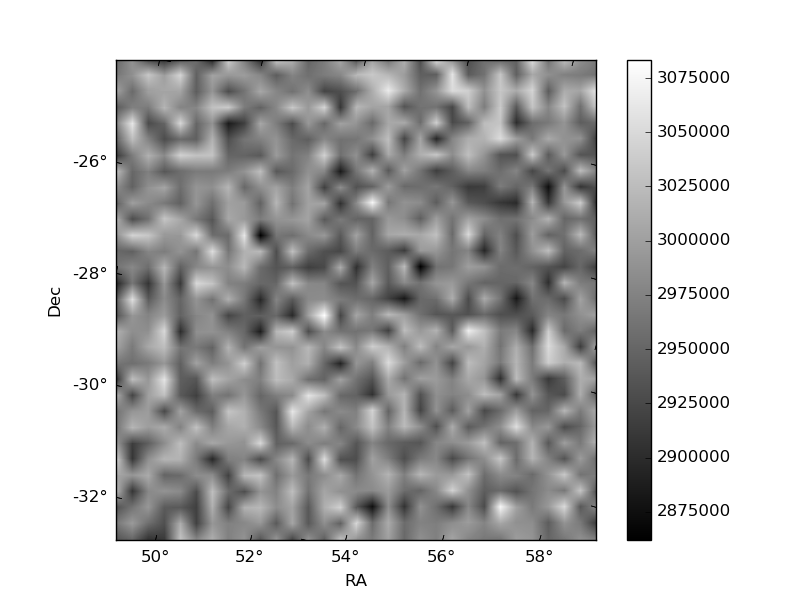
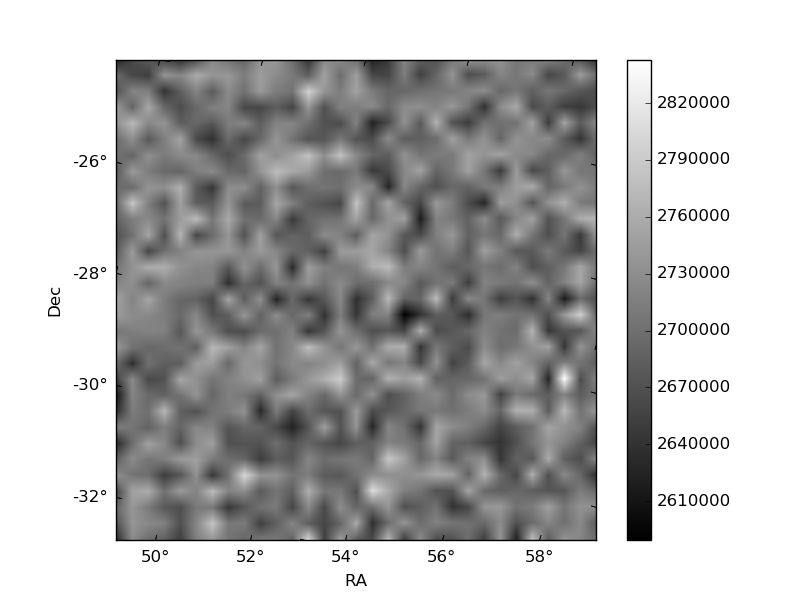
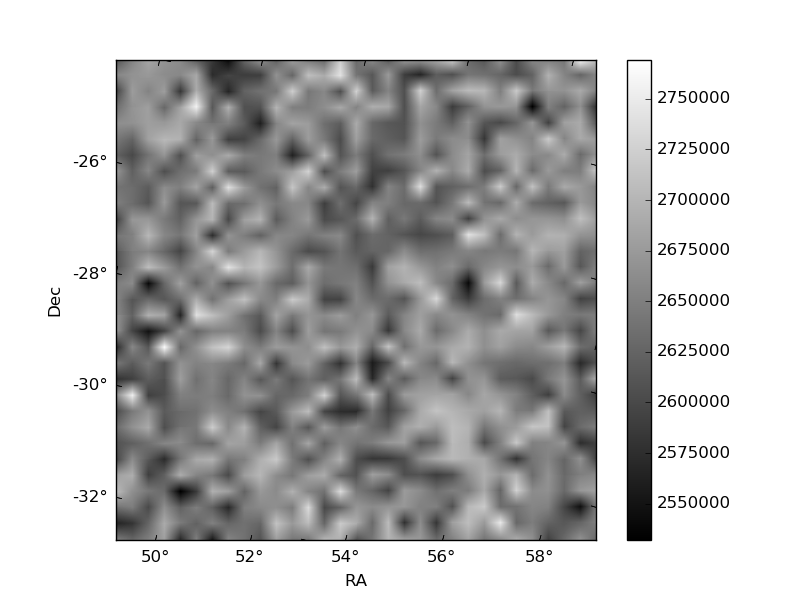
Histogram calculated using DETX and DETY for each event in the final _common_clean file
| Quadrant A | 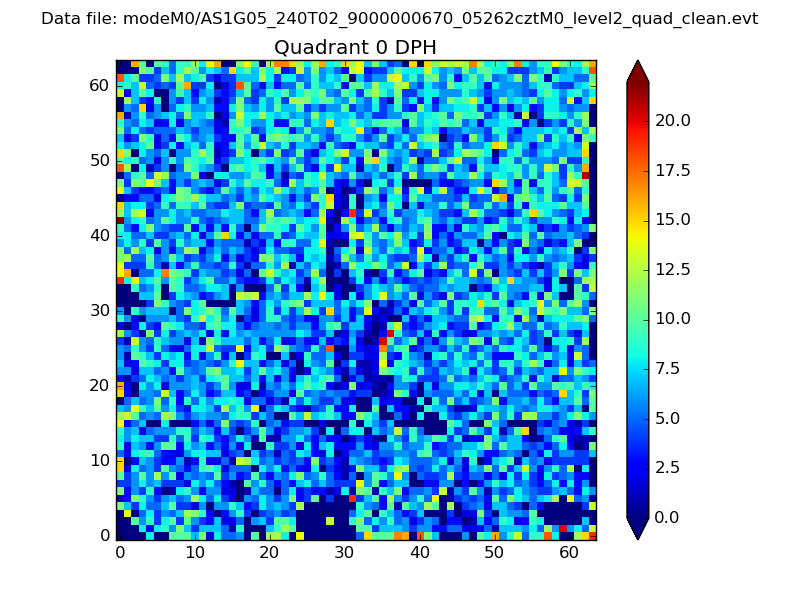 |
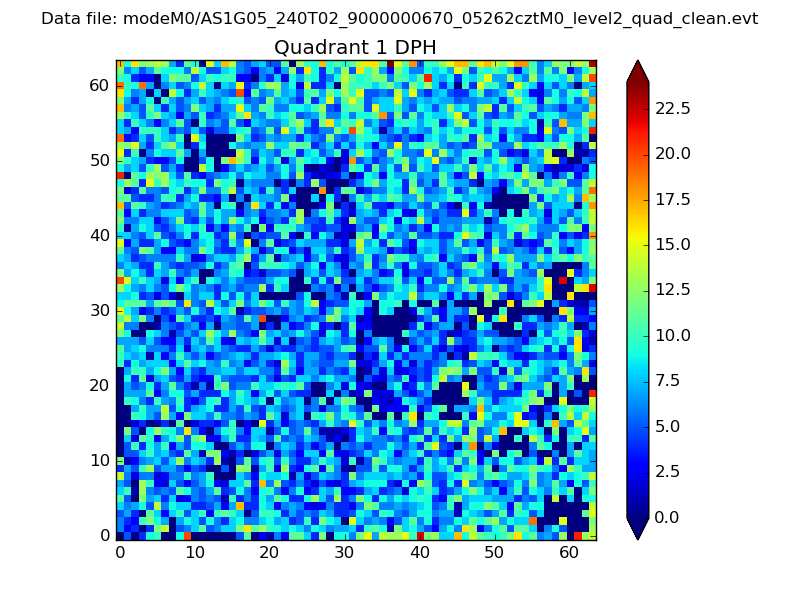 |
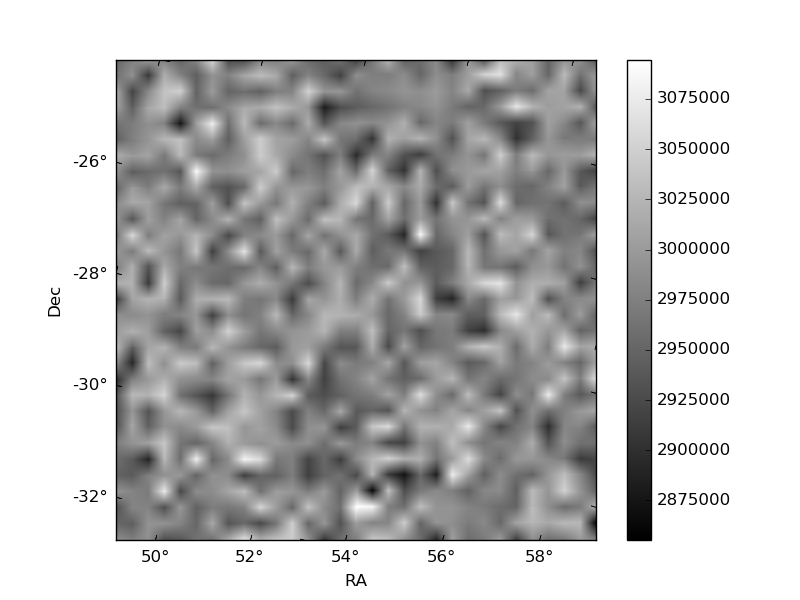
Quadrant B |
|---|---|---|---|
| Quadrant D | 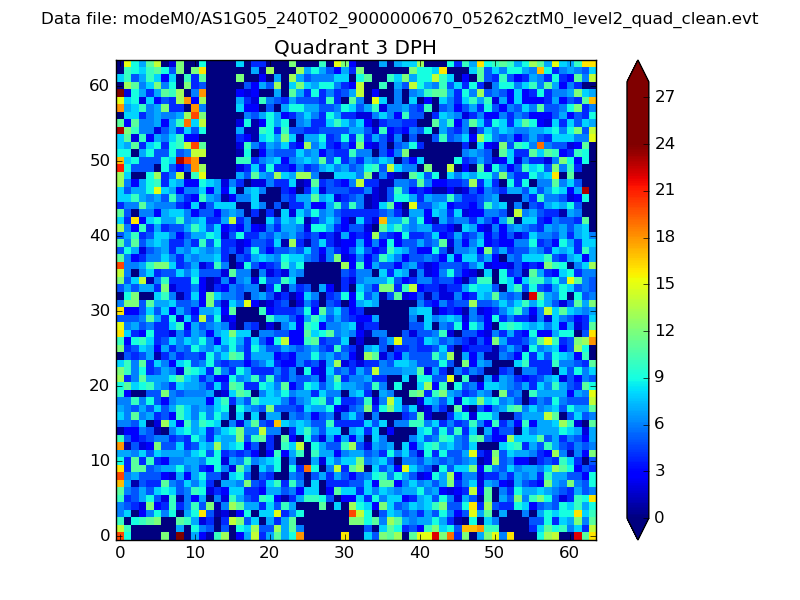 |
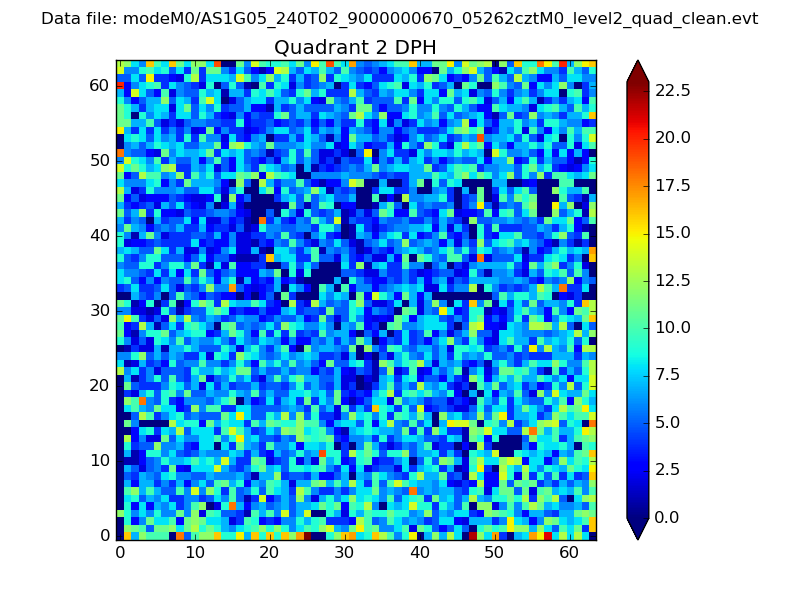 |
Quadrant C |
| Plot type | Count rate plots | Images |
|---|---|---|
| Comparison with Poisson distribution Blue bars denote a histogram of data divided into 1 sec bins. Red curve is a Poisson curve with rate = median count rate of data. |
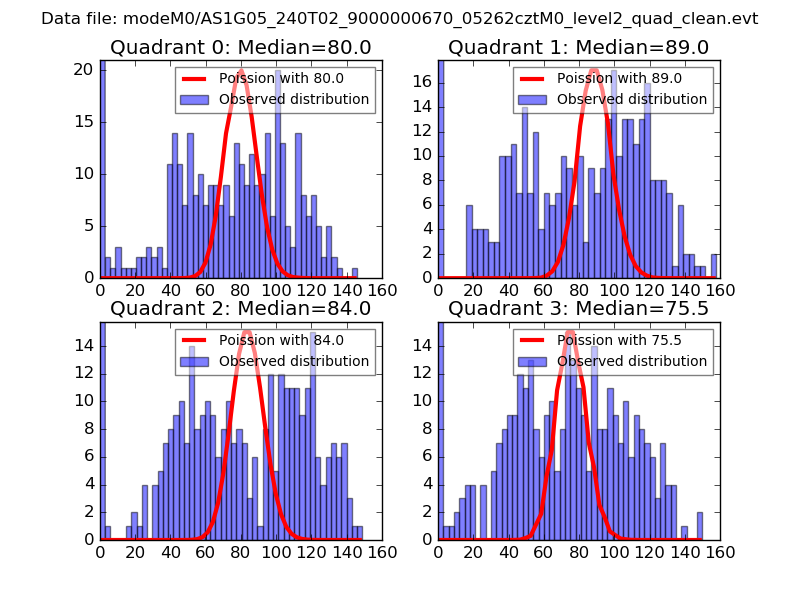 |
 |
| Quadrant-wise count rates Data is divided into 100 sec bins |
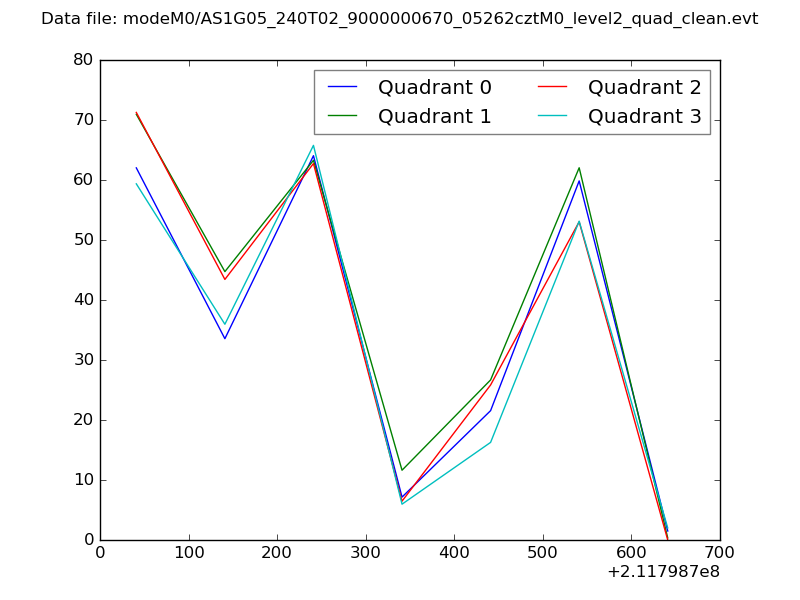 |
|
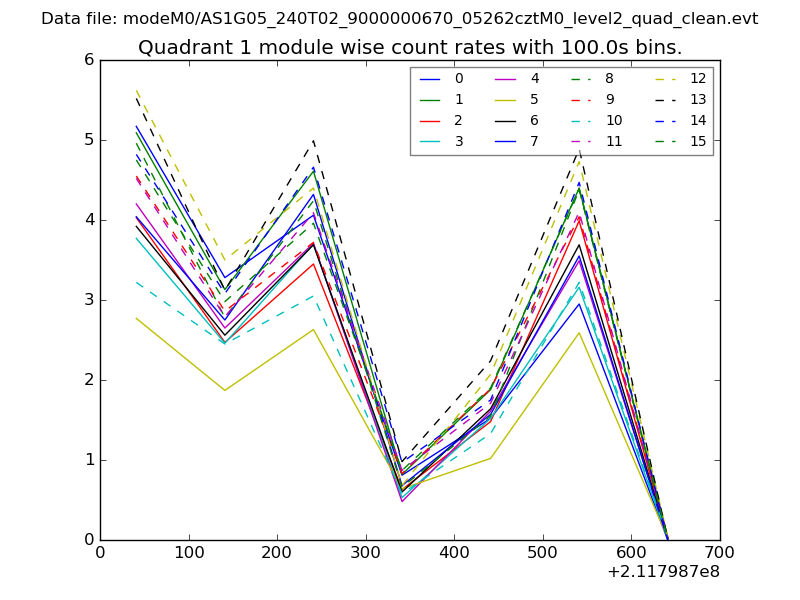
| Module-wise count rates for Quadrant A Data is divided into 100 sec bins |
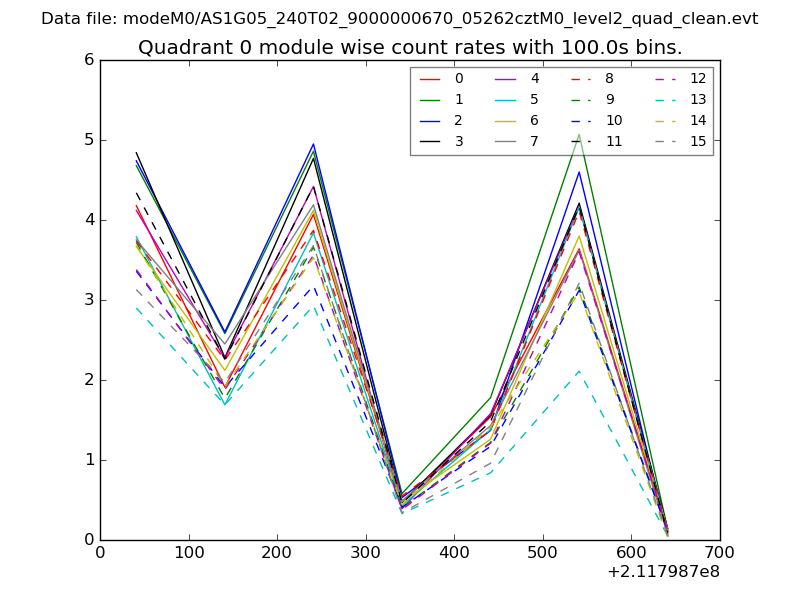 |
 |
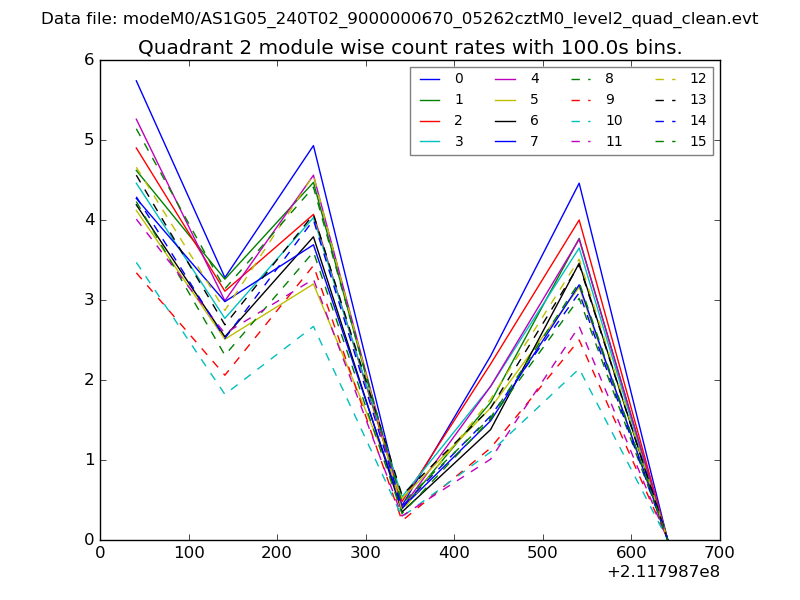
| Module-wise count rates for Quadrant B Data is divided into 100 sec bins |
 |
 |
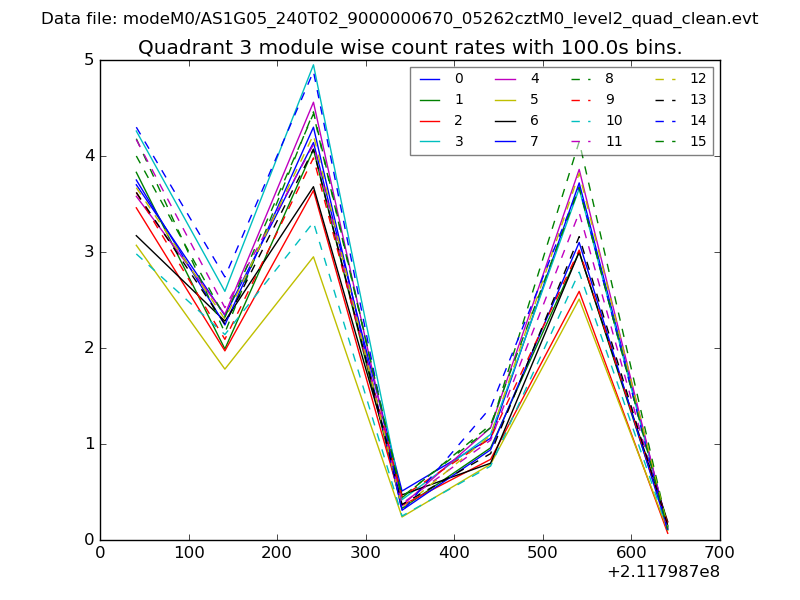
| Module-wise count rates for Quadrant C Data is divided into 100 sec bins |
 |
 |
| Module-wise count rates for Quadrant D Data is divided into 100 sec bins |
 |
 |
| Parameter | Plot |
|---|---|
| CZT HV Monitor | 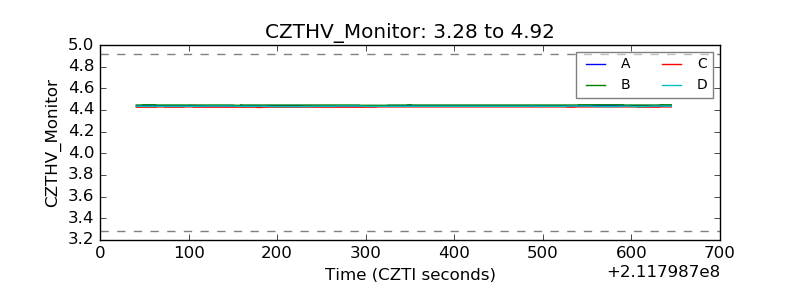 |
| D_VDD | 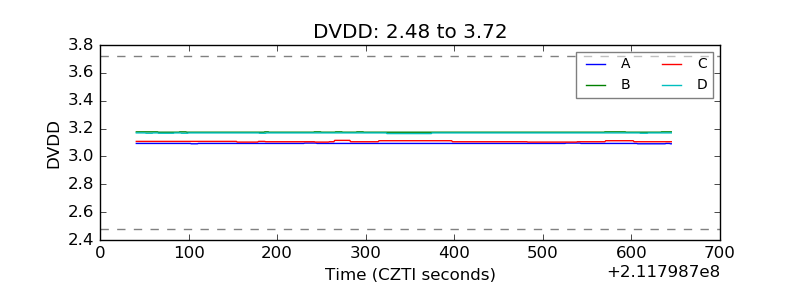 |
| Temperature 1 | 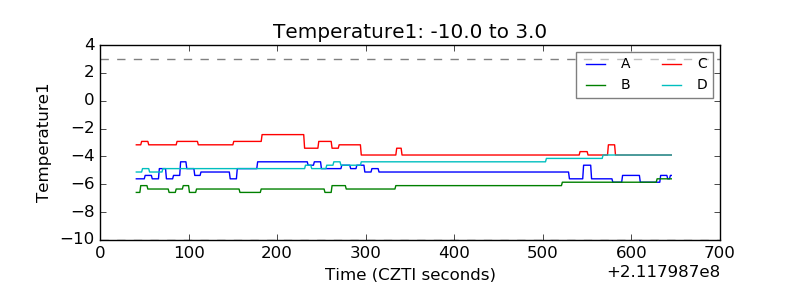 |
| Veto HV Monitor | 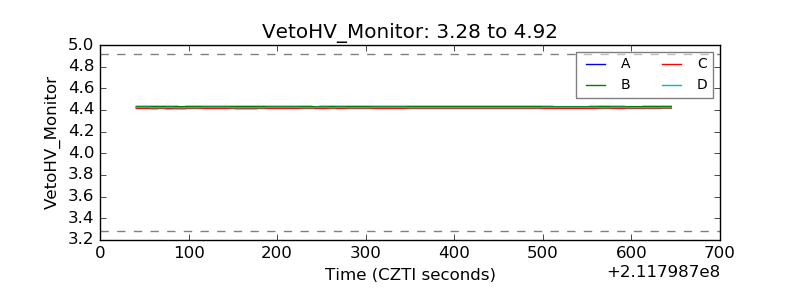 |
| Veto LLD | 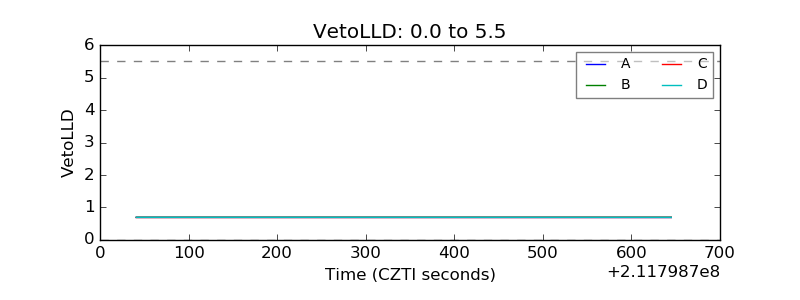 |
| Alpha Counter | 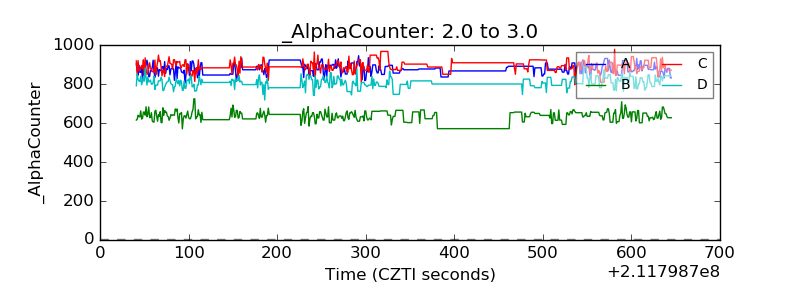 |
| _CPM_Rate | 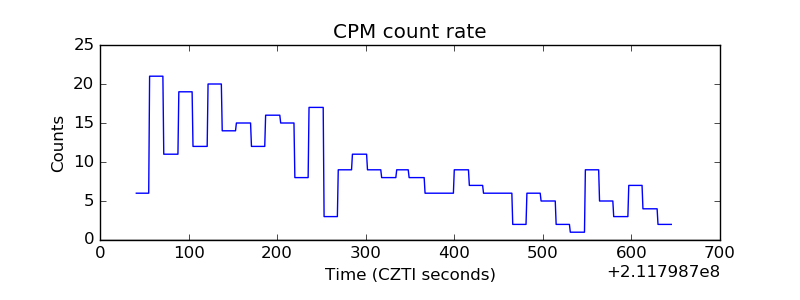 |
| CZT Counter | 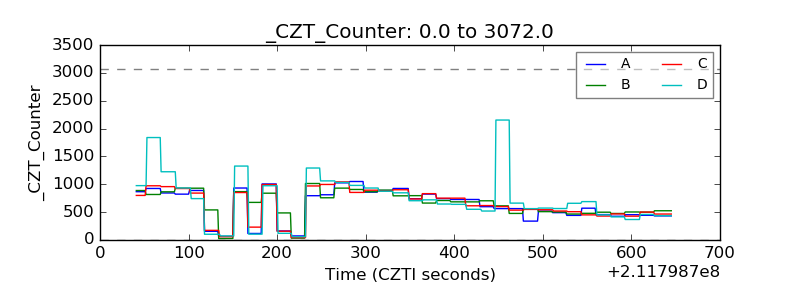 |
| +2.5 Volts monitor | 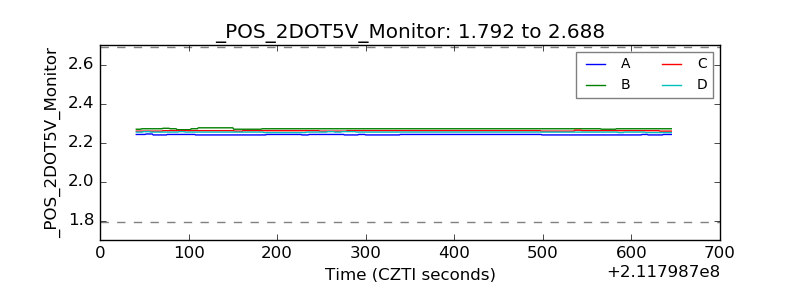 |
| +5 Volts monitor | 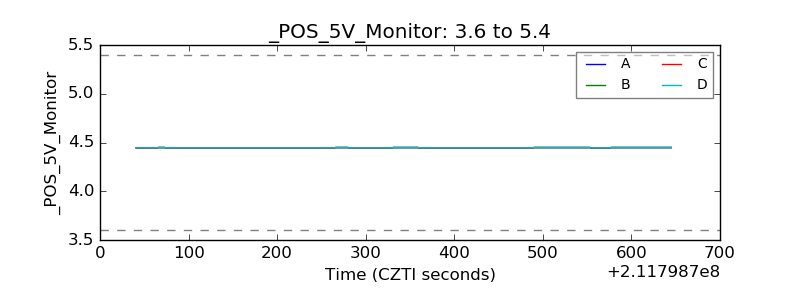 |
| _ROLL_ROT | 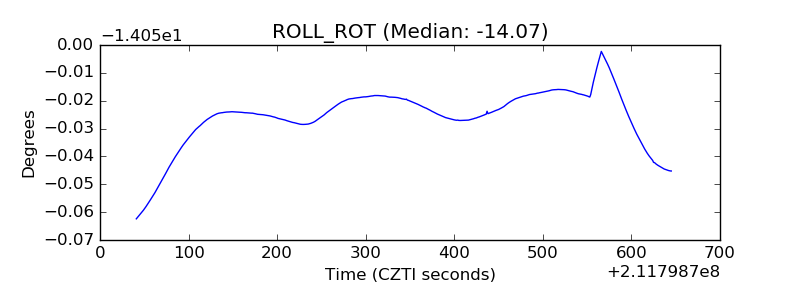 |
| _Roll_DEC | 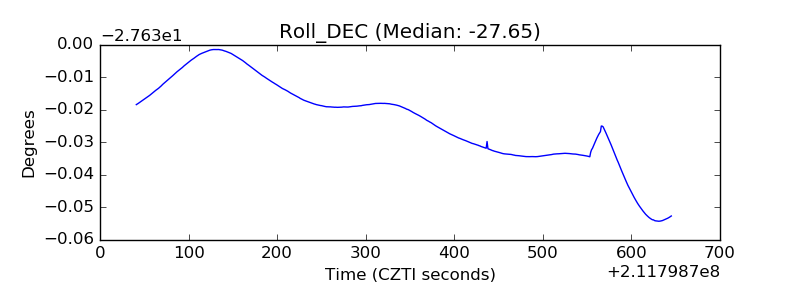 |
| _Roll_RA | 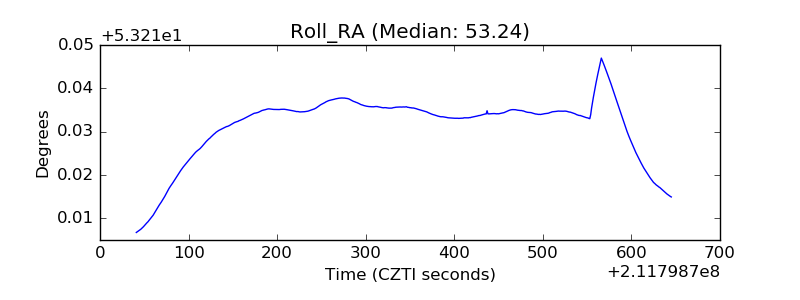 |
| Veto Counter | 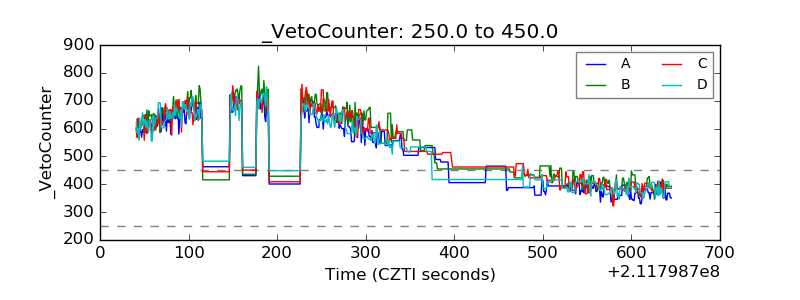 |