| Param | Original file | Final file |
|---|---|---|
| Filename | modeM0/AS1G05_240T02_9000000670_05263cztM0_level2.evt | modeM0/AS1G05_240T02_9000000670_05263cztM0_level2_quad_clean.evt |
| Size (bytes) | 2,515,590,720 | 320,575,680 |
| Size | 2.3 GB | 305.7 MB |
| Events in quadrant A | 14,928,869 | 1,984,769 |
| Events in quadrant B | 14,334,412 | 1,986,706 |
| Events in quadrant C | 13,842,357 | 1,948,402 |
| Events in quadrant D | 31,048,469 | 1,718,304 |
| Mode SS | |||
|---|---|---|---|
| Quadrant | BADHDUFLAG | Total packets | Discarded packets |
| A | 0 | 616 | 0 |
| B | 0 | 616 | 0 |
| C | 0 | 616 | 2 |
| D | 0 | 616 | 4 |
| Mode M9 | |||
|---|---|---|---|
| Quadrant | BADHDUFLAG | Total packets | Discarded packets |
| A | 0 | 31 | 0 |
| B | 0 | 31 | 0 |
| C | 0 | 31 | 0 |
| D | 0 | 31 | 2 |
| Mode M0 | |||
|---|---|---|---|
| Quadrant | BADHDUFLAG | Total packets | Discarded packets |
| A | 0 | 65600 | 130 |
| B | 0 | 63220 | 171 |
| C | 0 | 62472 | 155 |
| D | 0 | 113758 | 690 |
| Quadrant | Total seconds | Saturated seconds | Saturation percentage |
|---|---|---|---|
| A | 30129 | 798 | 2.648611% |
| B | 30109 | 580 | 1.926334% |
| C | 30115 | 415 | 1.378051% |
| D | 30048 | 5993 | 19.944755% |
Noise dominated data is calculated using 1-second bins in cleaned event files. If a bin has >2000 counts, and if more than 50% of those come from <1% of pixels, then it is considered to be noise-dominated and hence unusable.
| Quadrant | # 1 sec bins | Bins with >0 counts | Bins with >2000 counts | High rate bins dominated by noise | Noise dominated (total time) | Noise dominated (detector-on time) | Marked lightcurve |
|---|---|---|---|---|---|---|---|
| A | 33283 | 30194 | 170 | 170 | 0.51% | 0.56% | 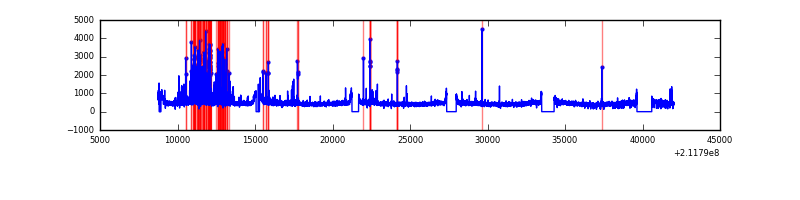 |
| B | 33283 | 30195 | 6 | 6 | 0.02% | 0.02% | 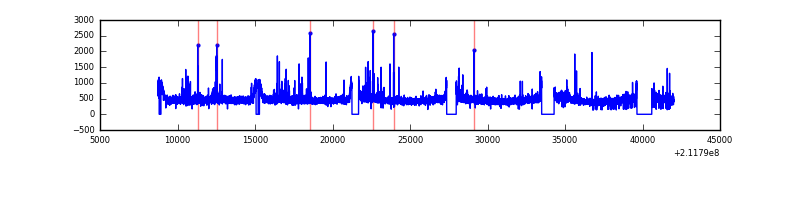 |
| C | 33283 | 30193 | 1 | 1 | 0.00% | 0.00% | 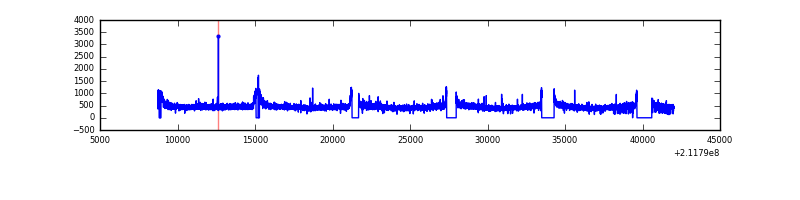 |
| D | 33282 | 30168 | 4430 | 4430 | 13.31% | 14.68% | 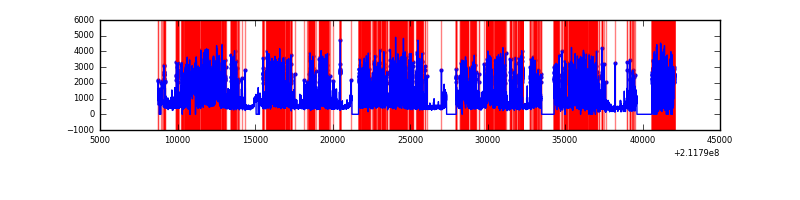 |
Top three noisy pixels from each quadrant. If the there are fewer than three noisy pixels in the level2.evt file, extra rows are filled as -1
| Pixel properties | Quadrant properties | ||||||
|---|---|---|---|---|---|---|---|
| Quadrant | DetID | PixID | Counts | Sigma | Mean | Median | Sigma |
| A | 13 | 251 | 1116325 | 1563.8 | 3498 | 3415 | 711.7 |
| A | 0 | 50 | 318656 | 442.96 | 3498 | 3415 | 711.7 |
| A | 12 | 194 | 34577 | 43.79 | 3498 | 3415 | 711.7 |
| B | 15 | 54 | 141918 | 203.71 | 3542 | 3461 | 679.7 |
| B | 4 | 48 | 139027 | 199.46 | 3542 | 3461 | 679.7 |
| B | 15 | 204 | 130965 | 187.6 | 3542 | 3461 | 679.7 |
| C | 1 | 16 | 403843 | 504.69 | 3420 | 3435 | 793.4 |
| C | 13 | 61 | 27678 | 30.56 | 3420 | 3435 | 793.4 |
| C | 7 | 159 | 27094 | 29.82 | 3420 | 3435 | 793.4 |
| D | 11 | 145 | 15481640 | 20000.79 | 3117 | 3020 | 773.9 |
| D | 2 | 136 | 1566906 | 2020.78 | 3117 | 3020 | 773.9 |
| D | 1 | 31 | 947345 | 1220.22 | 3117 | 3020 | 773.9 |
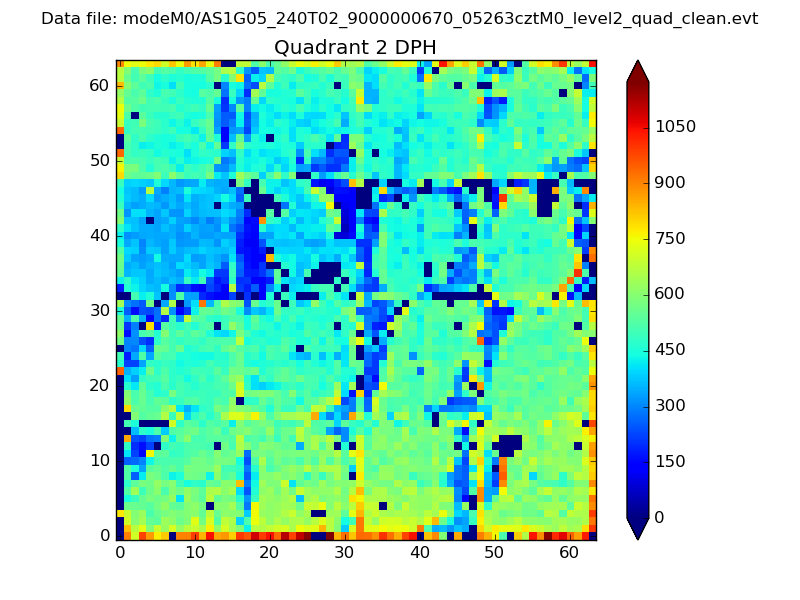
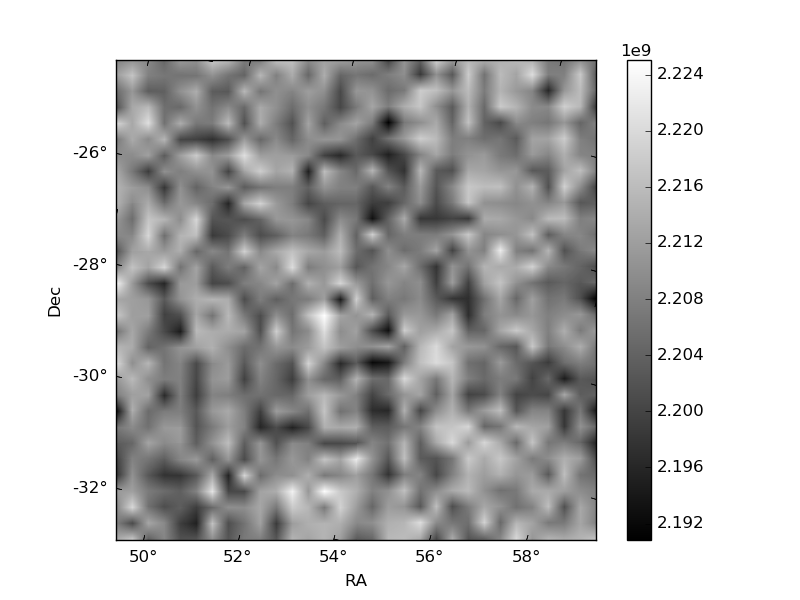
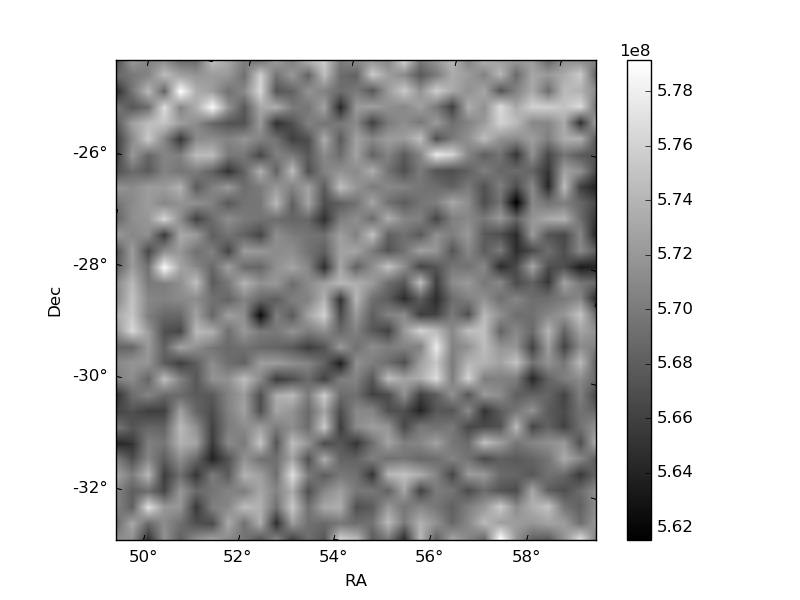
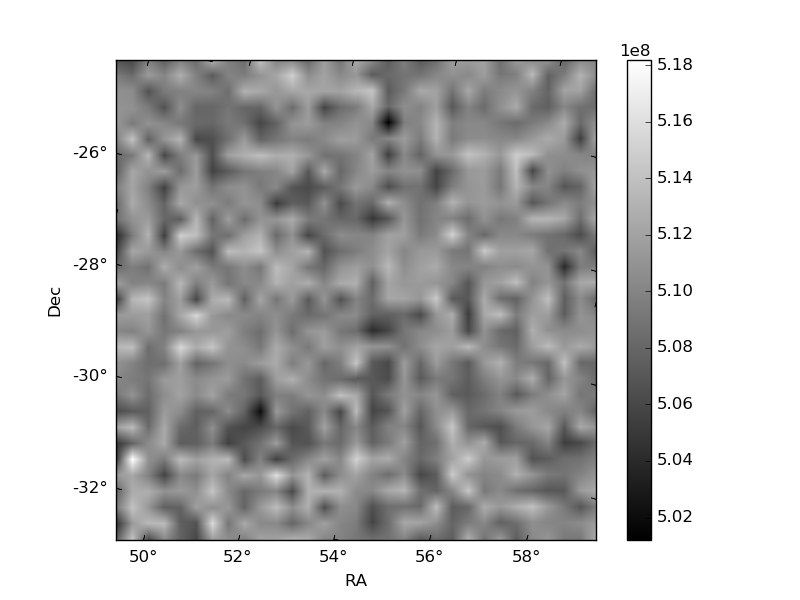
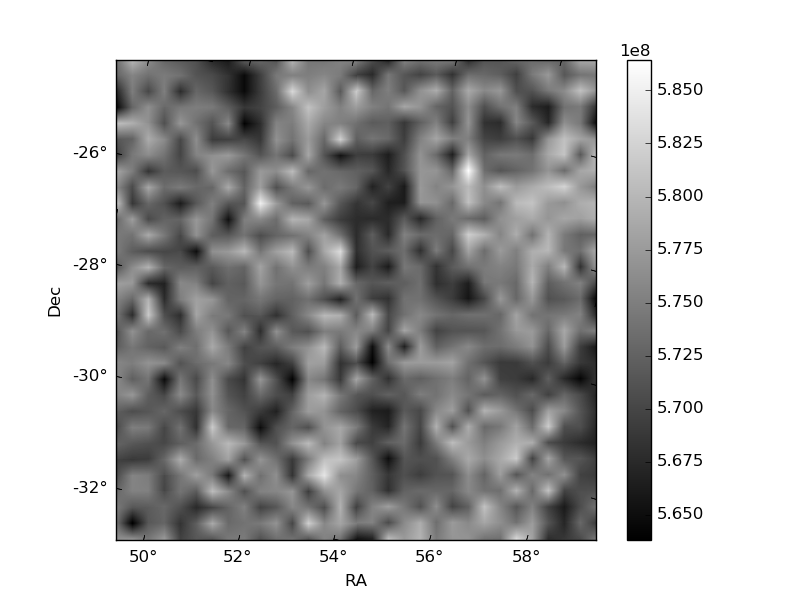
Histogram calculated using DETX and DETY for each event in the final _common_clean file
| Quadrant A | 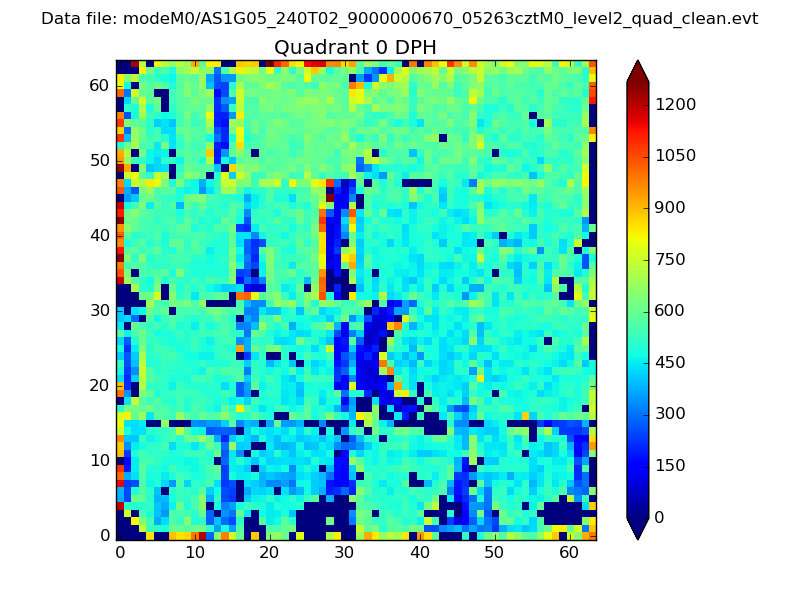 |
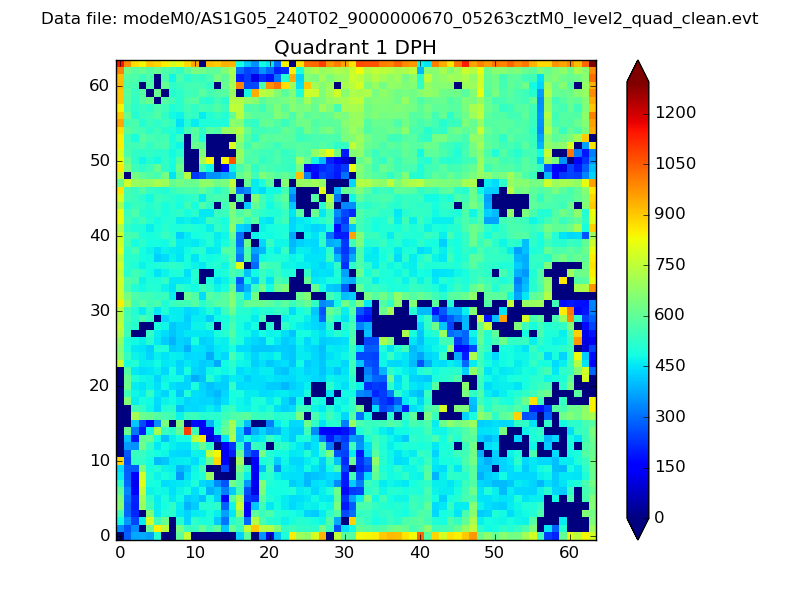 |
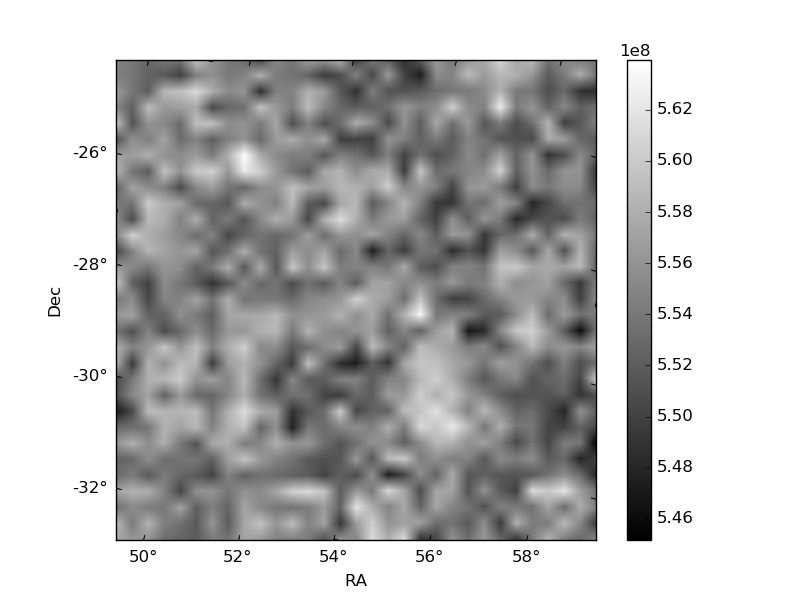
Quadrant B |
|---|---|---|---|
| Quadrant D | 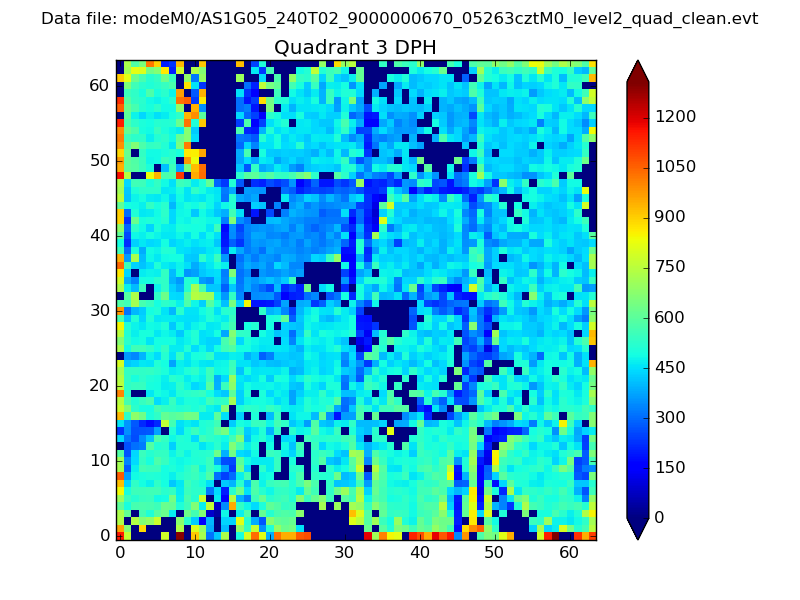 |
 |
Quadrant C |
| Plot type | Count rate plots | Images |
|---|---|---|
| Comparison with Poisson distribution Blue bars denote a histogram of data divided into 1 sec bins. Red curve is a Poisson curve with rate = median count rate of data. |
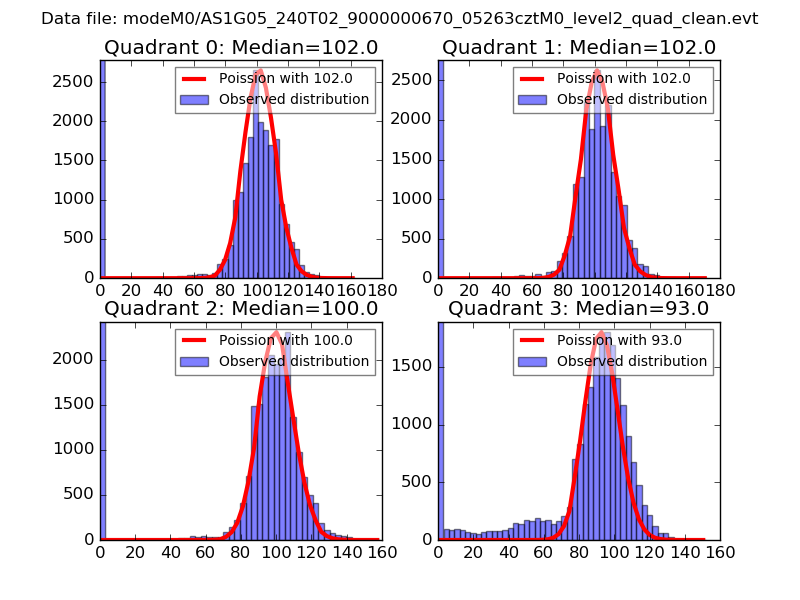 |
 |
| Quadrant-wise count rates Data is divided into 100 sec bins |
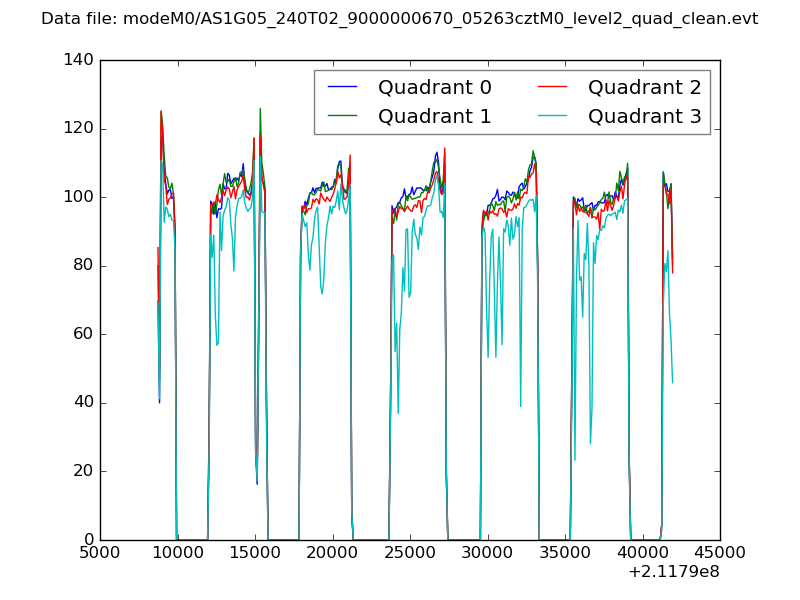 |
|
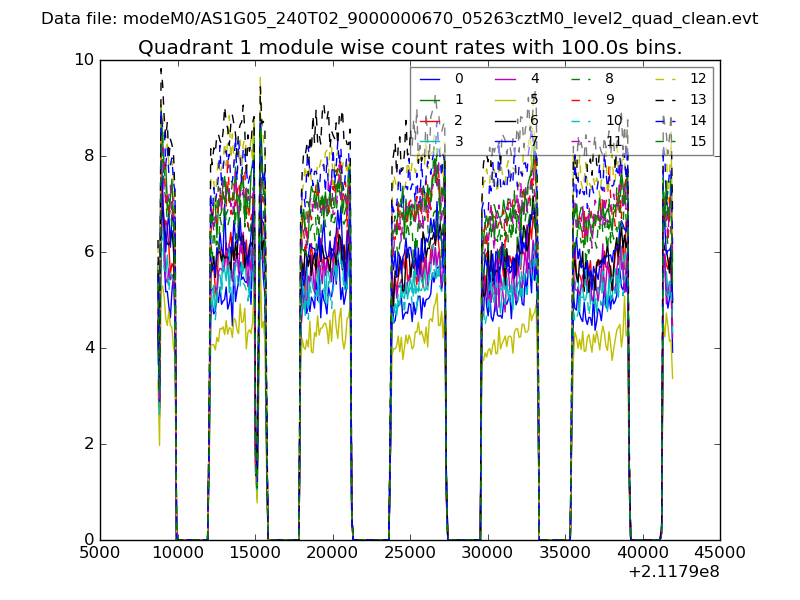
| Module-wise count rates for Quadrant A Data is divided into 100 sec bins |
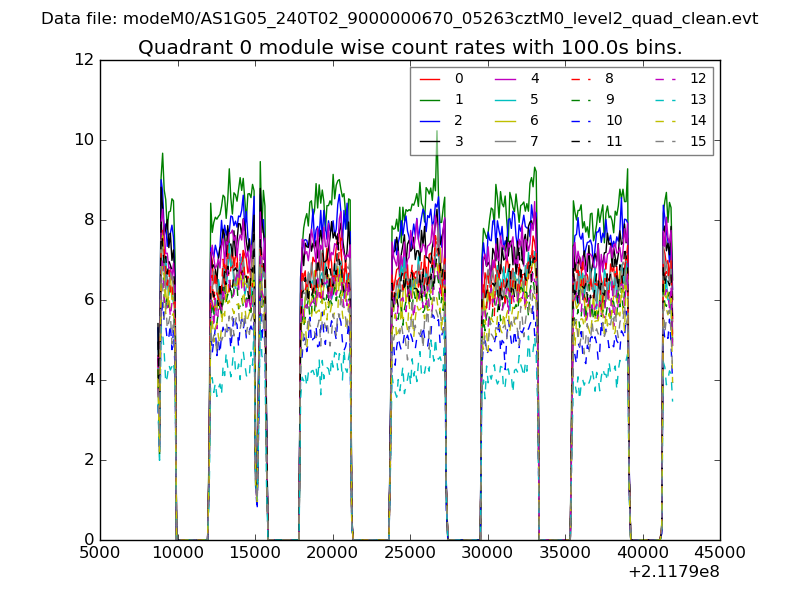 |
 |
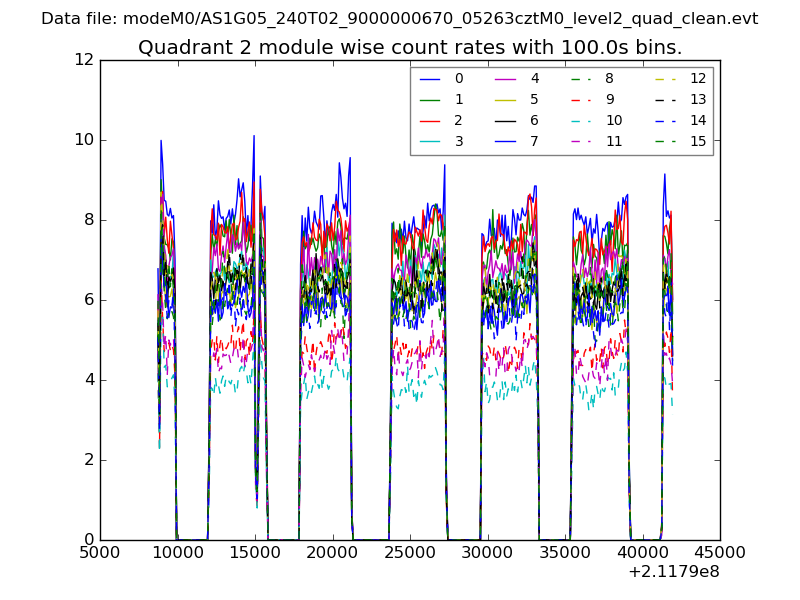
| Module-wise count rates for Quadrant B Data is divided into 100 sec bins |
 |
 |
| Module-wise count rates for Quadrant C Data is divided into 100 sec bins |
 |
 |
| Module-wise count rates for Quadrant D Data is divided into 100 sec bins |
 |
 |
| Parameter | Plot |
|---|---|
| CZT HV Monitor | 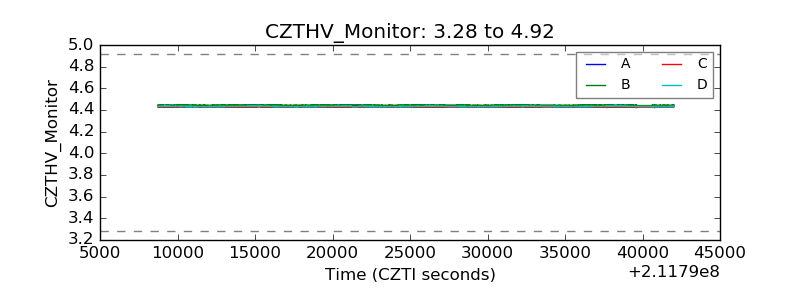 |
| D_VDD | 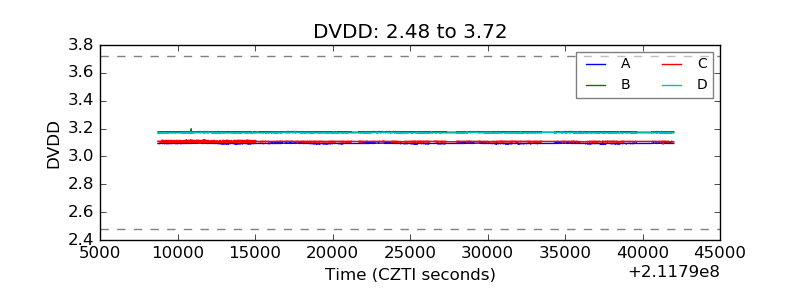 |
| Temperature 1 | 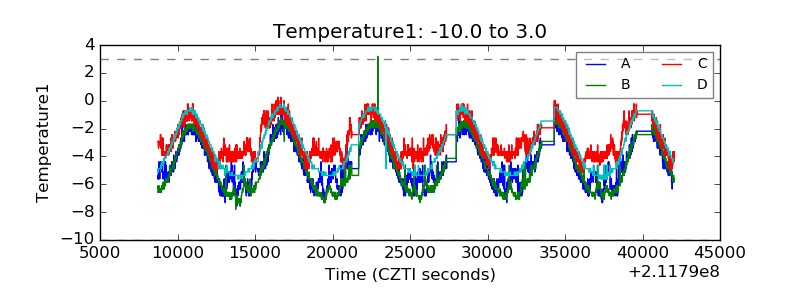 |
| Veto HV Monitor | 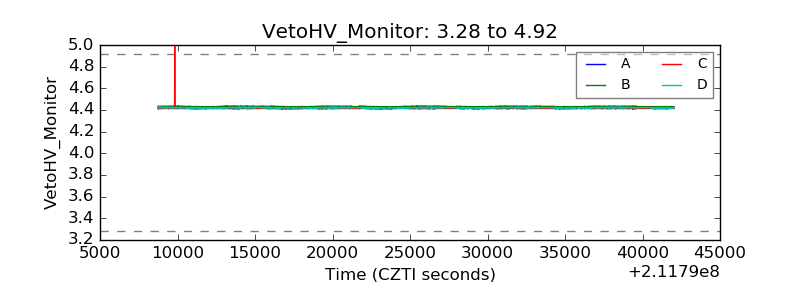 |
| Veto LLD | 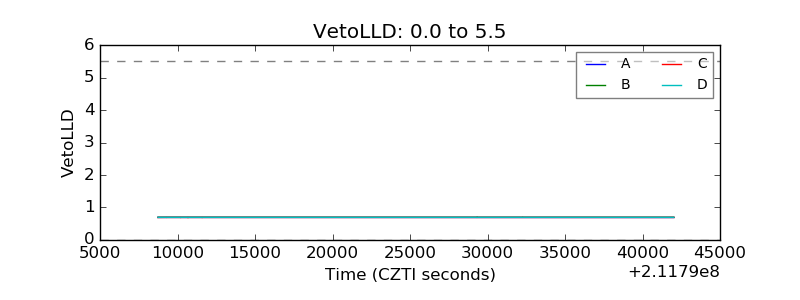 |
| Alpha Counter | 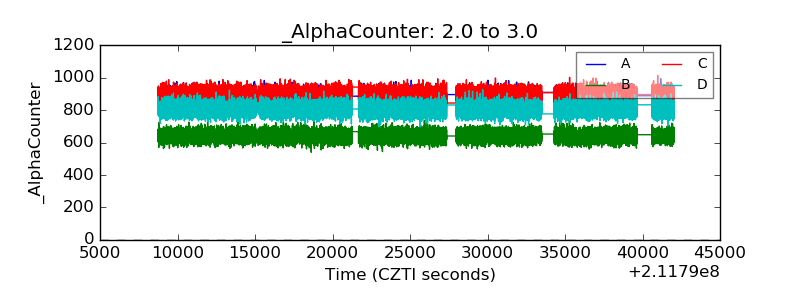 |
| _CPM_Rate | 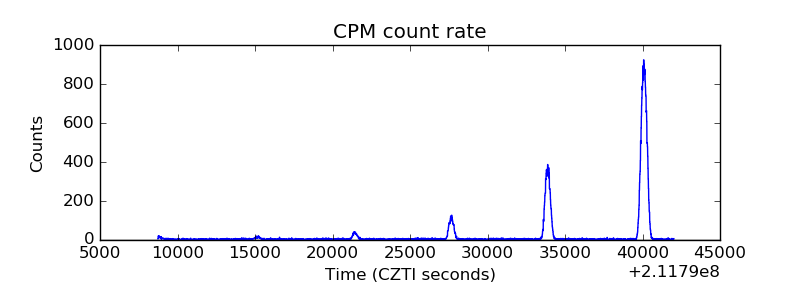 |
| CZT Counter | 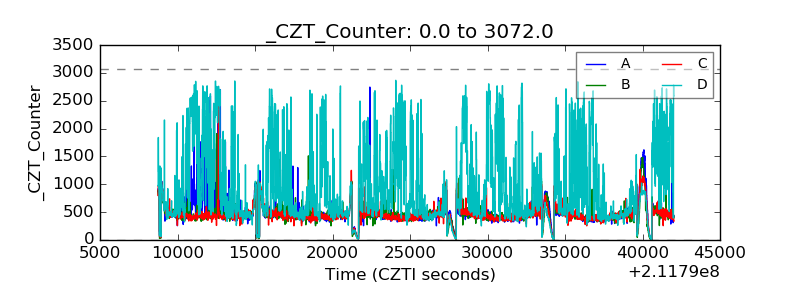 |
| +2.5 Volts monitor | 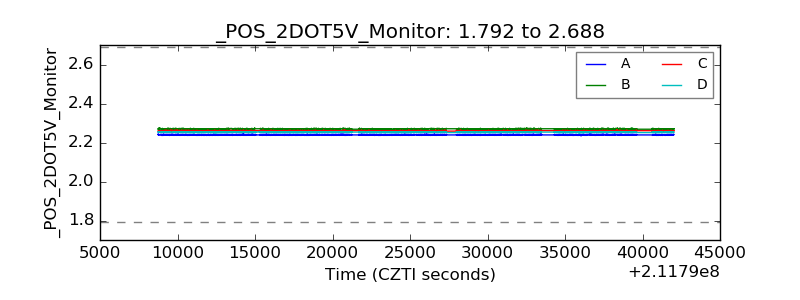 |
| +5 Volts monitor | 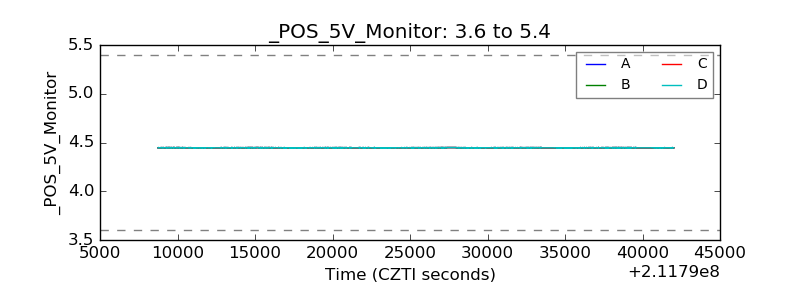 |
| _ROLL_ROT | 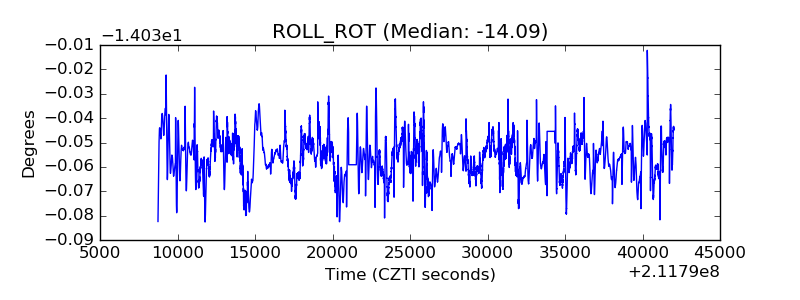 |
| _Roll_DEC |  |
| _Roll_RA |  |
| Veto Counter | 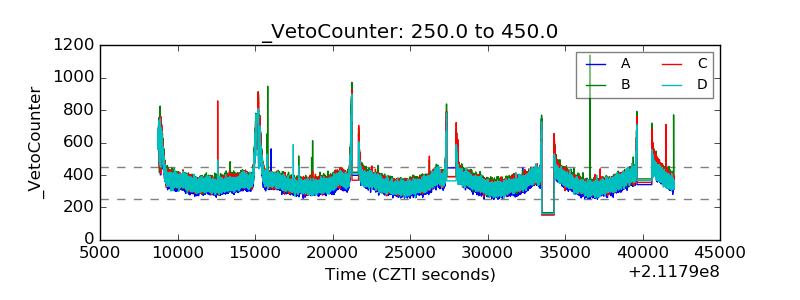 |