| Param | Original file | Final file |
|---|---|---|
| Filename | modeM0/AS1G05_240T02_9000000670_05267cztM0_level2.evt | modeM0/AS1G05_240T02_9000000670_05267cztM0_level2_quad_clean.evt |
| Size (bytes) | 39,107,520 | 8,951,040 |
| Size | 37.3 MB | 8.5 MB |
| Events in quadrant A | 303,344 | 57,172 |
| Events in quadrant B | 235,196 | 60,787 |
| Events in quadrant C | 229,821 | 58,770 |
| Events in quadrant D | 378,669 | 50,907 |
| Mode SS | |||
|---|---|---|---|
| Quadrant | BADHDUFLAG | Total packets | Discarded packets |
| A | 0 | 18 | 8 |
| B | 0 | 19 | 9 |
| C | 0 | 19 | 9 |
| D | 0 | 16 | 4 |
| Mode M9 | |||
|---|---|---|---|
| Quadrant | BADHDUFLAG | Total packets | Discarded packets |
| A | 0 | 7 | 2 |
| B | 0 | 7 | 2 |
| C | 0 | 7 | 2 |
| D | 0 | 8 | 4 |
| Mode M0 | |||
|---|---|---|---|
| Quadrant | BADHDUFLAG | Total packets | Discarded packets |
| A | 0 | 2084 | 863 |
| B | 0 | 1697 | 671 |
| C | 0 | 1686 | 673 |
| D | 0 | 2636 | 1180 |
| Quadrant | Total seconds | Saturated seconds | Saturation percentage |
|---|---|---|---|
| A | 493 | 6 | 1.217039% |
| B | 507 | 0 | 0.000000% |
| C | 506 | 0 | 0.000000% |
| D | 486 | 45 | 9.259259% |
Noise dominated data is calculated using 1-second bins in cleaned event files. If a bin has >2000 counts, and if more than 50% of those come from <1% of pixels, then it is considered to be noise-dominated and hence unusable.
| Quadrant | # 1 sec bins | Bins with >0 counts | Bins with >2000 counts | High rate bins dominated by noise | Noise dominated (total time) | Noise dominated (detector-on time) | Marked lightcurve |
|---|---|---|---|---|---|---|---|
| A | 558 | 519 | 7 | 7 | 1.25% | 1.35% | 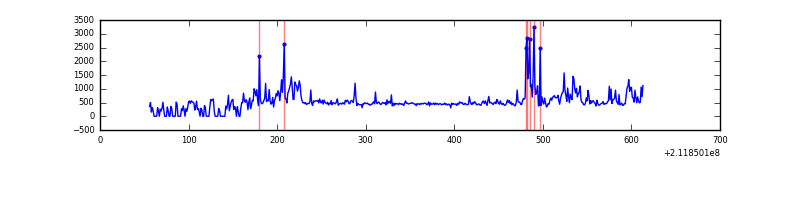 |
| B | 569 | 538 | 0 | 0 | 0.00% | 0.00% | 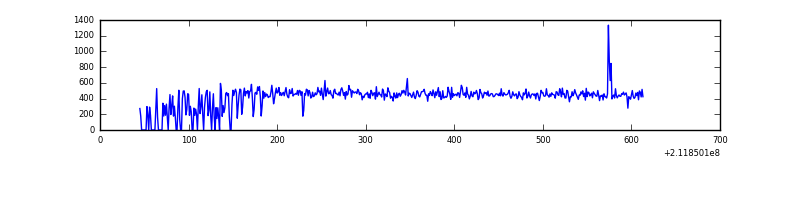 |
| C | 582 | 535 | 0 | 0 | 0.00% | 0.00% | 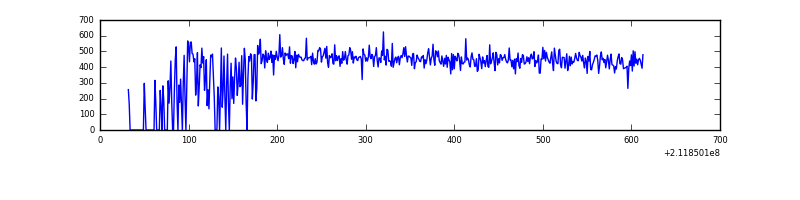 |
| D | 556 | 511 | 35 | 35 | 6.29% | 6.85% | 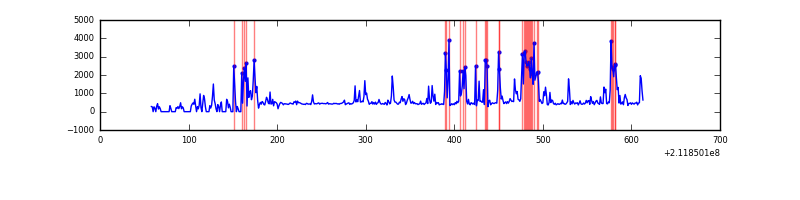 |
Top three noisy pixels from each quadrant. If the there are fewer than three noisy pixels in the level2.evt file, extra rows are filled as -1
| Pixel properties | Quadrant properties | ||||||
|---|---|---|---|---|---|---|---|
| Quadrant | DetID | PixID | Counts | Sigma | Mean | Median | Sigma |
| A | 13 | 251 | 87020 | 6426.22 | 55 | 54 | 13.5 |
| A | 0 | 50 | 1397 | 99.24 | 55 | 54 | 13.5 |
| A | 0 | 226 | 499 | 32.88 | 55 | 54 | 13.5 |
| B | 15 | 54 | 2005 | 145.21 | 59 | 57 | 13.4 |
| B | 0 | 219 | 1524 | 109.36 | 59 | 57 | 13.4 |
| B | 12 | 111 | 1085 | 76.63 | 59 | 57 | 13.4 |
| C | 1 | 16 | 1629 | 101.51 | 58 | 58 | 15.5 |
| C | 15 | 1 | 550 | 31.79 | 58 | 58 | 15.5 |
| C | 13 | 61 | 463 | 26.17 | 58 | 58 | 15.5 |
| D | 11 | 145 | 176238 | 12178.08 | 51 | 49 | 14.5 |
| D | 2 | 206 | 4409 | 301.36 | 51 | 49 | 14.5 |
| D | 12 | 221 | 1915 | 128.98 | 51 | 49 | 14.5 |
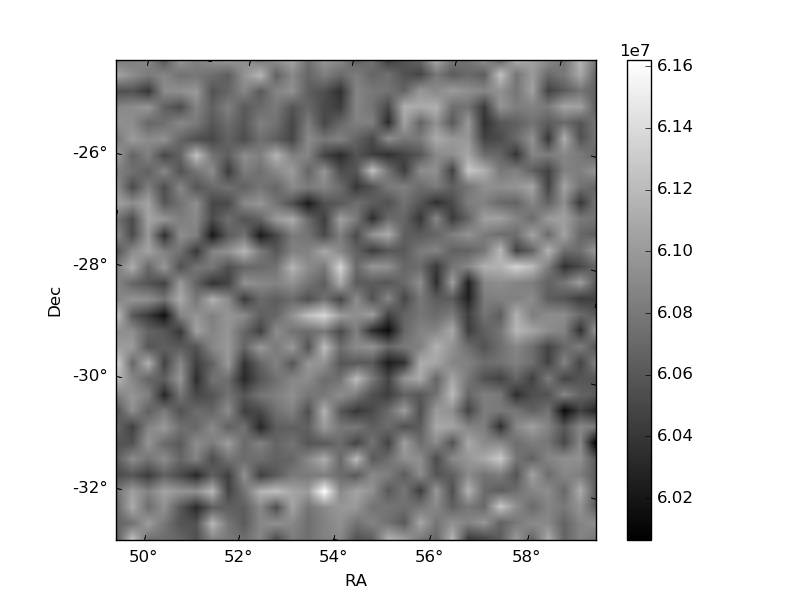
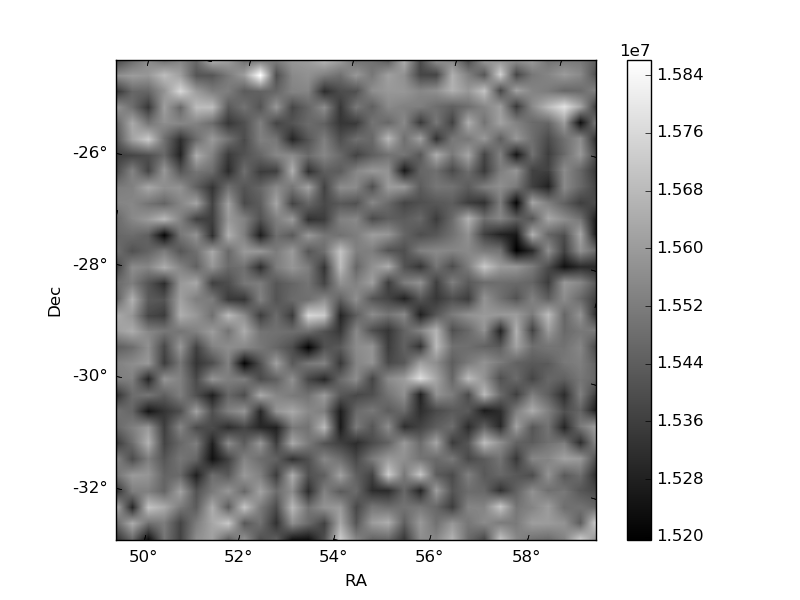
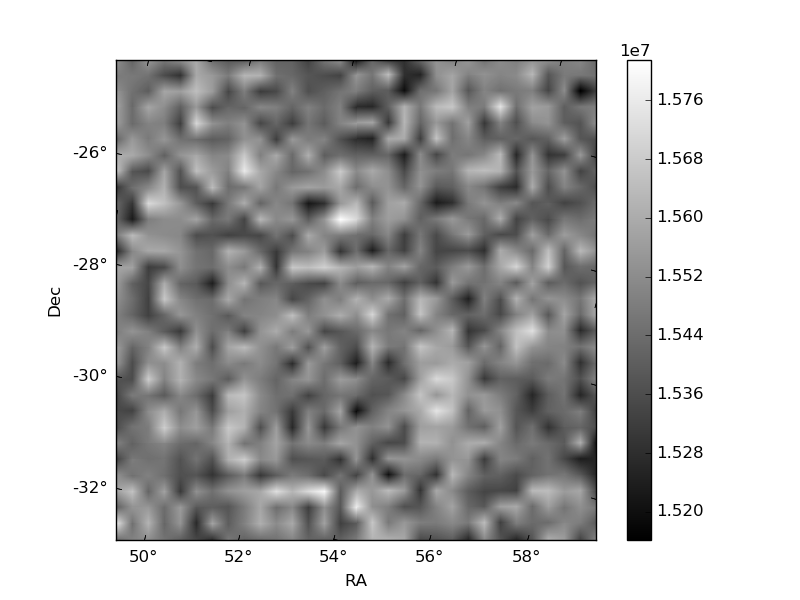
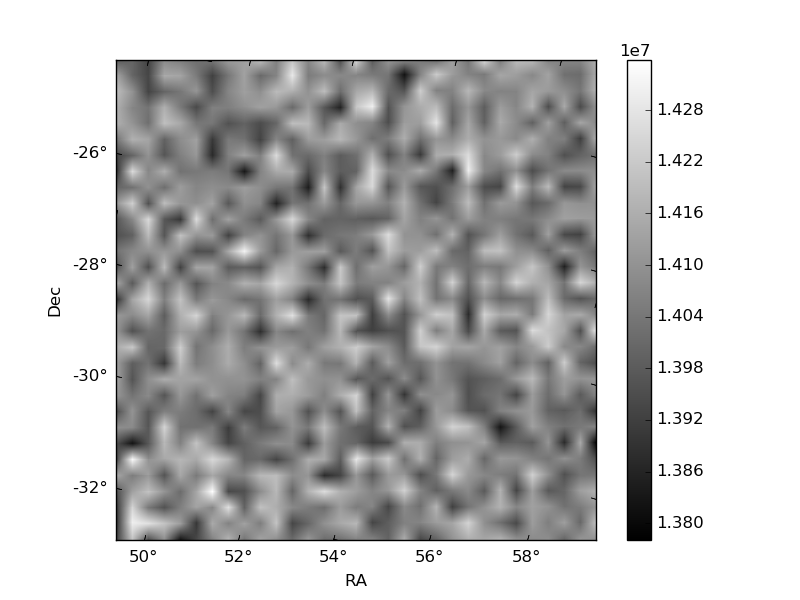
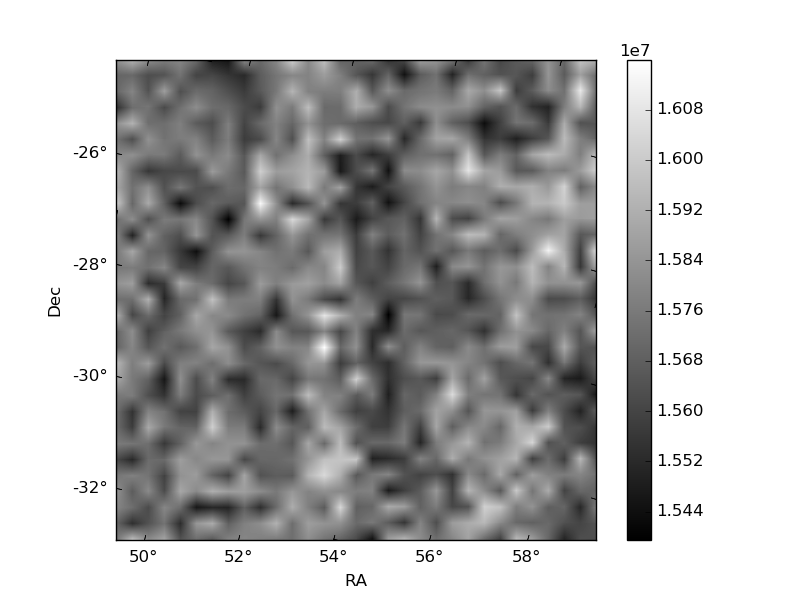
Histogram calculated using DETX and DETY for each event in the final _common_clean file
| Quadrant A | 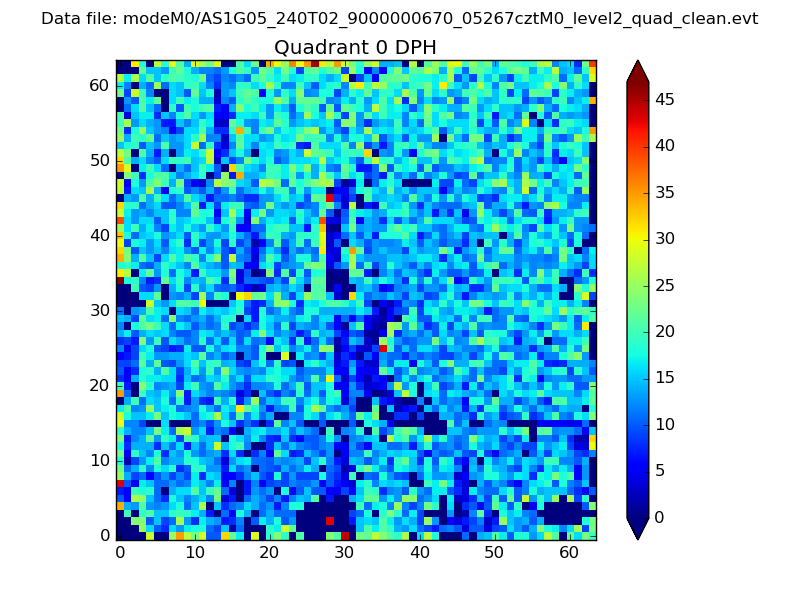 |
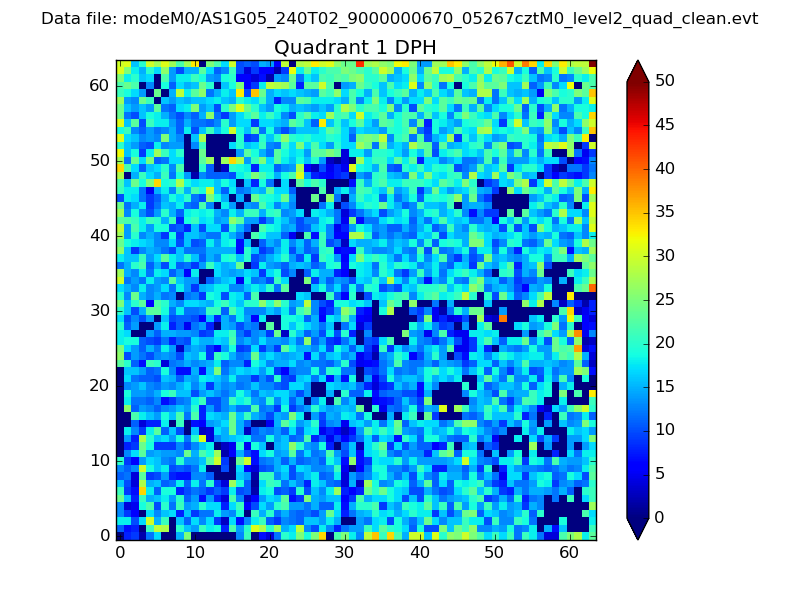 |
Quadrant B |
|---|---|---|---|
| Quadrant D | 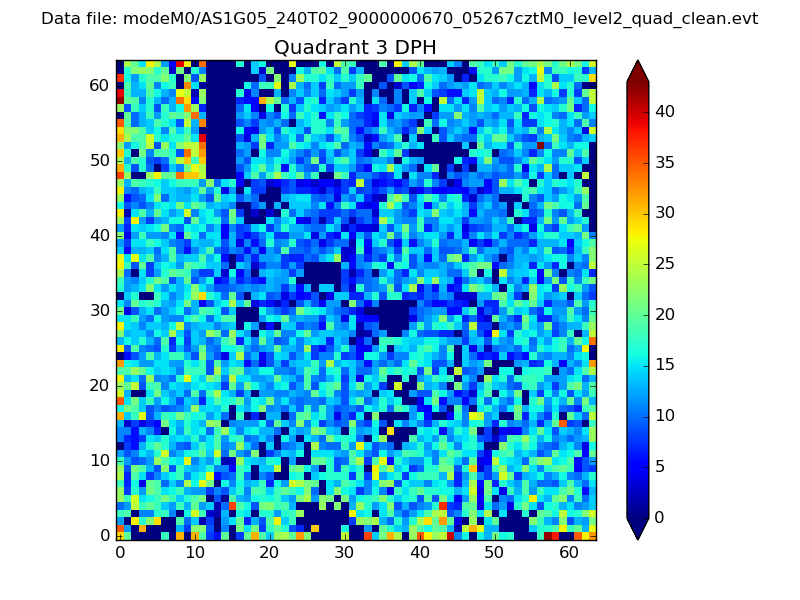 |
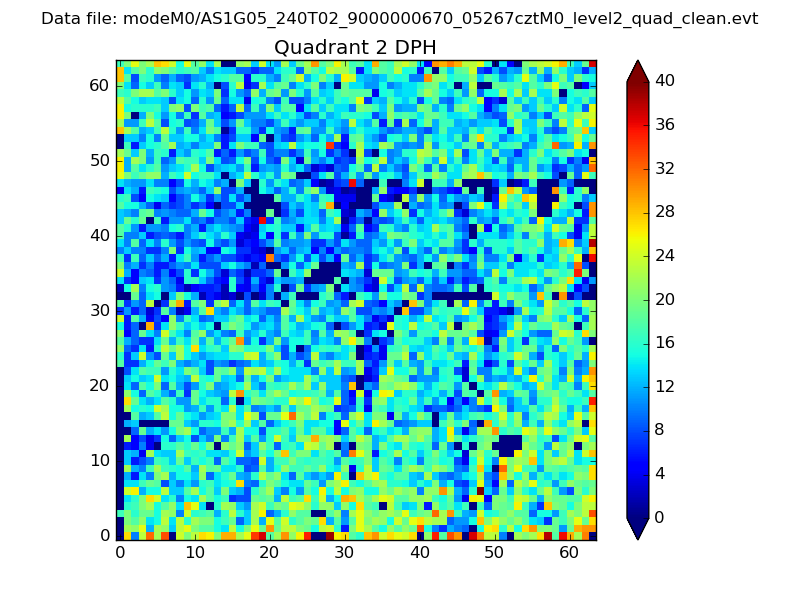 |
Quadrant C |
| Plot type | Count rate plots | Images |
|---|---|---|
| Comparison with Poisson distribution Blue bars denote a histogram of data divided into 1 sec bins. Red curve is a Poisson curve with rate = median count rate of data. |
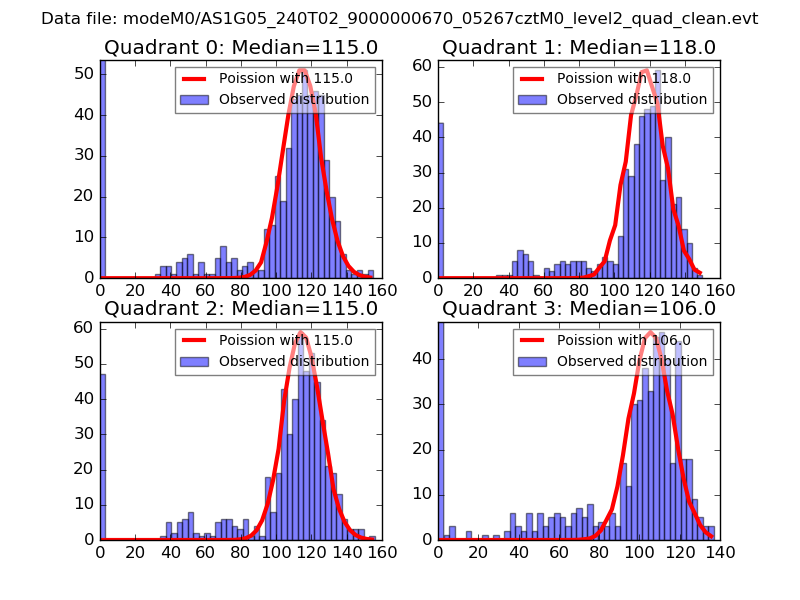 |
 |
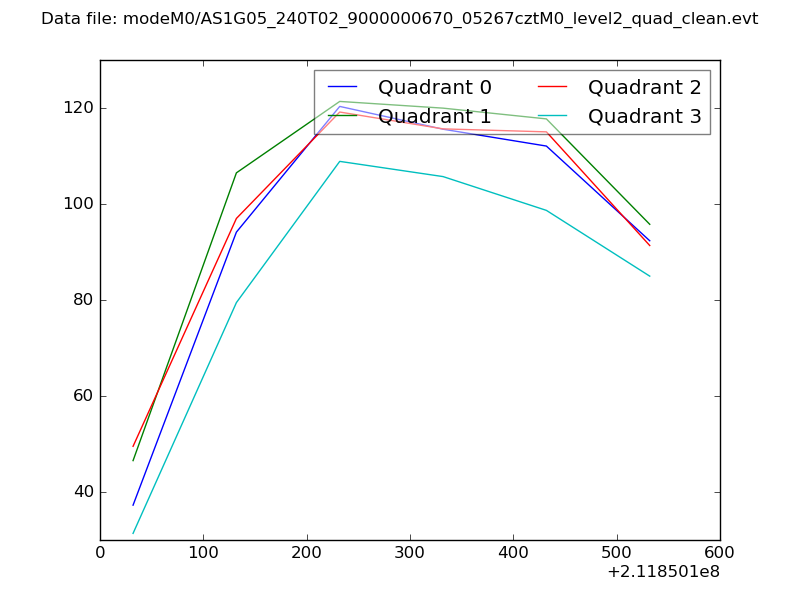
| Quadrant-wise count rates Data is divided into 100 sec bins |
 |
|
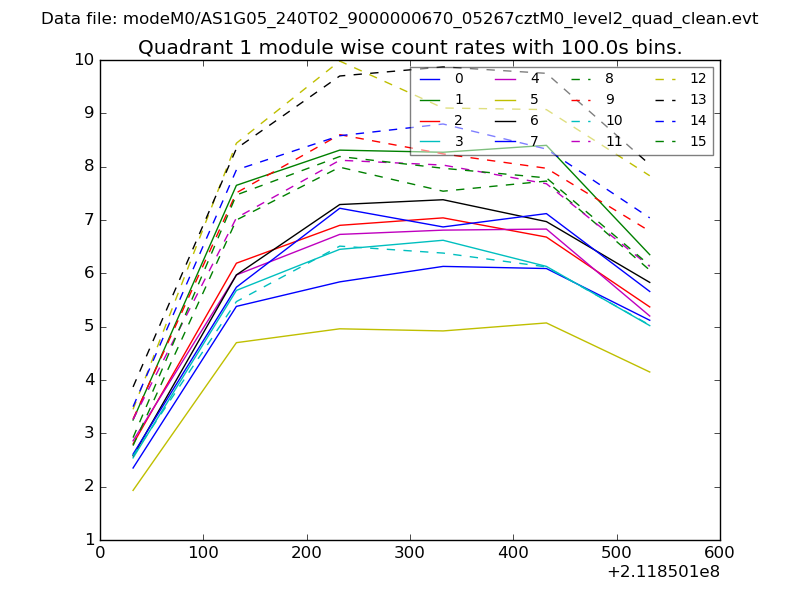
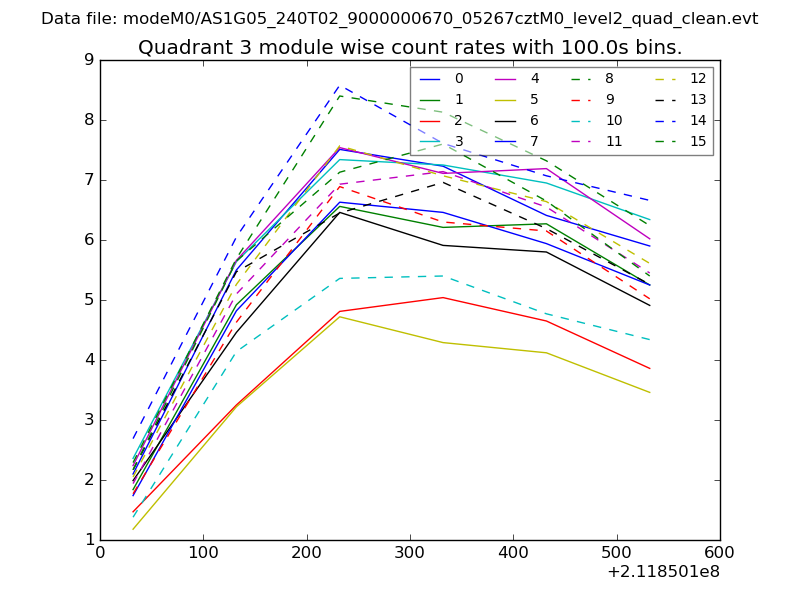
| Module-wise count rates for Quadrant A Data is divided into 100 sec bins |
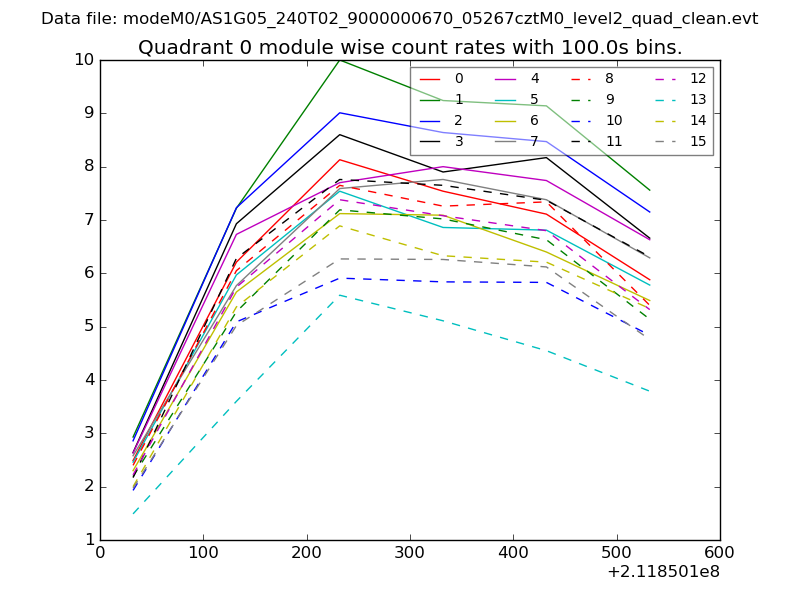 |
 |
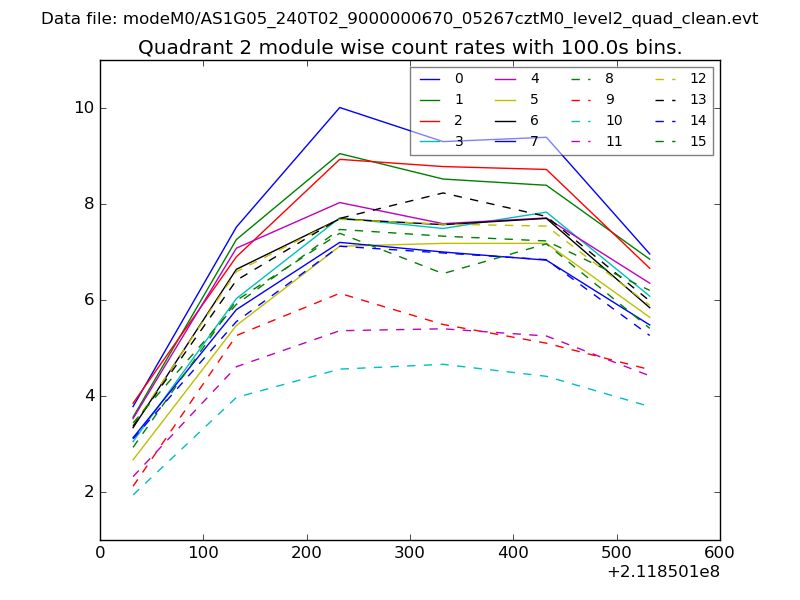
| Module-wise count rates for Quadrant B Data is divided into 100 sec bins |
 |
 |
| Module-wise count rates for Quadrant C Data is divided into 100 sec bins |
 |
 |
| Module-wise count rates for Quadrant D Data is divided into 100 sec bins |
 |
 |
| Parameter | Plot |
|---|---|
| CZT HV Monitor | 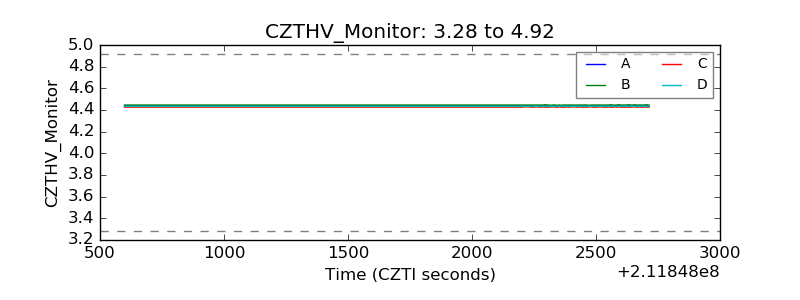 |
| D_VDD | 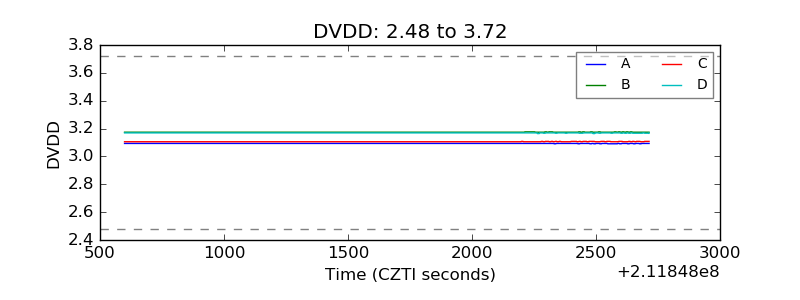 |
| Temperature 1 | 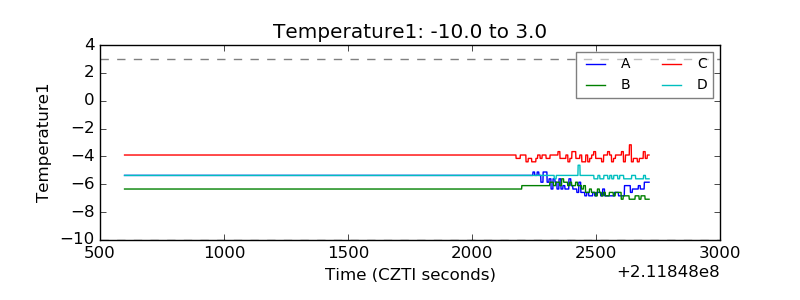 |
| Veto HV Monitor | 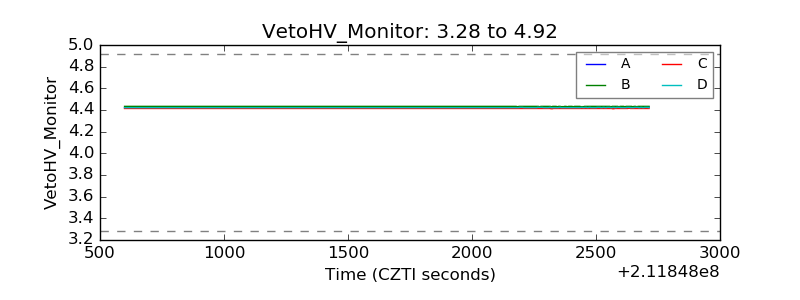 |
| Veto LLD | 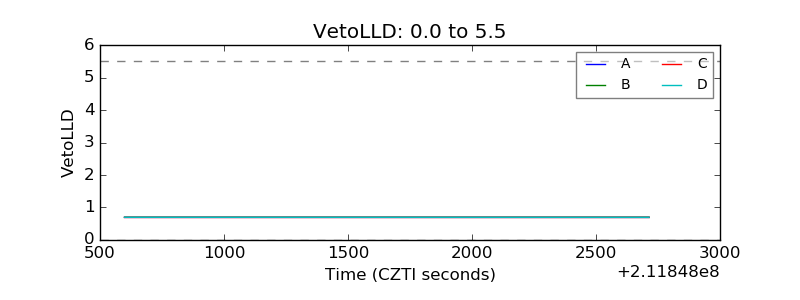 |
| Alpha Counter | 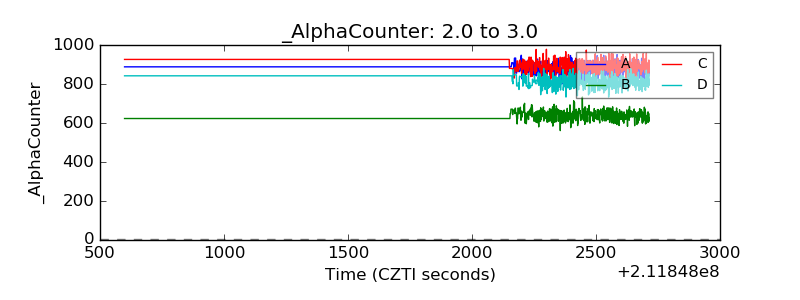 |
| _CPM_Rate | 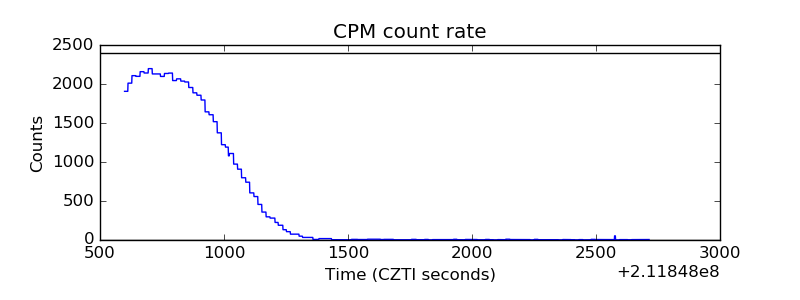 |
| CZT Counter | 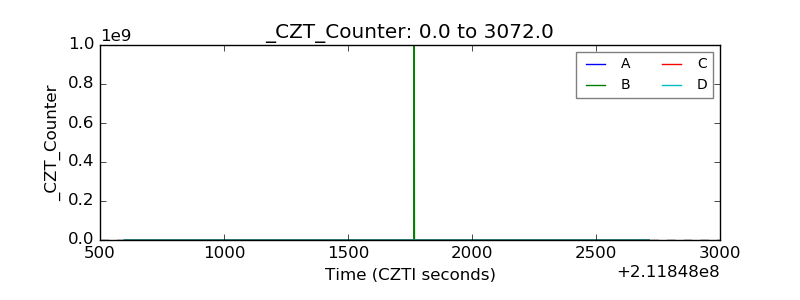 |
| +2.5 Volts monitor |  |
| +5 Volts monitor | 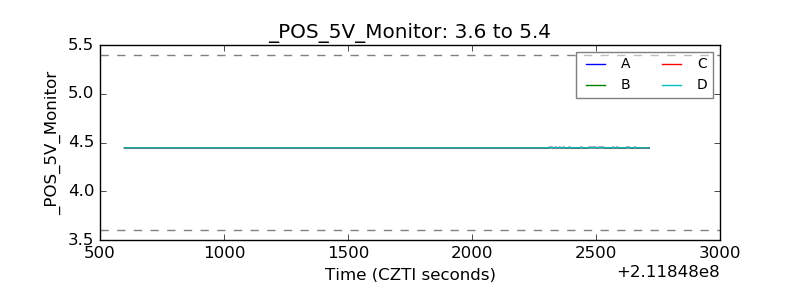 |
| _ROLL_ROT |  |
| _Roll_DEC | 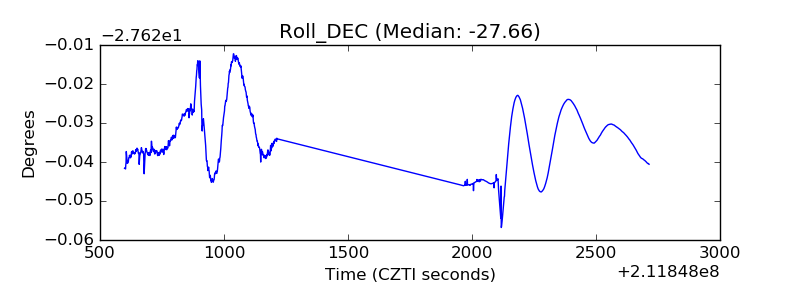 |
| _Roll_RA | 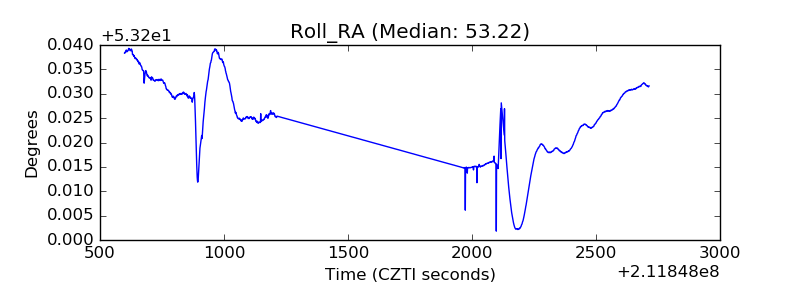 |
| Veto Counter | 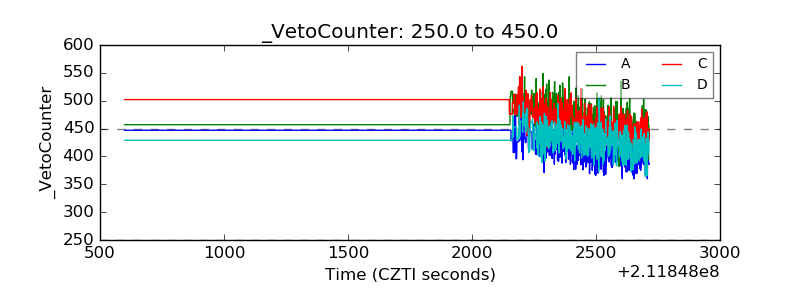 |