| Param | Original file | Final file |
|---|---|---|
| Filename | modeM0/AS1G05_240T02_9000000670_05268cztM0_level2.evt | modeM0/AS1G05_240T02_9000000670_05268cztM0_level2_quad_clean.evt |
| Size (bytes) | 533,894,400 | 88,021,440 |
| Size | 509.2 MB | 83.9 MB |
| Events in quadrant A | 3,997,884 | 557,842 |
| Events in quadrant B | 3,198,641 | 578,266 |
| Events in quadrant C | 3,119,569 | 562,690 |
| Events in quadrant D | 5,404,884 | 506,174 |
| Mode SS | |||
|---|---|---|---|
| Quadrant | BADHDUFLAG | Total packets | Discarded packets |
| A | 0 | 134 | 0 |
| B | 0 | 134 | 0 |
| C | 0 | 134 | 0 |
| D | 0 | 134 | 0 |
| Mode M9 | |||
|---|---|---|---|
| Quadrant | BADHDUFLAG | Total packets | Discarded packets |
| A | 0 | 16 | 0 |
| B | 0 | 16 | 0 |
| C | 0 | 16 | 0 |
| D | 0 | 17 | 0 |
| Mode M0 | |||
|---|---|---|---|
| Quadrant | BADHDUFLAG | Total packets | Discarded packets |
| A | 0 | 16248 | 3 |
| B | 0 | 13767 | 2 |
| C | 0 | 13605 | 2 |
| D | 0 | 20683 | 2 |
| Quadrant | Total seconds | Saturated seconds | Saturation percentage |
|---|---|---|---|
| A | 6604 | 128 | 1.938219% |
| B | 6604 | 42 | 0.635978% |
| C | 6604 | 17 | 0.257420% |
| D | 6604 | 633 | 9.585100% |
Noise dominated data is calculated using 1-second bins in cleaned event files. If a bin has >2000 counts, and if more than 50% of those come from <1% of pixels, then it is considered to be noise-dominated and hence unusable.
| Quadrant | # 1 sec bins | Bins with >0 counts | Bins with >2000 counts | High rate bins dominated by noise | Noise dominated (total time) | Noise dominated (detector-on time) | Marked lightcurve |
|---|---|---|---|---|---|---|---|
| A | 7904 | 6605 | 73 | 73 | 0.92% | 1.11% | 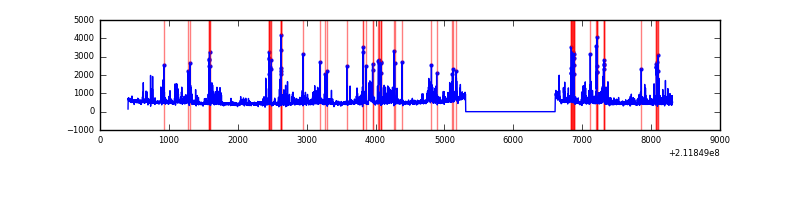 |
| B | 7904 | 6605 | 0 | 0 | 0.00% | 0.00% | 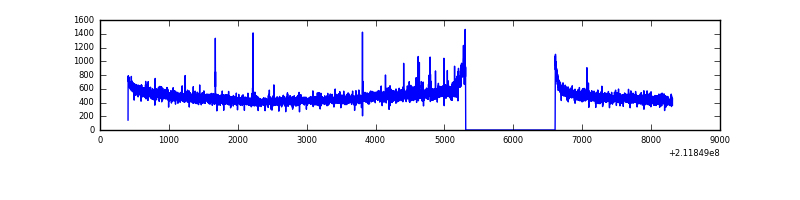 |
| C | 7904 | 6605 | 1 | 1 | 0.01% | 0.02% | 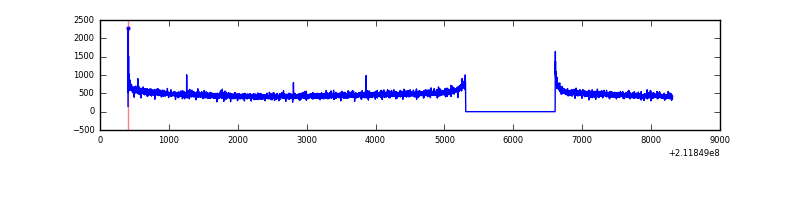 |
| D | 7904 | 6605 | 491 | 491 | 6.21% | 7.43% |  |
Top three noisy pixels from each quadrant. If the there are fewer than three noisy pixels in the level2.evt file, extra rows are filled as -1
| Pixel properties | Quadrant properties | ||||||
|---|---|---|---|---|---|---|---|
| Quadrant | DetID | PixID | Counts | Sigma | Mean | Median | Sigma |
| A | 13 | 251 | 953343 | 6007.42 | 788 | 769 | 158.6 |
| A | 0 | 50 | 10386 | 60.65 | 788 | 769 | 158.6 |
| A | 12 | 194 | 7643 | 43.35 | 788 | 769 | 158.6 |
| B | 15 | 204 | 21330 | 134.76 | 810 | 791 | 152.4 |
| B | 12 | 111 | 14119 | 87.45 | 810 | 791 | 152.4 |
| B | 15 | 54 | 14003 | 86.69 | 810 | 791 | 152.4 |
| C | 1 | 16 | 29114 | 154.28 | 789 | 795 | 183.6 |
| C | 12 | 4 | 7990 | 39.2 | 789 | 795 | 183.6 |
| C | 13 | 61 | 6538 | 31.29 | 789 | 795 | 183.6 |
| D | 11 | 145 | 2417339 | 13402.43 | 745 | 724 | 180.3 |
| D | 2 | 136 | 65380 | 358.58 | 745 | 724 | 180.3 |
| D | 2 | 14 | 31588 | 171.17 | 745 | 724 | 180.3 |
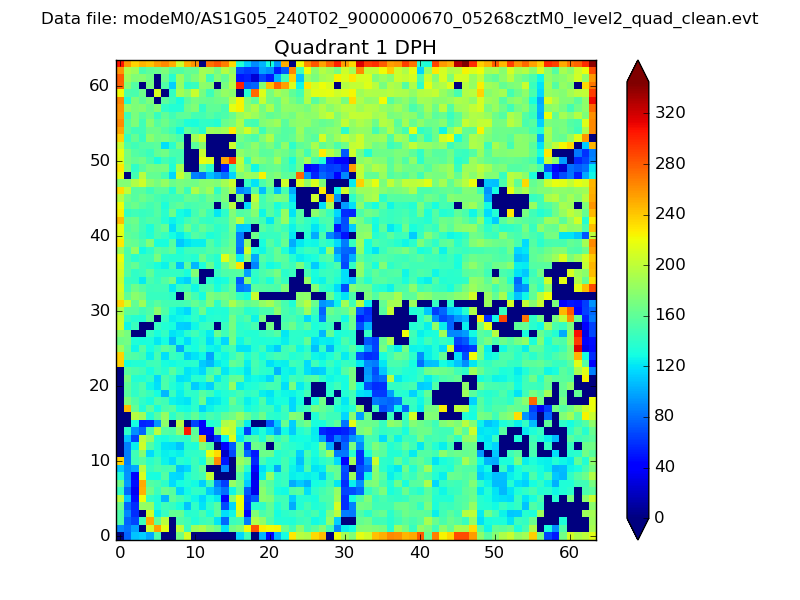
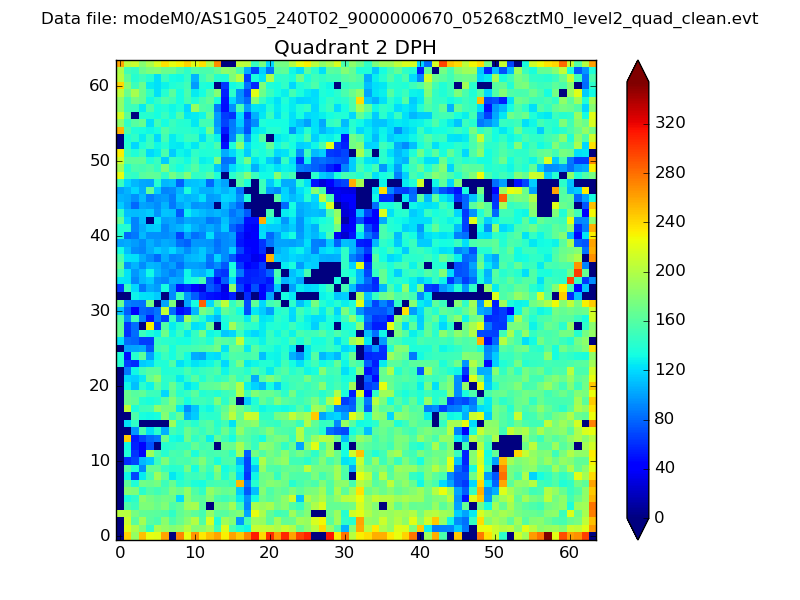
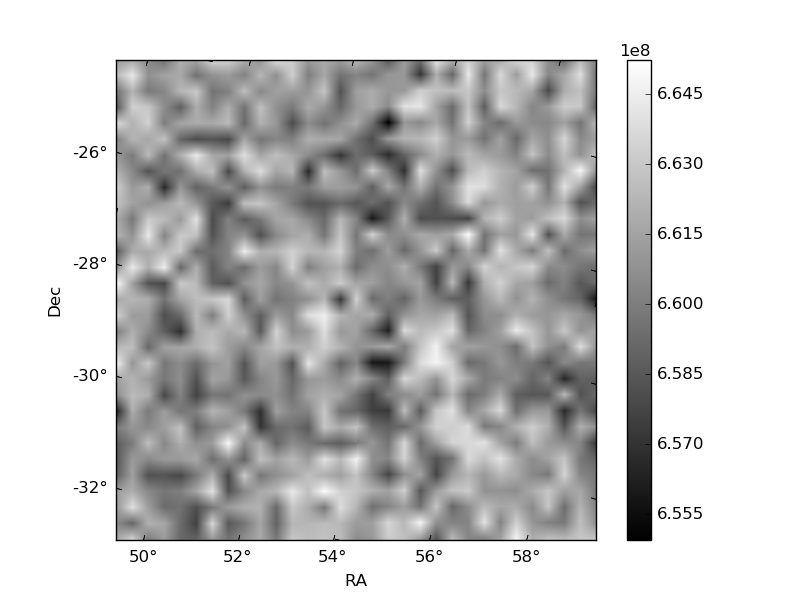
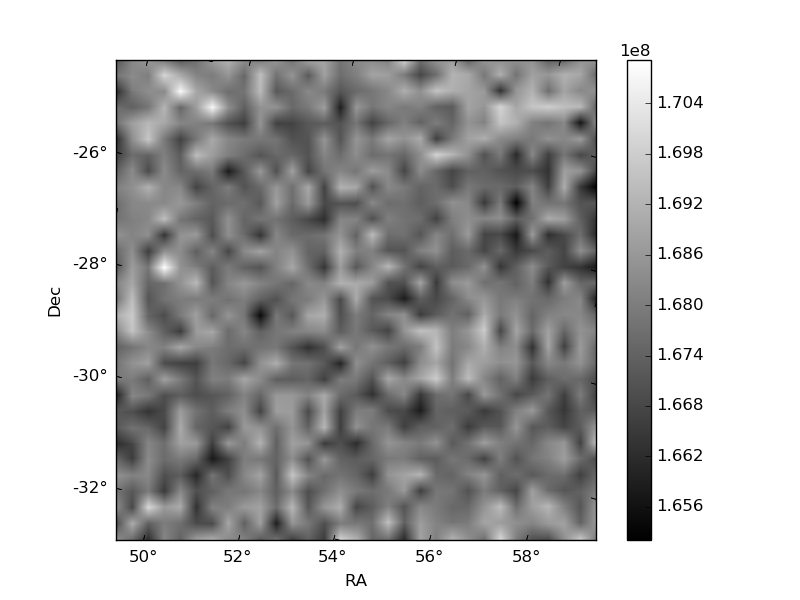
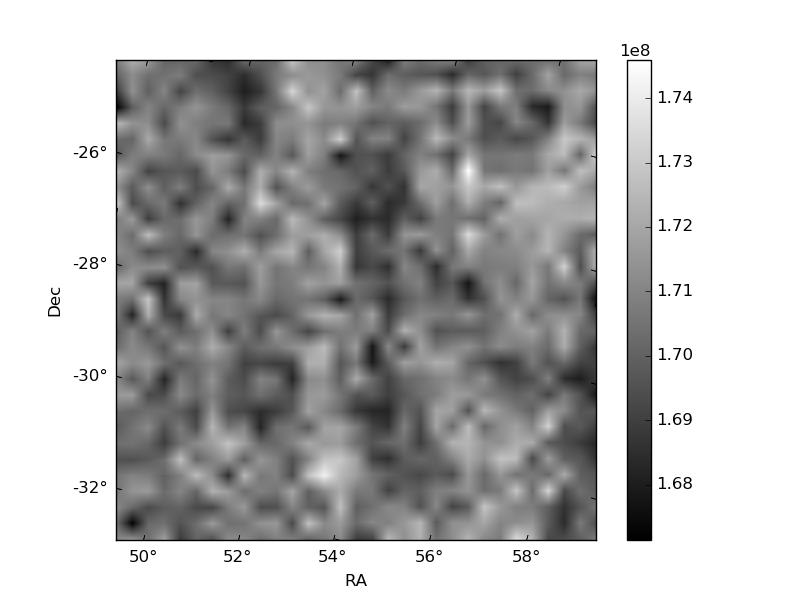
Histogram calculated using DETX and DETY for each event in the final _common_clean file
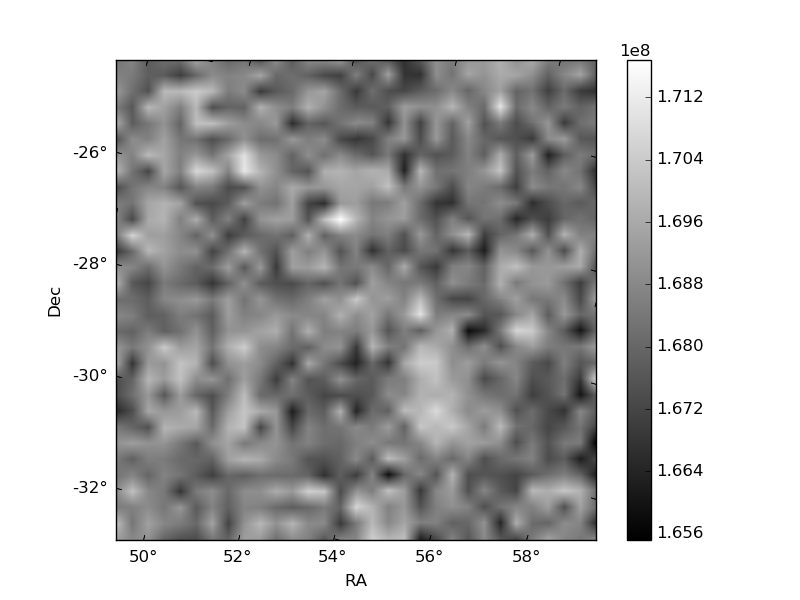
| Quadrant A | 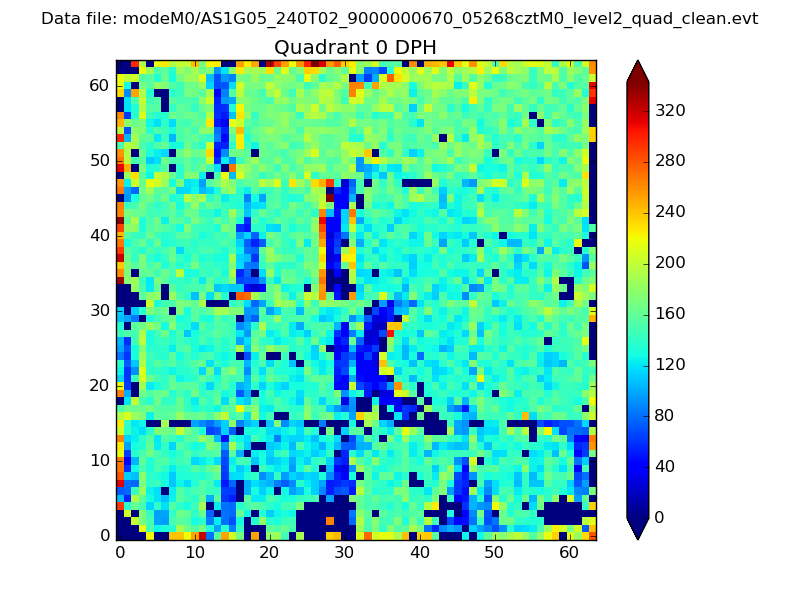 |
 |
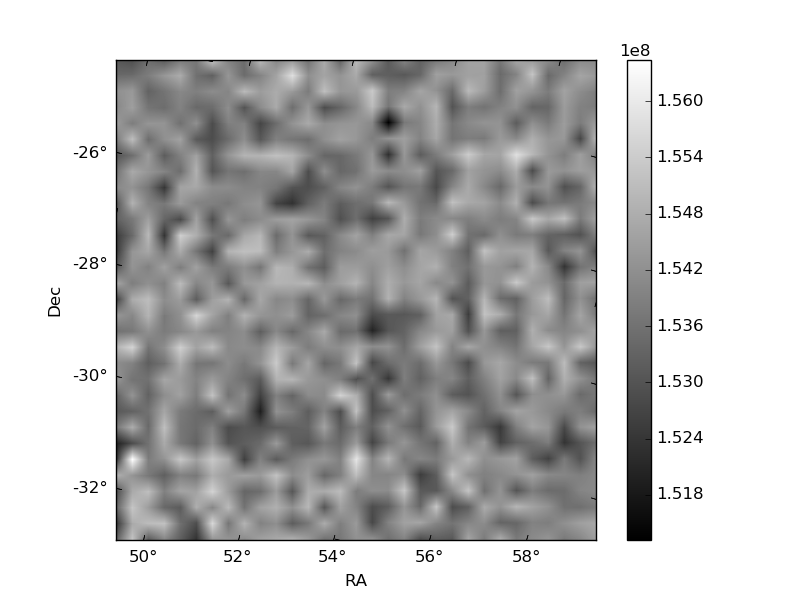
Quadrant B |
|---|---|---|---|
| Quadrant D | 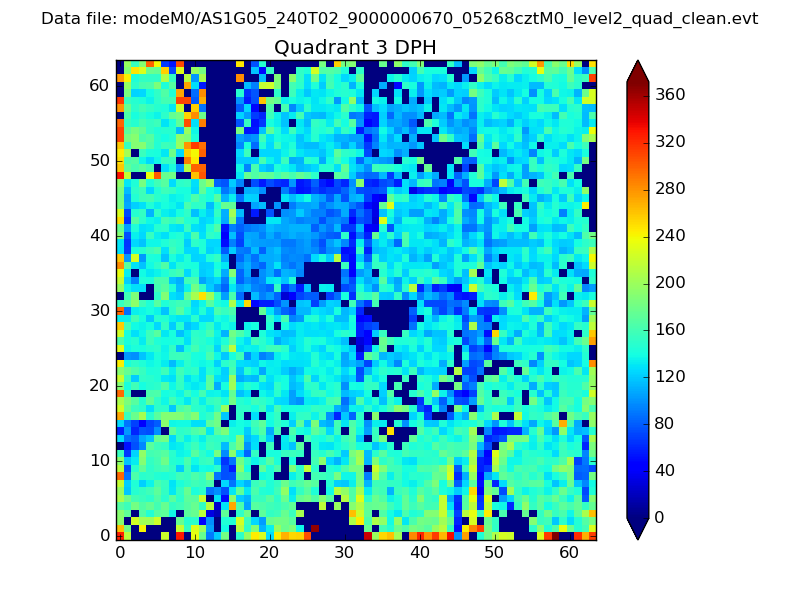 |
 |
Quadrant C |
| Plot type | Count rate plots | Images |
|---|---|---|
| Comparison with Poisson distribution Blue bars denote a histogram of data divided into 1 sec bins. Red curve is a Poisson curve with rate = median count rate of data. |
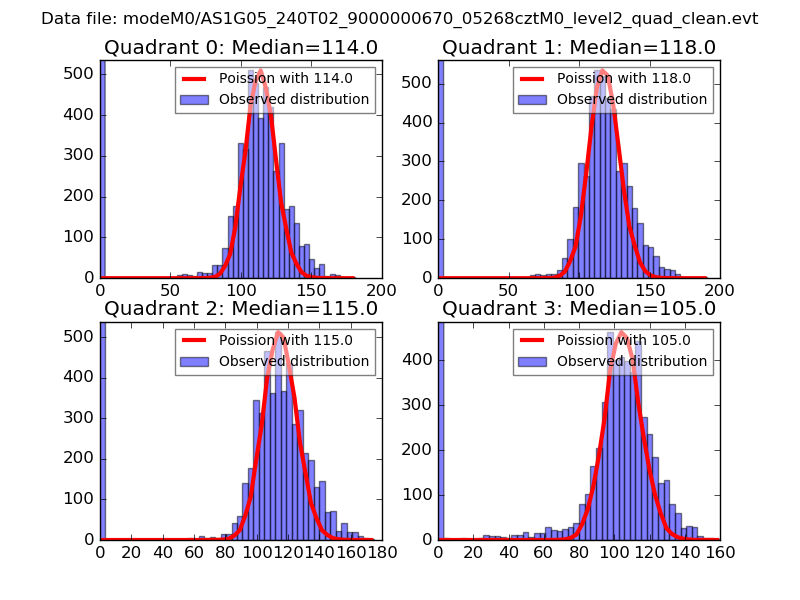 |
 |
| Quadrant-wise count rates Data is divided into 100 sec bins |
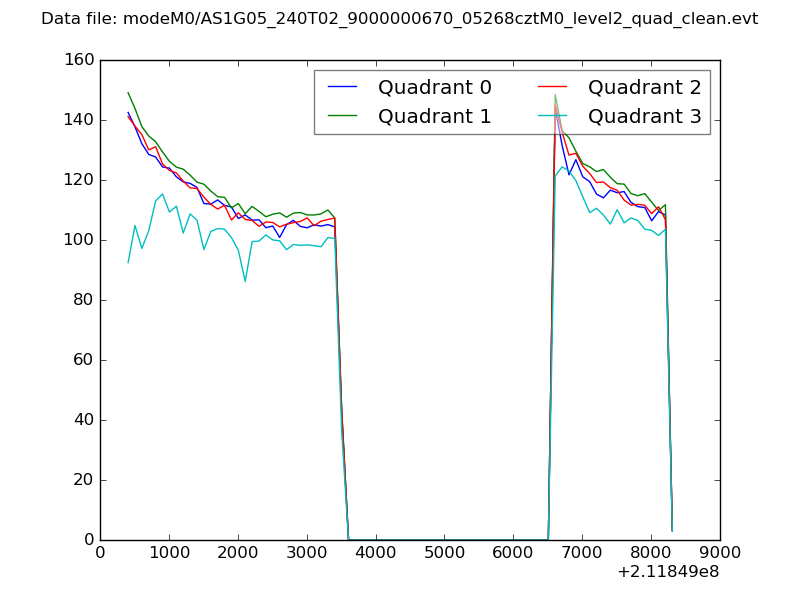 |
|
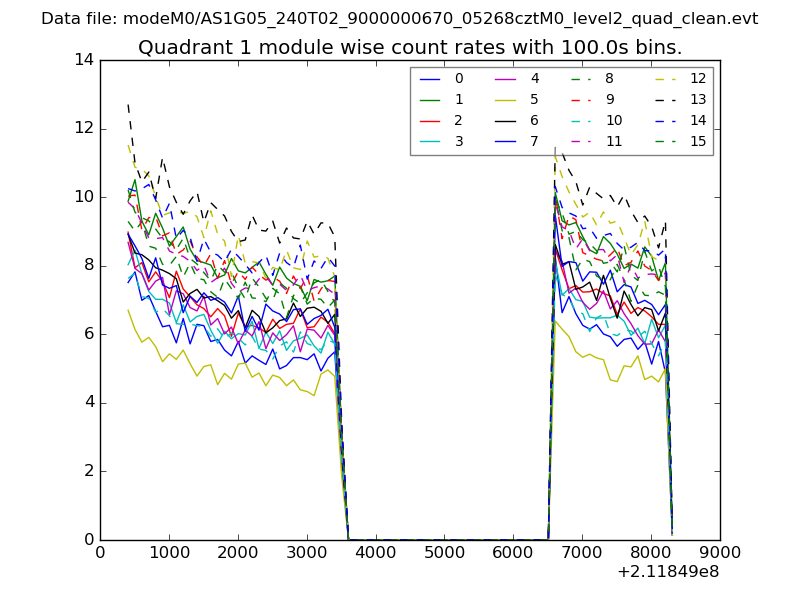
| Module-wise count rates for Quadrant A Data is divided into 100 sec bins |
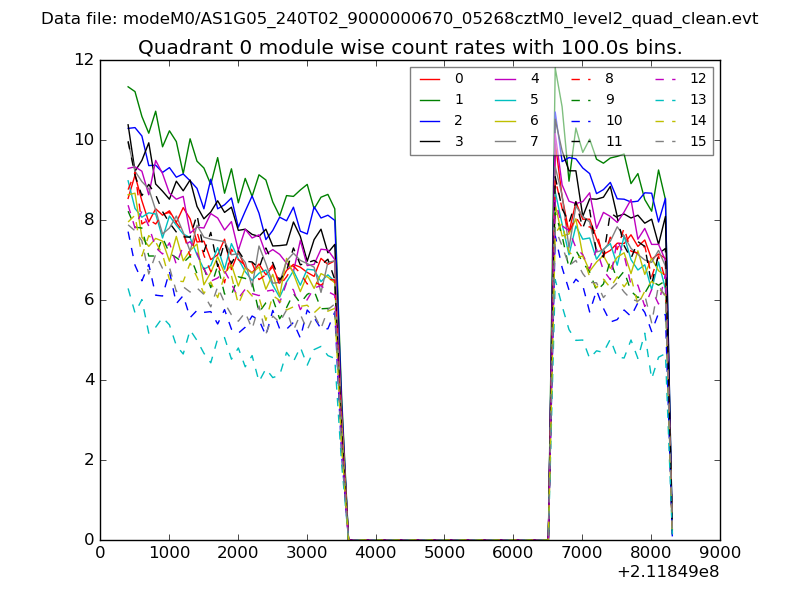 |
 |
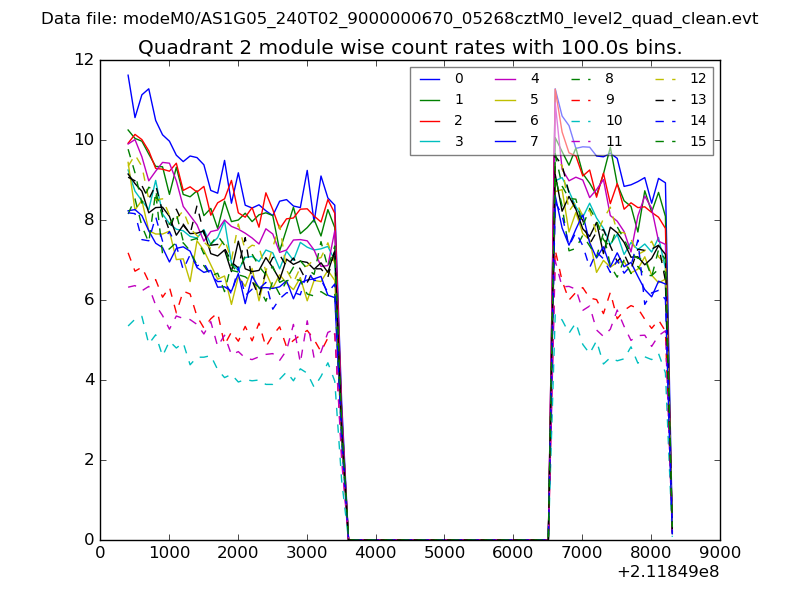
| Module-wise count rates for Quadrant B Data is divided into 100 sec bins |
 |
 |
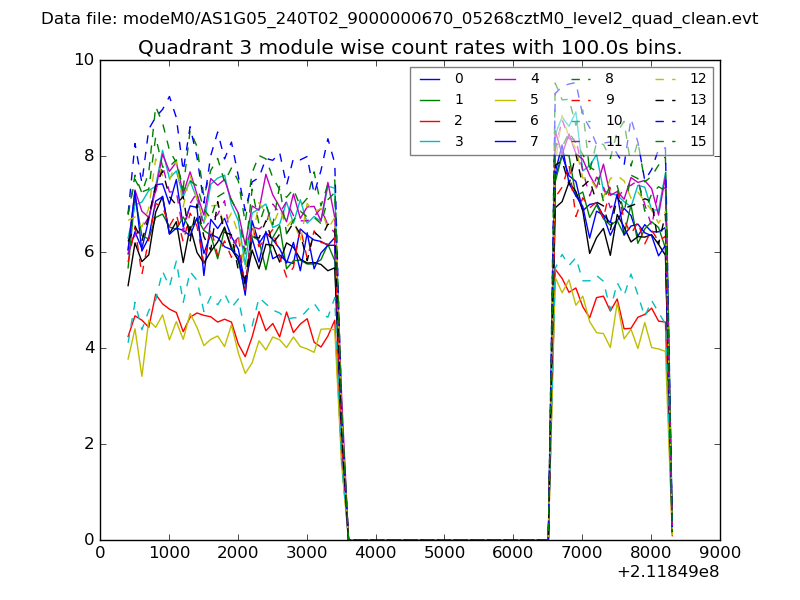
| Module-wise count rates for Quadrant C Data is divided into 100 sec bins |
 |
 |
| Module-wise count rates for Quadrant D Data is divided into 100 sec bins |
 |
 |
| Parameter | Plot |
|---|---|
| CZT HV Monitor | 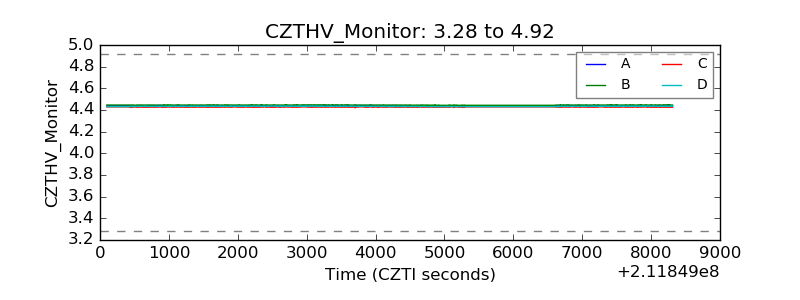 |
| D_VDD | 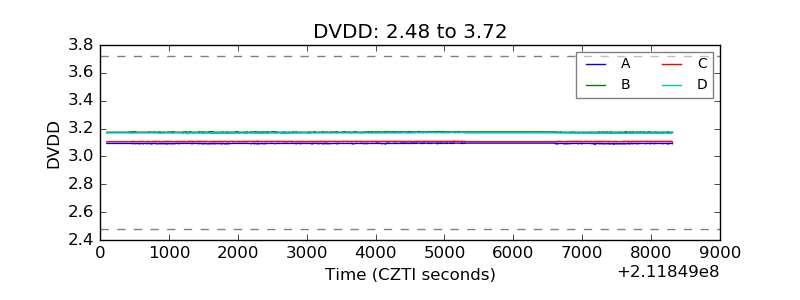 |
| Temperature 1 | 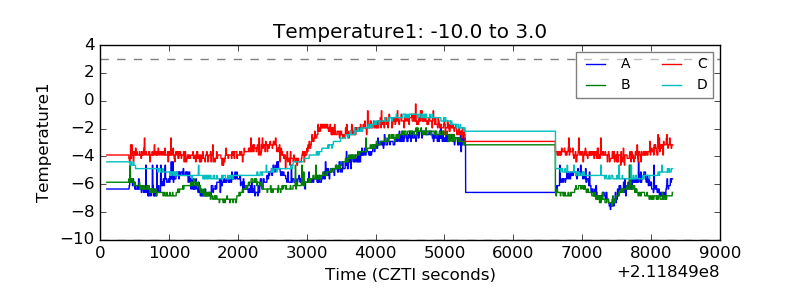 |
| Veto HV Monitor | 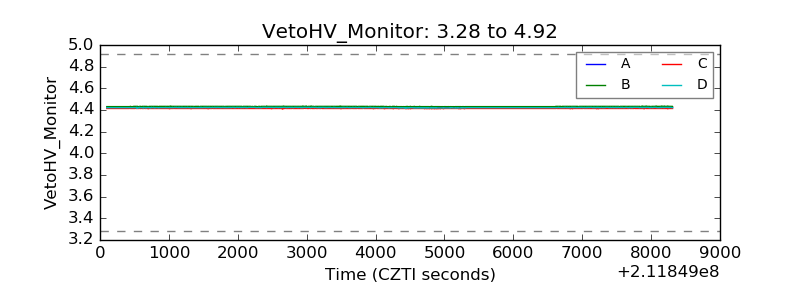 |
| Veto LLD | 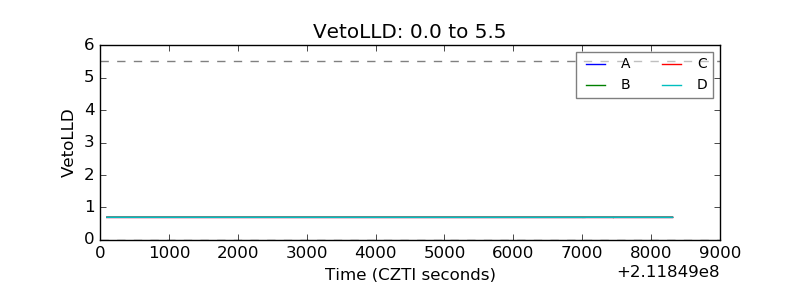 |
| Alpha Counter | 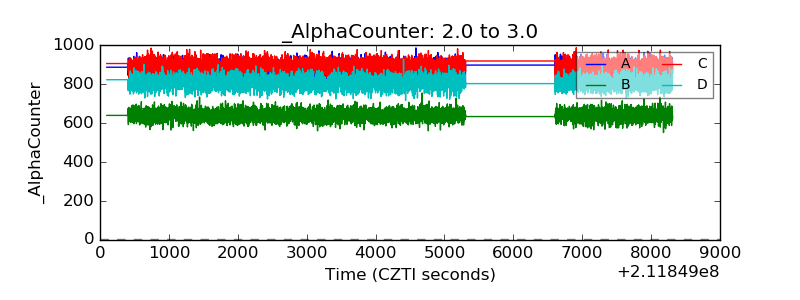 |
| _CPM_Rate | 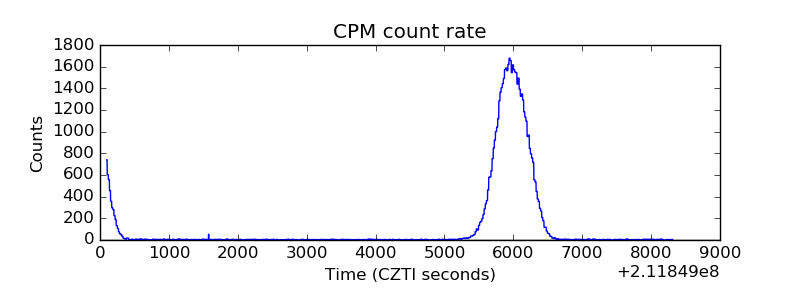 |
| CZT Counter | 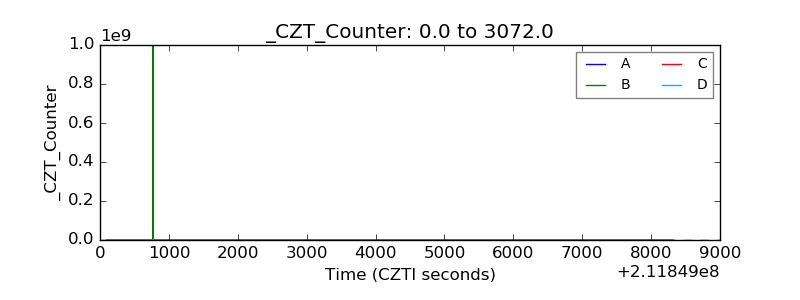 |
| +2.5 Volts monitor |  |
| +5 Volts monitor |  |
| _ROLL_ROT | 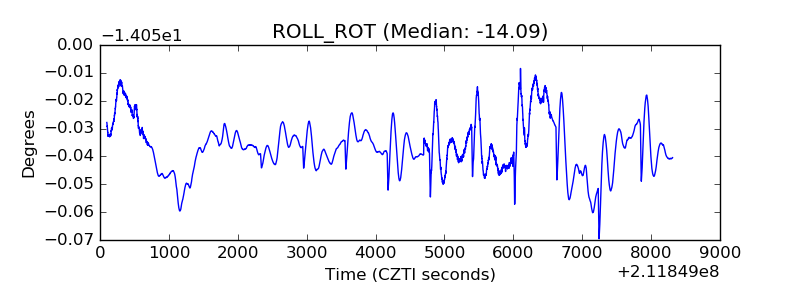 |
| _Roll_DEC | 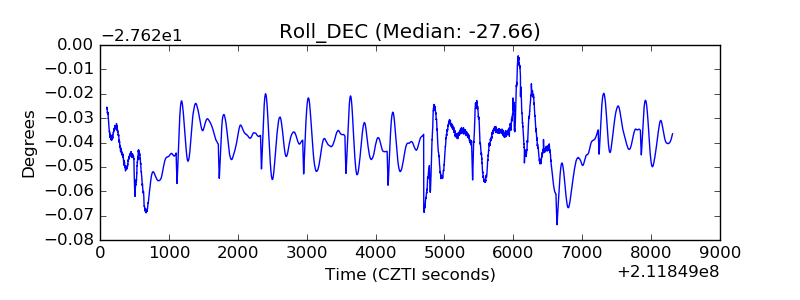 |
| _Roll_RA | 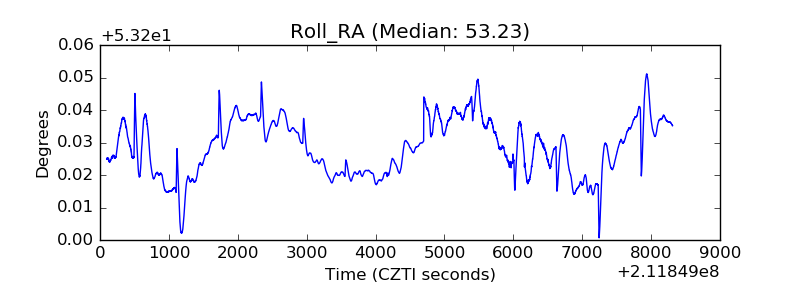 |
| Veto Counter | 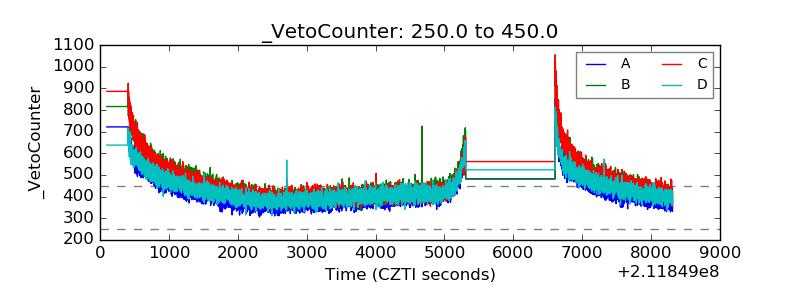 |