| Param | Original file | Final file |
|---|---|---|
| Filename | modeM0/AS1G05_240T02_9000000670_05270cztM0_level2.evt | modeM0/AS1G05_240T02_9000000670_05270cztM0_level2_quad_clean.evt |
| Size (bytes) | 477,587,520 | 75,744,000 |
| Size | 455.5 MB | 72.2 MB |
| Events in quadrant A | 3,017,424 | 469,172 |
| Events in quadrant B | 3,018,142 | 477,184 |
| Events in quadrant C | 2,953,623 | 466,342 |
| Events in quadrant D | 5,035,891 | 430,570 |
| Mode SS | |||
|---|---|---|---|
| Quadrant | BADHDUFLAG | Total packets | Discarded packets |
| A | 0 | 136 | 4 |
| B | 0 | 136 | 0 |
| C | 0 | 136 | 2 |
| D | 0 | 136 | 4 |
| Mode M9 | |||
|---|---|---|---|
| Quadrant | BADHDUFLAG | Total packets | Discarded packets |
| A | 0 | 15 | 0 |
| B | 0 | 15 | 0 |
| C | 0 | 15 | 0 |
| D | 0 | 16 | 0 |
| Mode M0 | |||
|---|---|---|---|
| Quadrant | BADHDUFLAG | Total packets | Discarded packets |
| A | 0 | 13665 | 339 |
| B | 0 | 13590 | 300 |
| C | 0 | 13534 | 300 |
| D | 0 | 19982 | 417 |
| Quadrant | Total seconds | Saturated seconds | Saturation percentage |
|---|---|---|---|
| A | 6432 | 30 | 0.466418% |
| B | 6452 | 41 | 0.635462% |
| C | 6448 | 21 | 0.325682% |
| D | 6443 | 572 | 8.877852% |
Noise dominated data is calculated using 1-second bins in cleaned event files. If a bin has >2000 counts, and if more than 50% of those come from <1% of pixels, then it is considered to be noise-dominated and hence unusable.
| Quadrant | # 1 sec bins | Bins with >0 counts | Bins with >2000 counts | High rate bins dominated by noise | Noise dominated (total time) | Noise dominated (detector-on time) | Marked lightcurve |
|---|---|---|---|---|---|---|---|
| A | 7682 | 6555 | 0 | 0 | 0.00% | 0.00% | 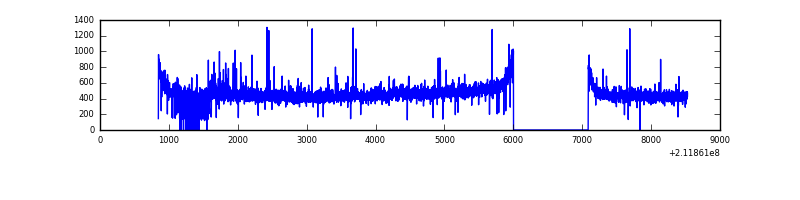 |
| B | 7682 | 6561 | 0 | 0 | 0.00% | 0.00% | 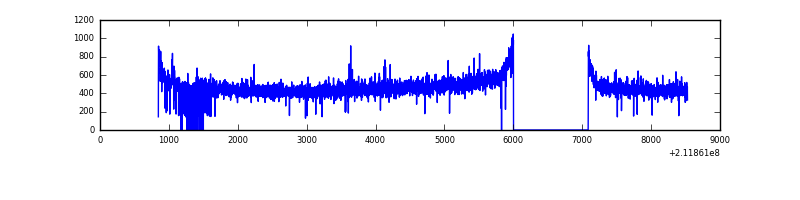 |
| C | 7682 | 6555 | 1 | 1 | 0.01% | 0.02% | 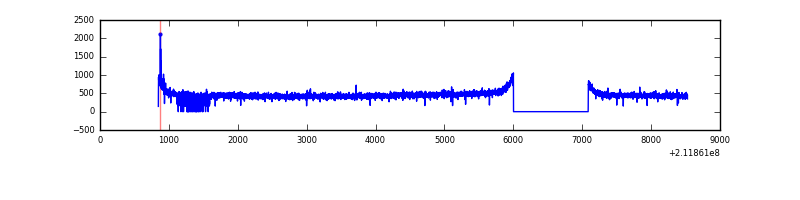 |
| D | 7682 | 6561 | 425 | 425 | 5.53% | 6.48% | 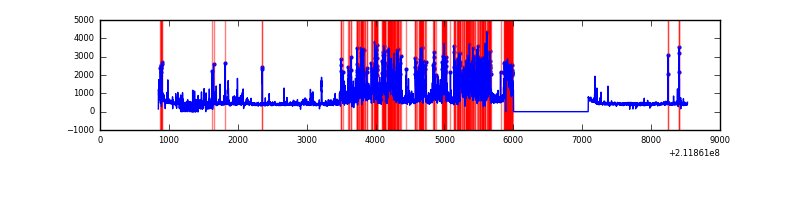 |
Top three noisy pixels from each quadrant. If the there are fewer than three noisy pixels in the level2.evt file, extra rows are filled as -1
| Pixel properties | Quadrant properties | ||||||
|---|---|---|---|---|---|---|---|
| Quadrant | DetID | PixID | Counts | Sigma | Mean | Median | Sigma |
| A | 13 | 251 | 97880 | 629.1 | 758 | 740 | 154.4 |
| A | 12 | 194 | 7486 | 43.69 | 758 | 740 | 154.4 |
| A | 0 | 226 | 7369 | 42.93 | 758 | 740 | 154.4 |
| B | 15 | 204 | 14574 | 92.93 | 770 | 751 | 148.7 |
| B | 12 | 111 | 13657 | 86.76 | 770 | 751 | 148.7 |
| B | 4 | 80 | 11339 | 71.18 | 770 | 751 | 148.7 |
| C | 12 | 4 | 9263 | 49.12 | 749 | 754 | 173.2 |
| C | 1 | 16 | 8877 | 46.89 | 749 | 754 | 173.2 |
| C | 14 | 67 | 8683 | 45.77 | 749 | 754 | 173.2 |
| D | 11 | 145 | 2054703 | 11579.0 | 717 | 696 | 177.4 |
| D | 2 | 136 | 156181 | 876.51 | 717 | 696 | 177.4 |
| D | 10 | 15 | 27803 | 152.81 | 717 | 696 | 177.4 |
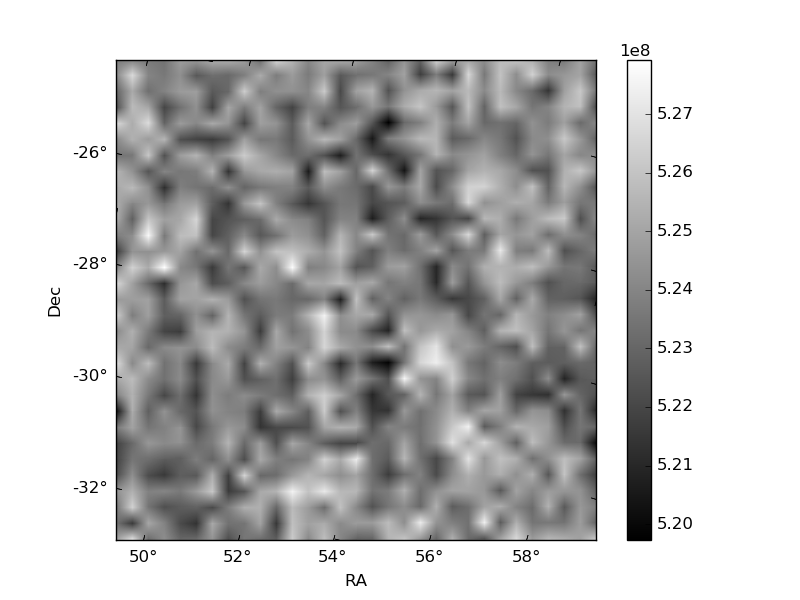
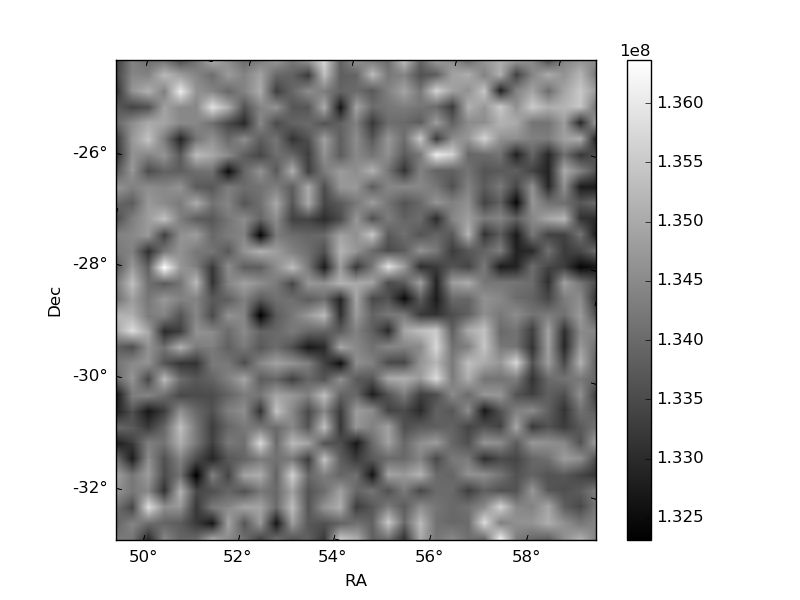
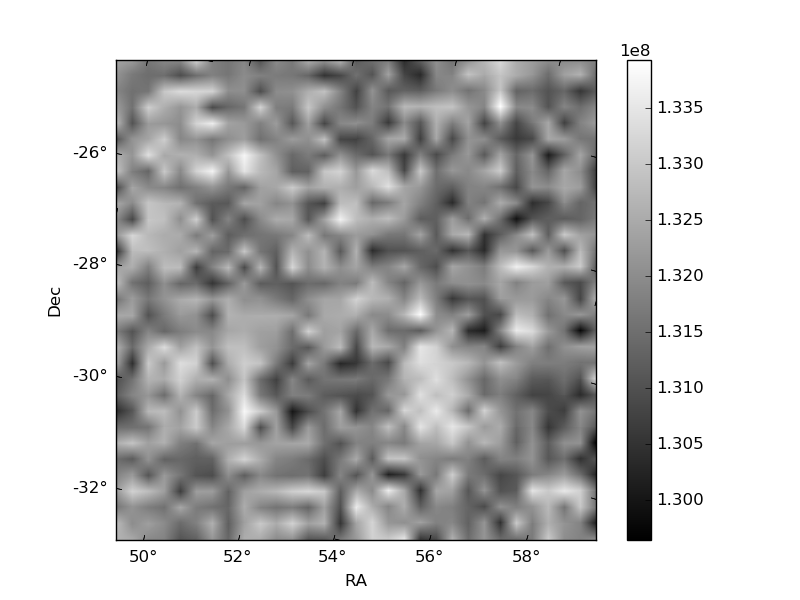
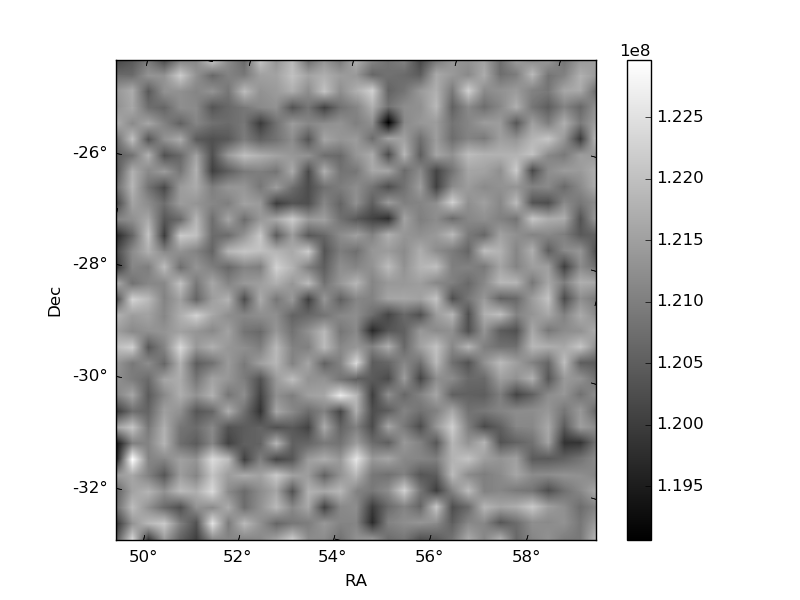
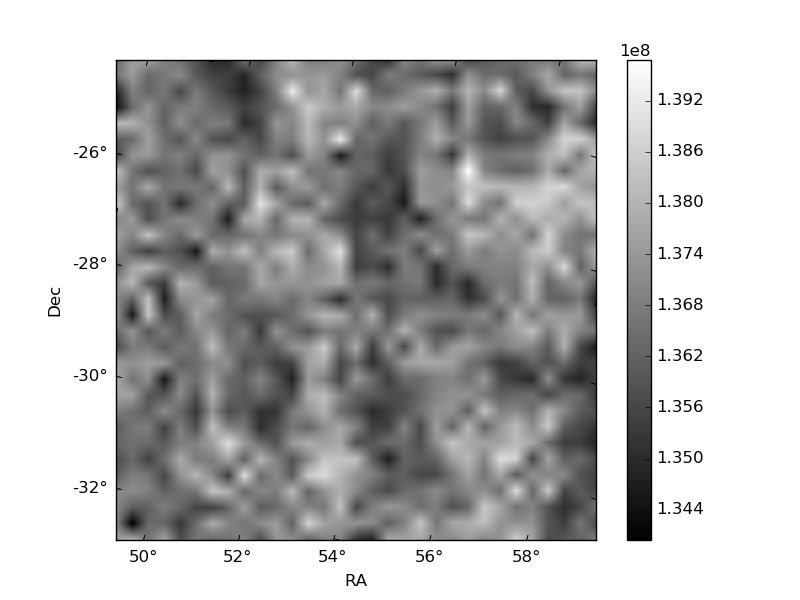
Histogram calculated using DETX and DETY for each event in the final _common_clean file
| Quadrant A | 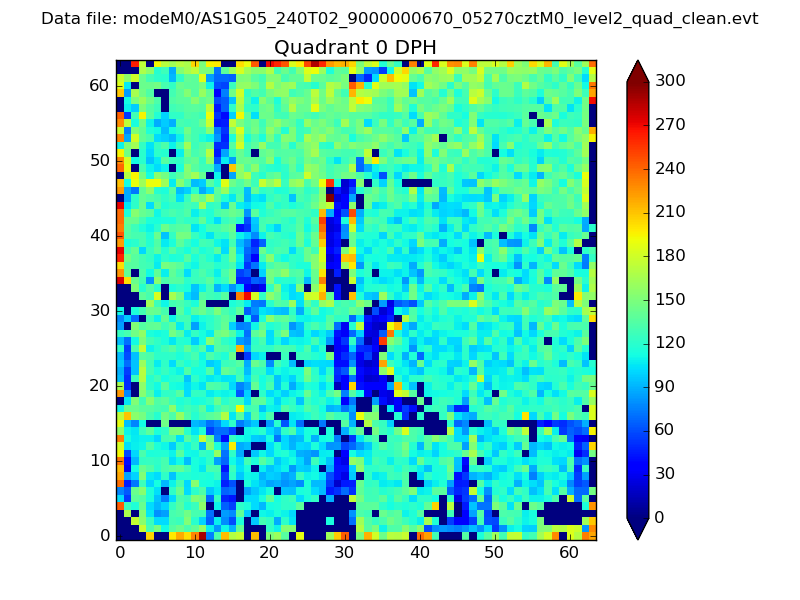 |
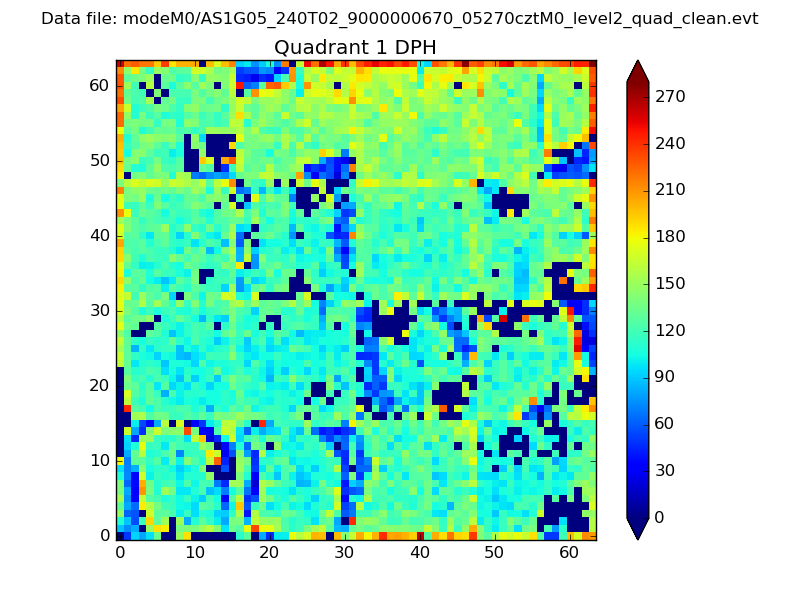 |
Quadrant B |
|---|---|---|---|
| Quadrant D | 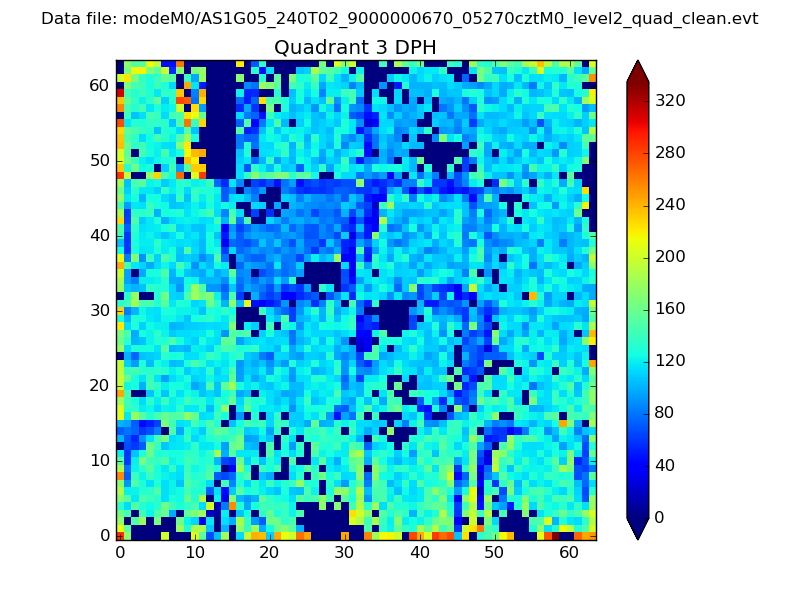 |
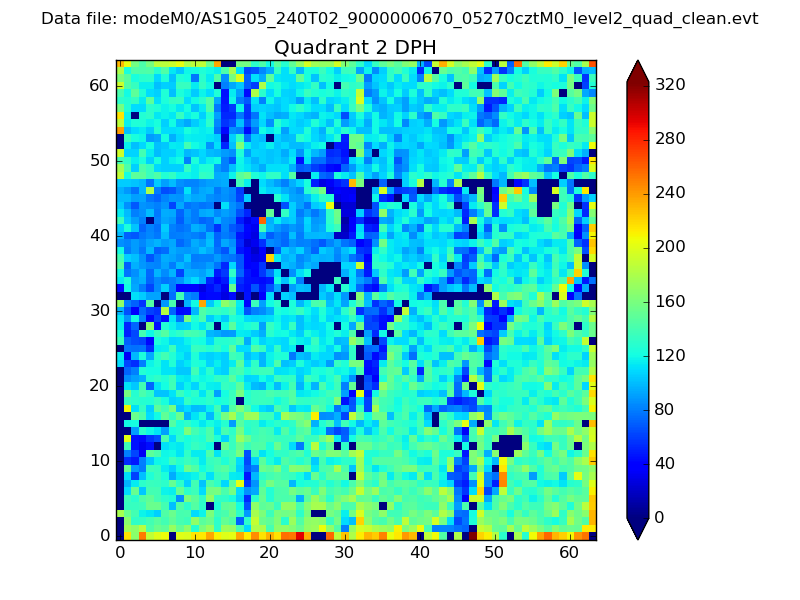 |
Quadrant C |
| Plot type | Count rate plots | Images |
|---|---|---|
| Comparison with Poisson distribution Blue bars denote a histogram of data divided into 1 sec bins. Red curve is a Poisson curve with rate = median count rate of data. |
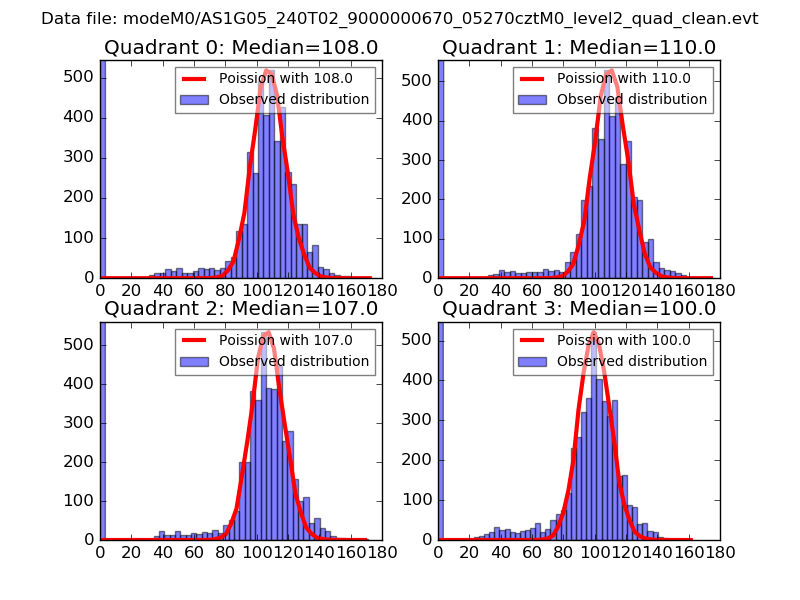 |
 |
| Quadrant-wise count rates Data is divided into 100 sec bins |
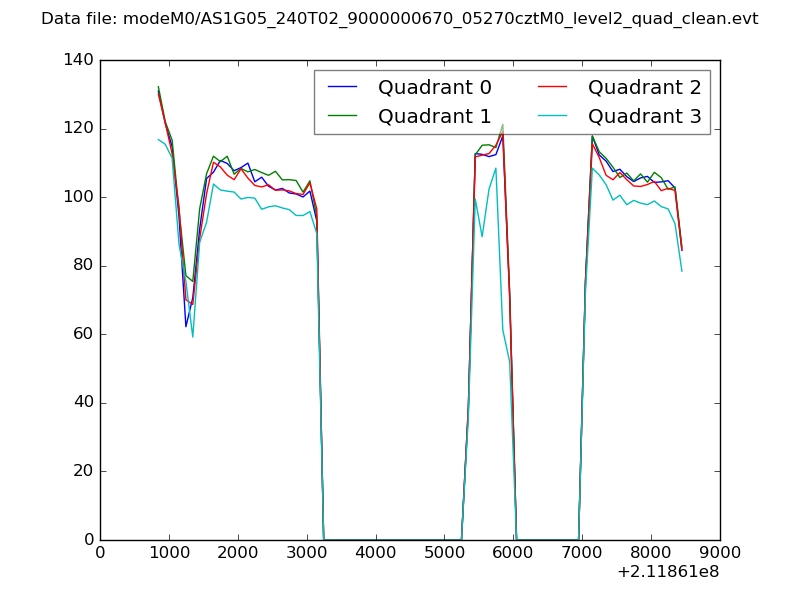 |
|
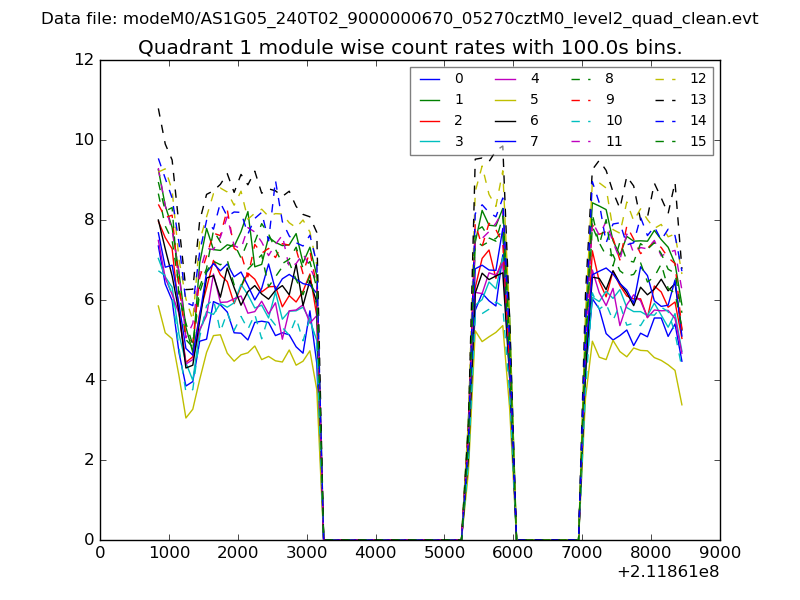
| Module-wise count rates for Quadrant A Data is divided into 100 sec bins |
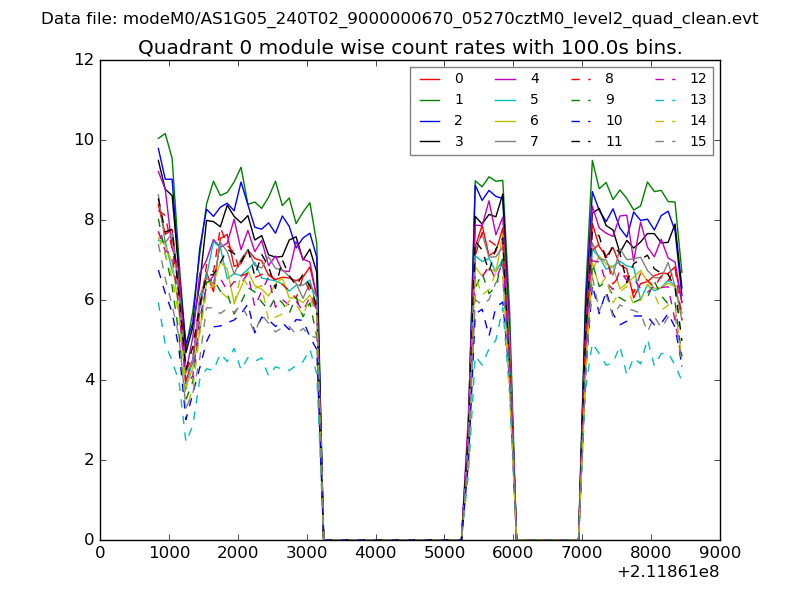 |
 |
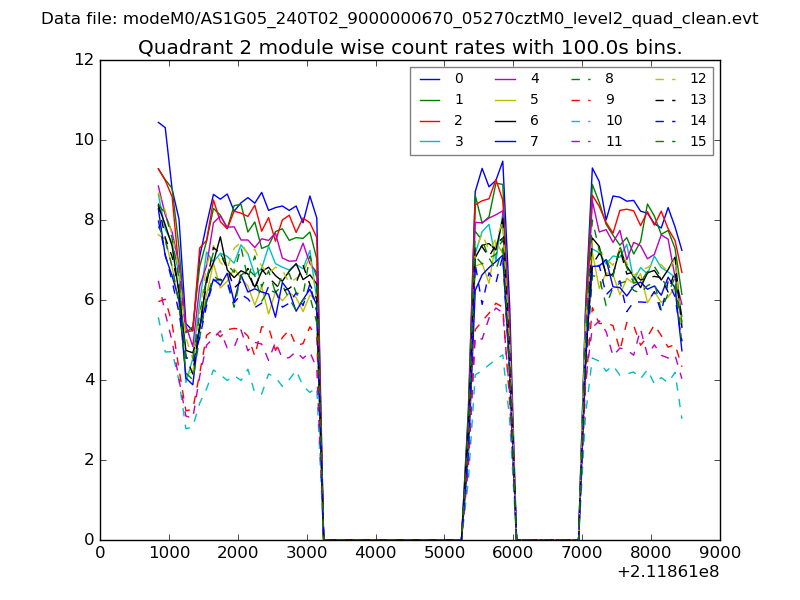
| Module-wise count rates for Quadrant B Data is divided into 100 sec bins |
 |
 |
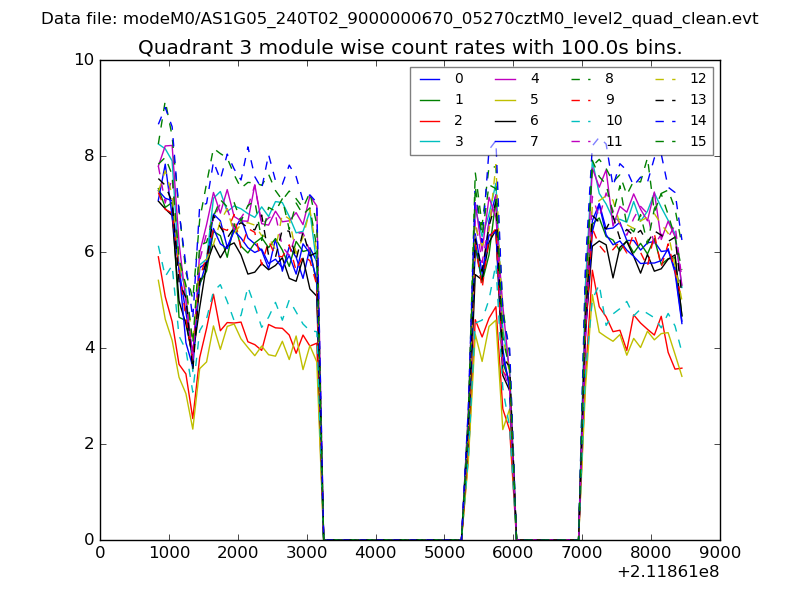
| Module-wise count rates for Quadrant C Data is divided into 100 sec bins |
 |
 |
| Module-wise count rates for Quadrant D Data is divided into 100 sec bins |
 |
 |
| Parameter | Plot |
|---|---|
| CZT HV Monitor | 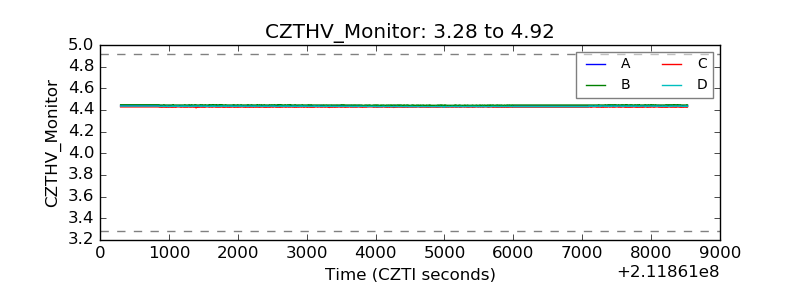 |
| D_VDD | 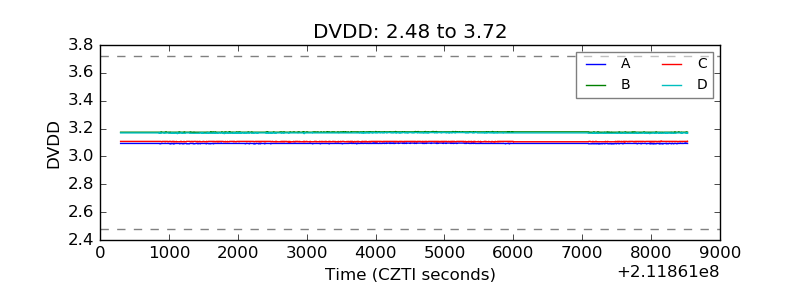 |
| Temperature 1 | 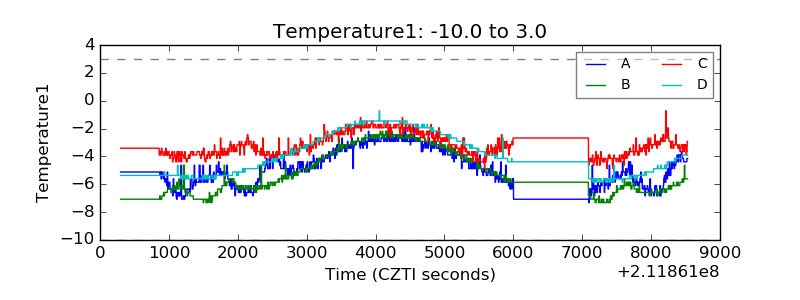 |
| Veto HV Monitor | 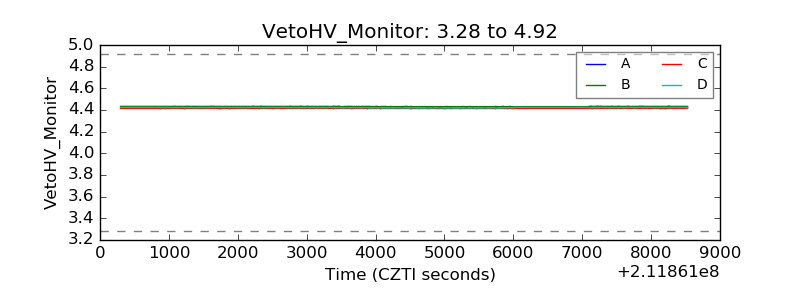 |
| Veto LLD | 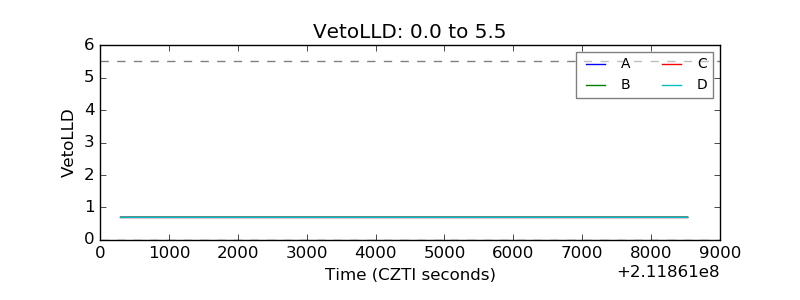 |
| Alpha Counter | 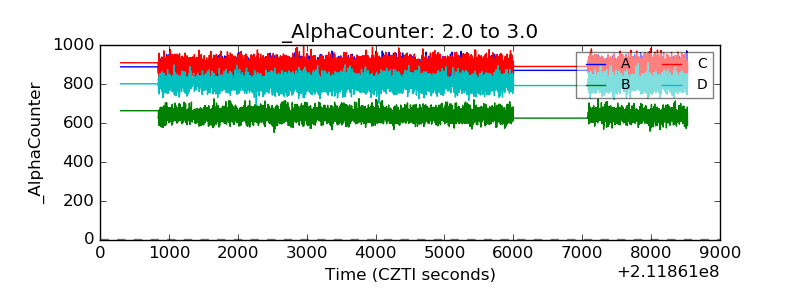 |
| _CPM_Rate | 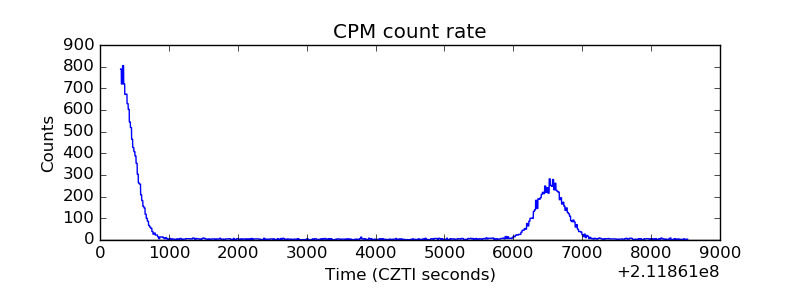 |
| CZT Counter | 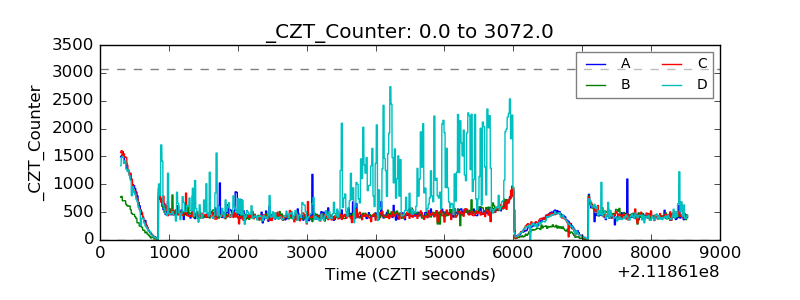 |
| +2.5 Volts monitor |  |
| +5 Volts monitor |  |
| _ROLL_ROT | 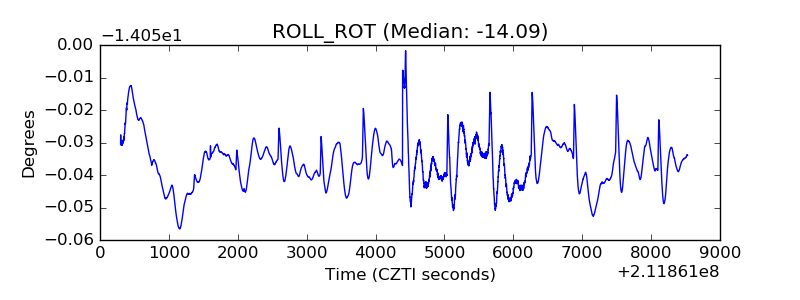 |
| _Roll_DEC | 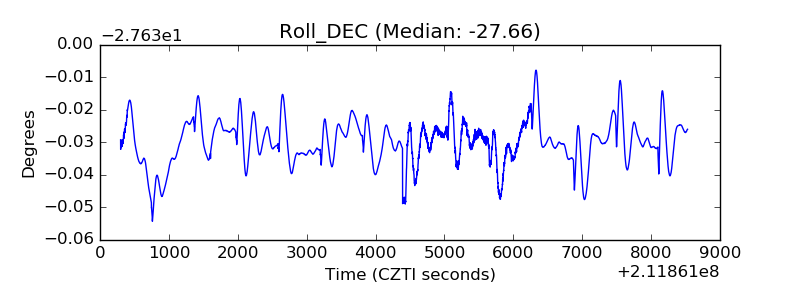 |
| _Roll_RA | 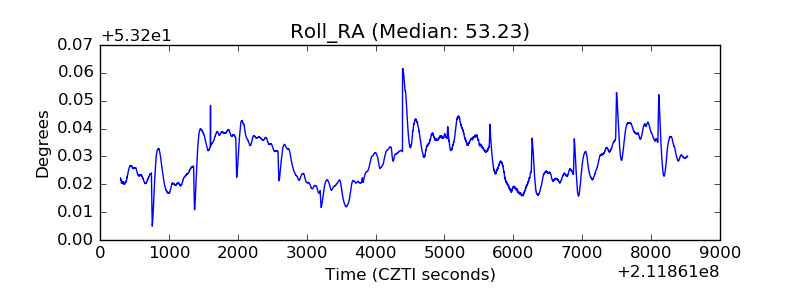 |
| Veto Counter | 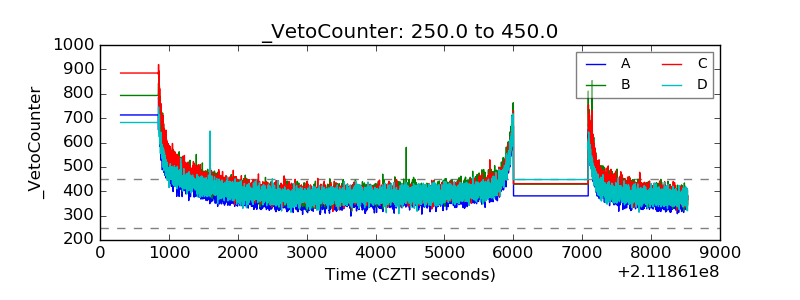 |