| Param | Original file | Final file |
|---|---|---|
| Filename | modeM0/AS1G05_240T02_9000000670_05271cztM0_level2.evt | modeM0/AS1G05_240T02_9000000670_05271cztM0_level2_quad_clean.evt |
| Size (bytes) | 512,124,480 | 84,496,320 |
| Size | 488.4 MB | 80.6 MB |
| Events in quadrant A | 3,274,632 | 525,245 |
| Events in quadrant B | 3,285,977 | 532,344 |
| Events in quadrant C | 3,218,520 | 520,137 |
| Events in quadrant D | 5,246,754 | 484,822 |
| Mode SS | |||
|---|---|---|---|
| Quadrant | BADHDUFLAG | Total packets | Discarded packets |
| A | 0 | 144 | 0 |
| B | 0 | 144 | 0 |
| C | 0 | 144 | 0 |
| D | 0 | 144 | 0 |
| Mode M9 | |||
|---|---|---|---|
| Quadrant | BADHDUFLAG | Total packets | Discarded packets |
| A | 0 | 9 | 0 |
| B | 0 | 9 | 0 |
| C | 0 | 9 | 0 |
| D | 0 | 10 | 0 |
| Mode M0 | |||
|---|---|---|---|
| Quadrant | BADHDUFLAG | Total packets | Discarded packets |
| A | 0 | 14740 | 3 |
| B | 0 | 14598 | 2 |
| C | 0 | 14591 | 4 |
| D | 0 | 20526 | 2 |
| Quadrant | Total seconds | Saturated seconds | Saturation percentage |
|---|---|---|---|
| A | 7126 | 116 | 1.627842% |
| B | 7126 | 86 | 1.206848% |
| C | 7125 | 73 | 1.024561% |
| D | 7126 | 523 | 7.339321% |
Noise dominated data is calculated using 1-second bins in cleaned event files. If a bin has >2000 counts, and if more than 50% of those come from <1% of pixels, then it is considered to be noise-dominated and hence unusable.
| Quadrant | # 1 sec bins | Bins with >0 counts | Bins with >2000 counts | High rate bins dominated by noise | Noise dominated (total time) | Noise dominated (detector-on time) | Marked lightcurve |
|---|---|---|---|---|---|---|---|
| A | 7806 | 7126 | 7 | 7 | 0.09% | 0.10% | 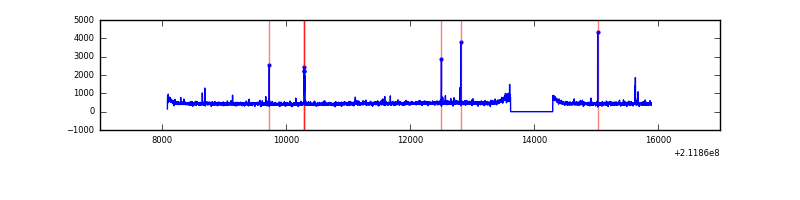 |
| B | 7806 | 7127 | 0 | 0 | 0.00% | 0.00% | 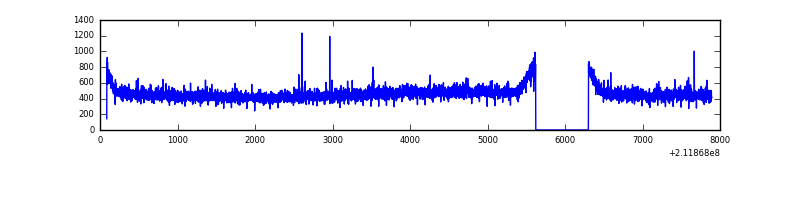 |
| C | 7806 | 7127 | 0 | 0 | 0.00% | 0.00% | 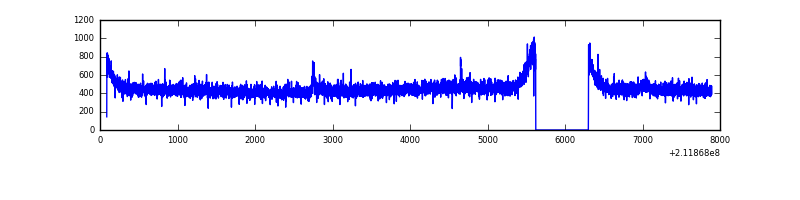 |
| D | 7806 | 7126 | 358 | 358 | 4.59% | 5.02% | 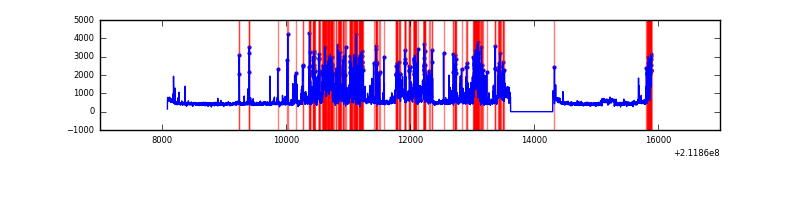 |
Top three noisy pixels from each quadrant. If the there are fewer than three noisy pixels in the level2.evt file, extra rows are filled as -1
| Pixel properties | Quadrant properties | ||||||
|---|---|---|---|---|---|---|---|
| Quadrant | DetID | PixID | Counts | Sigma | Mean | Median | Sigma |
| A | 0 | 50 | 37799 | 216.9 | 828 | 809 | 170.5 |
| A | 13 | 251 | 35881 | 205.66 | 828 | 809 | 170.5 |
| A | 0 | 254 | 9505 | 50.99 | 828 | 809 | 170.5 |
| B | 12 | 111 | 15324 | 89.71 | 837 | 816 | 161.7 |
| B | 15 | 204 | 13586 | 78.96 | 837 | 816 | 161.7 |
| B | 8 | 3 | 12973 | 75.17 | 837 | 816 | 161.7 |
| C | 14 | 67 | 21407 | 108.32 | 815 | 816 | 190.1 |
| C | 8 | 222 | 12430 | 61.09 | 815 | 816 | 190.1 |
| C | 13 | 61 | 6440 | 29.58 | 815 | 816 | 190.1 |
| D | 11 | 145 | 1635543 | 8421.38 | 791 | 765 | 194.1 |
| D | 1 | 31 | 295642 | 1519.03 | 791 | 765 | 194.1 |
| D | 2 | 136 | 121919 | 624.11 | 791 | 765 | 194.1 |
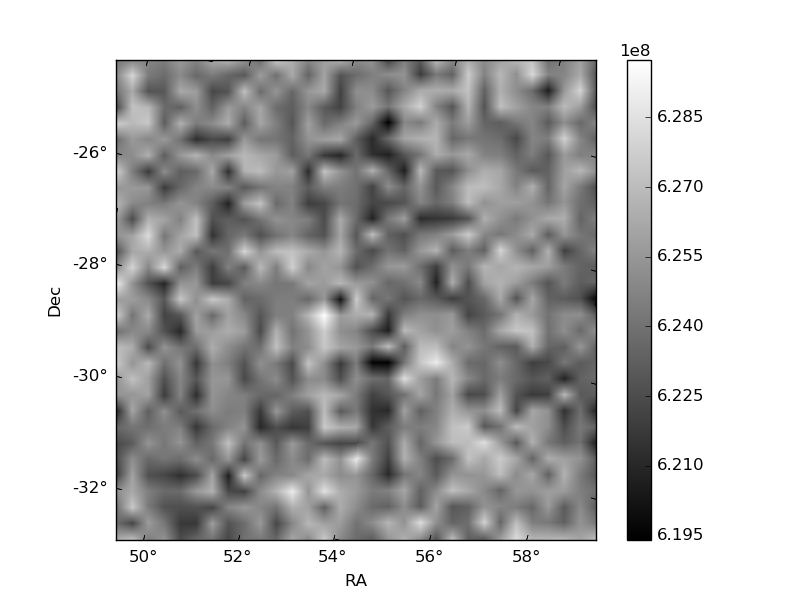
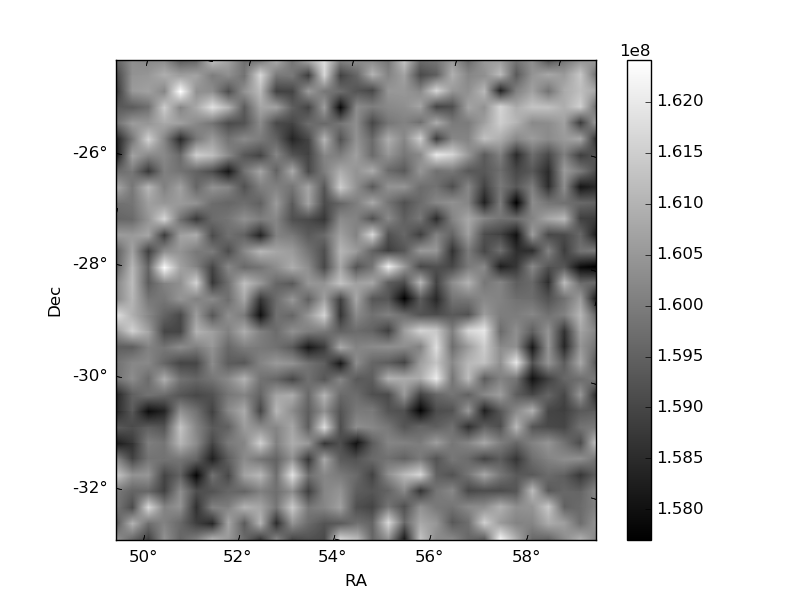
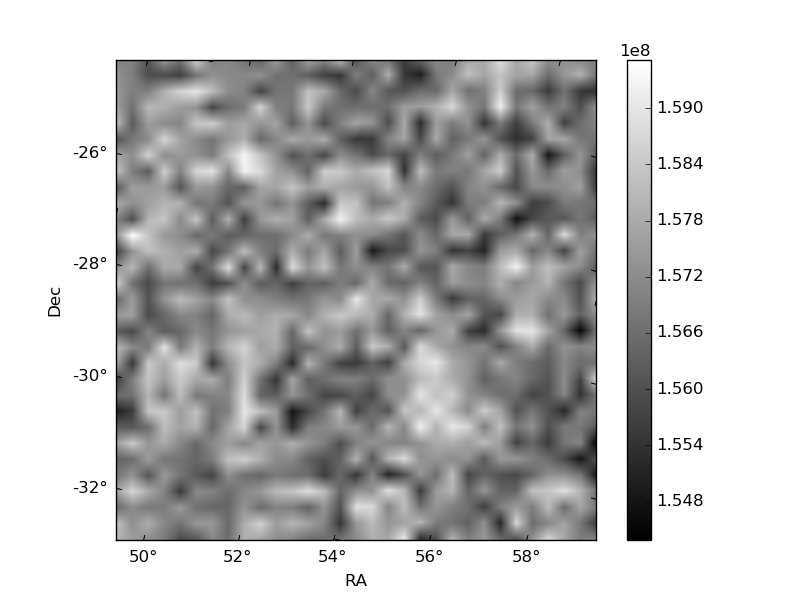
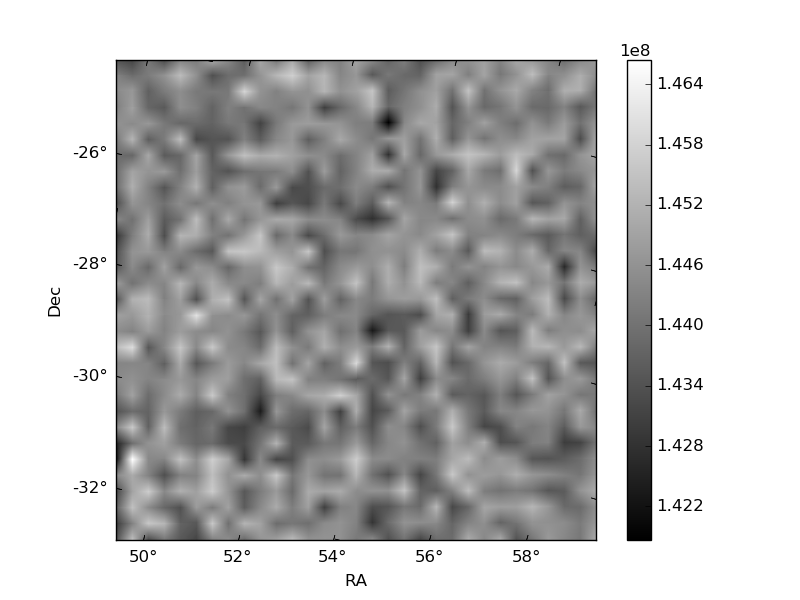
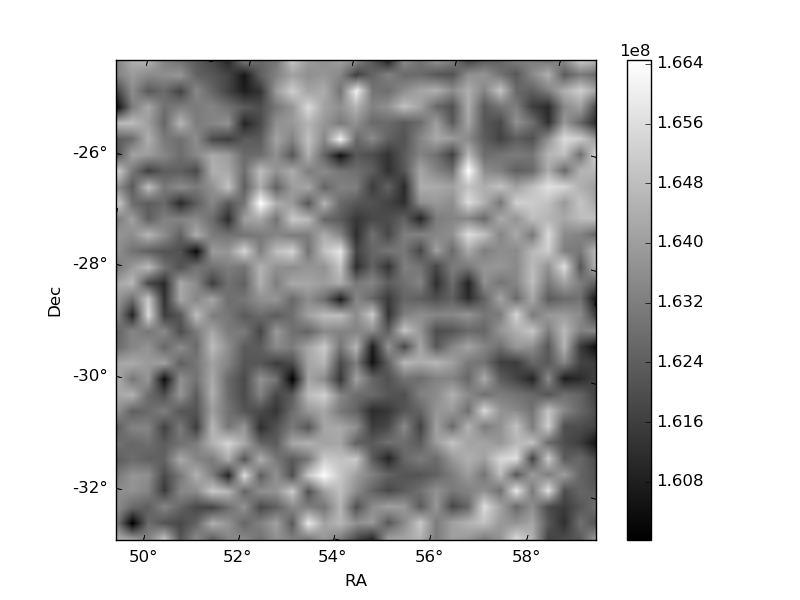
Histogram calculated using DETX and DETY for each event in the final _common_clean file
| Quadrant A | 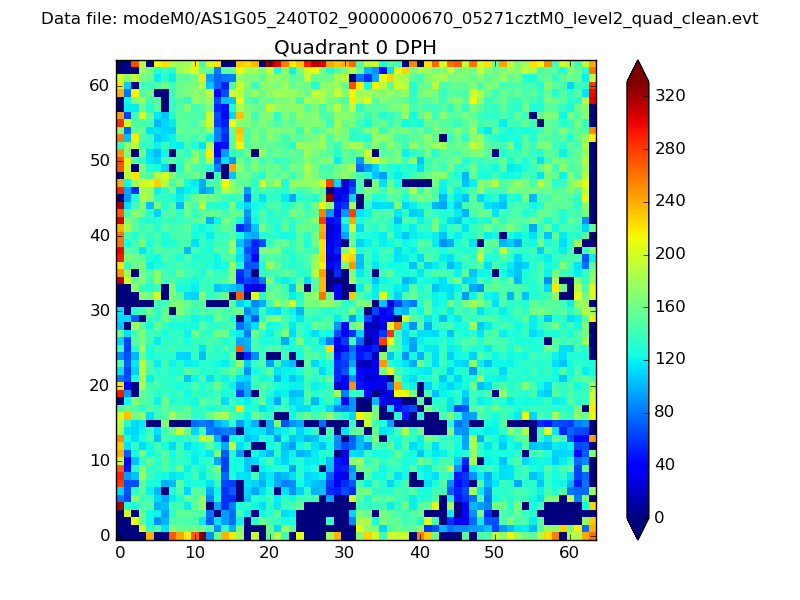 |
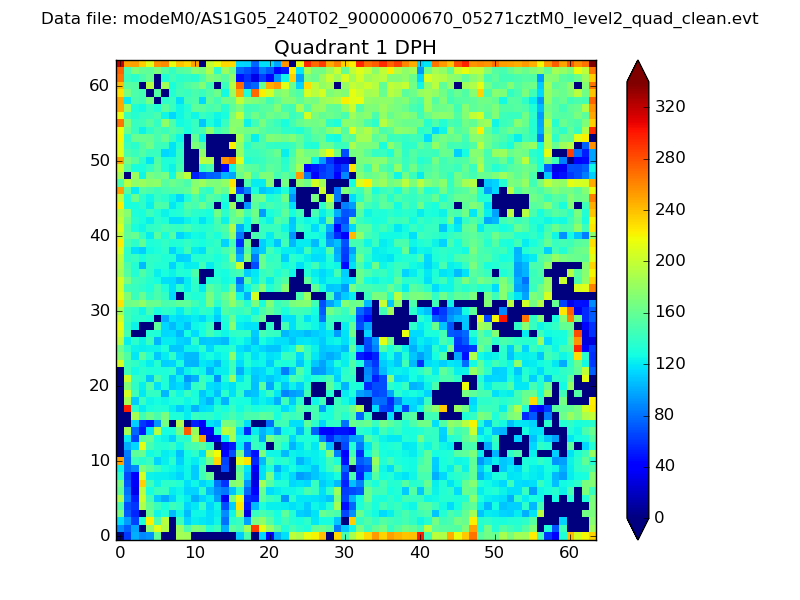 |
Quadrant B |
|---|---|---|---|
| Quadrant D | 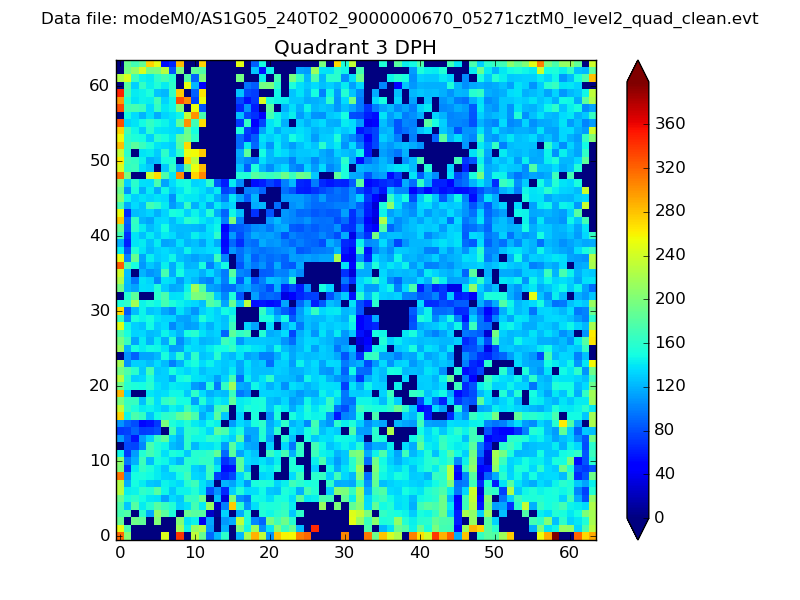 |
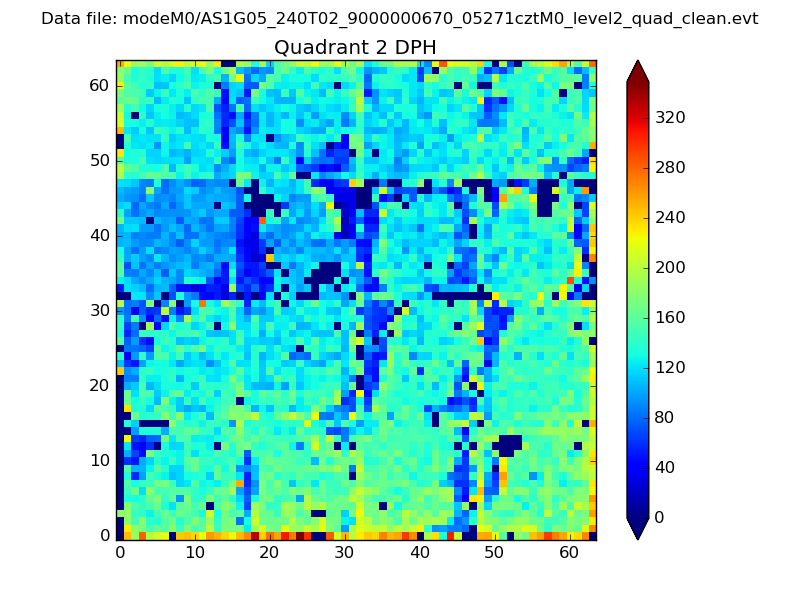 |
Quadrant C |
| Plot type | Count rate plots | Images |
|---|---|---|
| Comparison with Poisson distribution Blue bars denote a histogram of data divided into 1 sec bins. Red curve is a Poisson curve with rate = median count rate of data. |
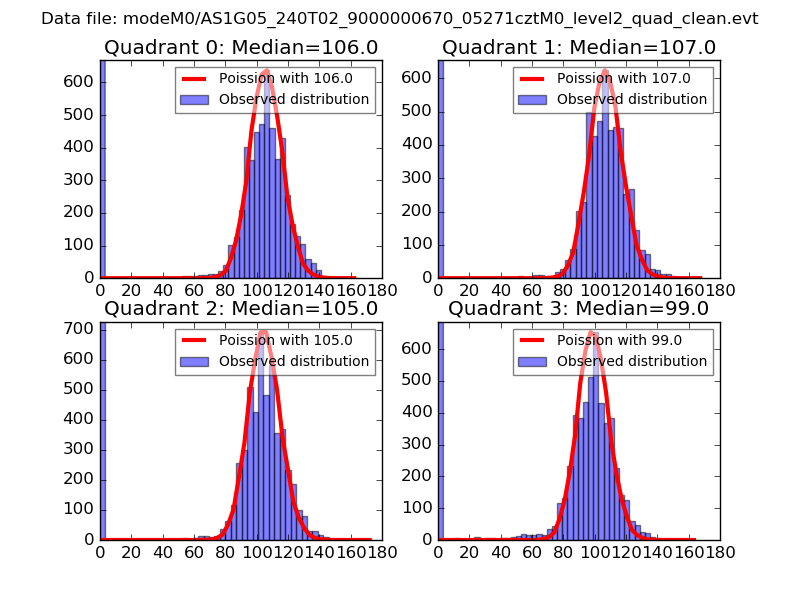 |
 |
| Quadrant-wise count rates Data is divided into 100 sec bins |
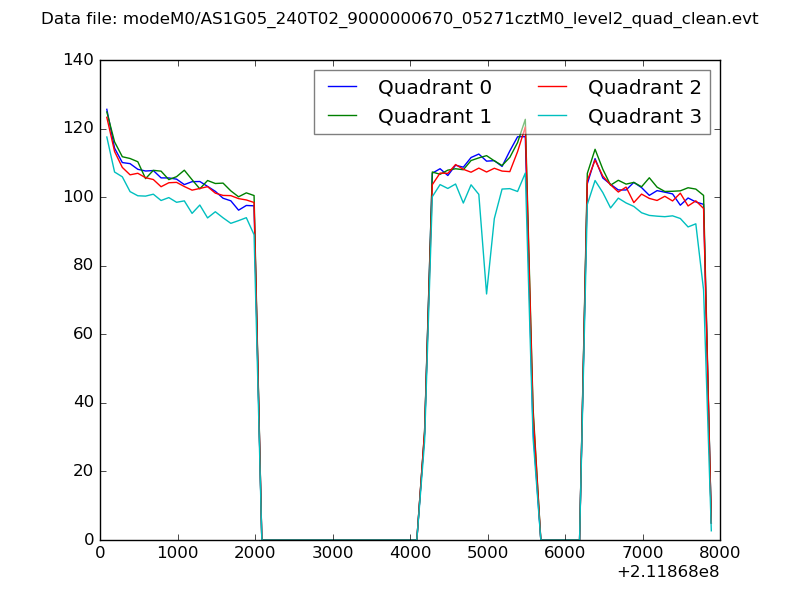 |
|
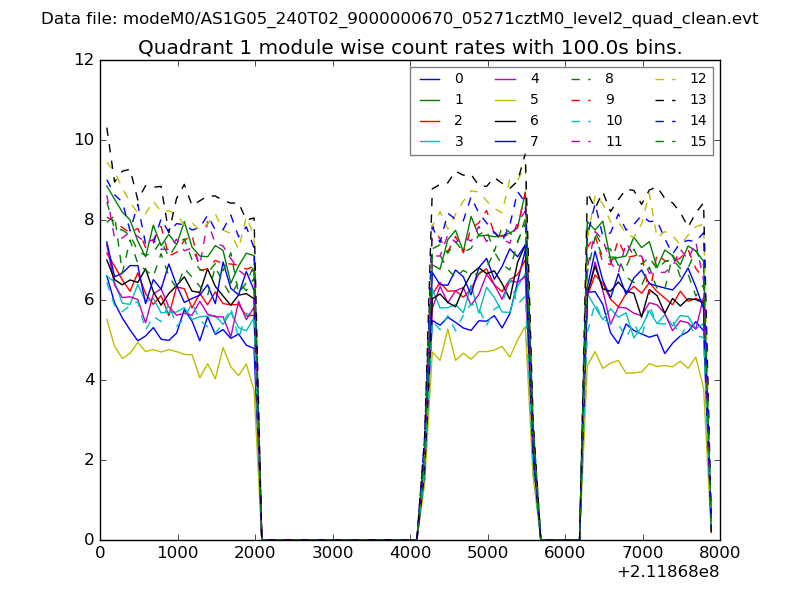
| Module-wise count rates for Quadrant A Data is divided into 100 sec bins |
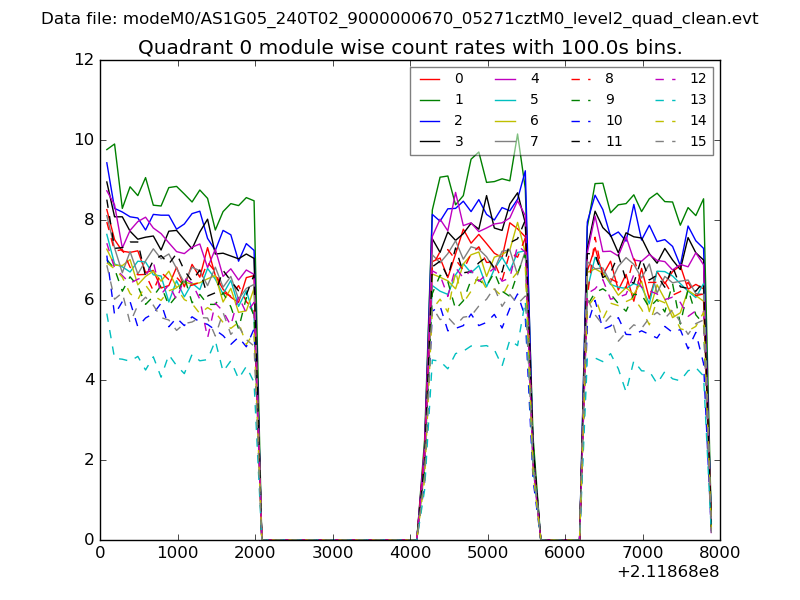 |
 |
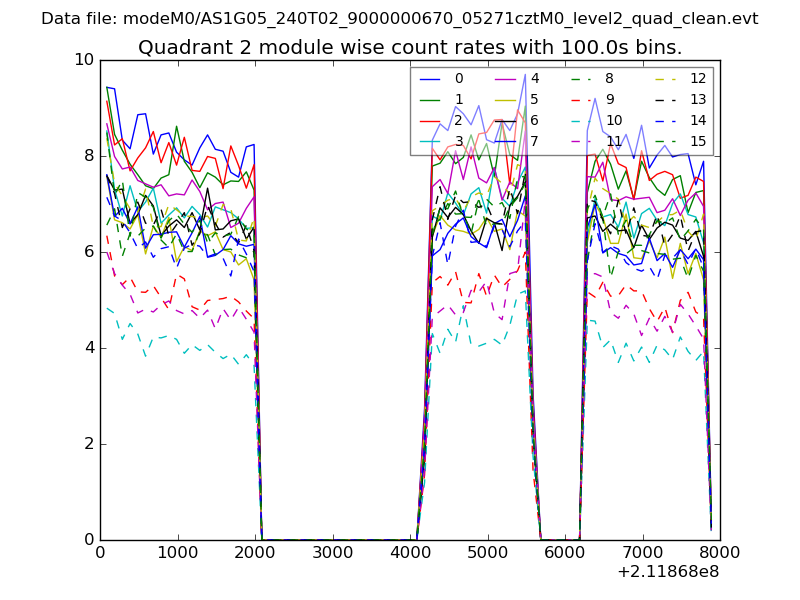
| Module-wise count rates for Quadrant B Data is divided into 100 sec bins |
 |
 |
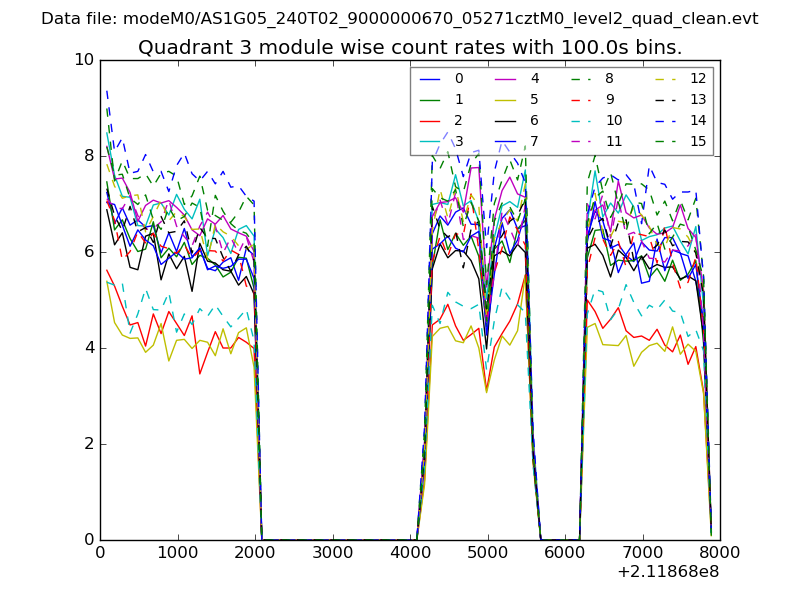
| Module-wise count rates for Quadrant C Data is divided into 100 sec bins |
 |
 |
| Module-wise count rates for Quadrant D Data is divided into 100 sec bins |
 |
 |
| Parameter | Plot |
|---|---|
| CZT HV Monitor | 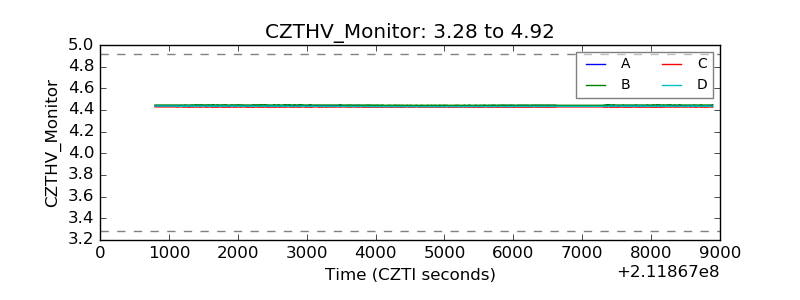 |
| D_VDD | 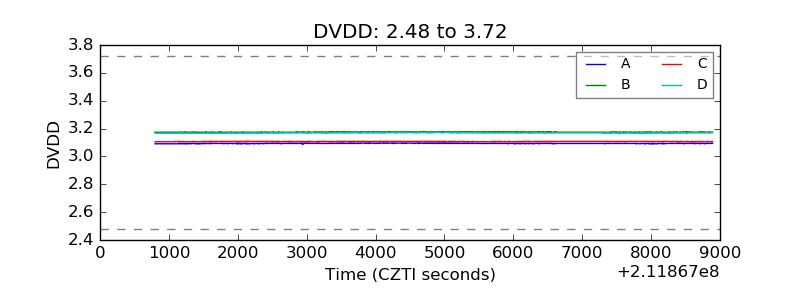 |
| Temperature 1 | 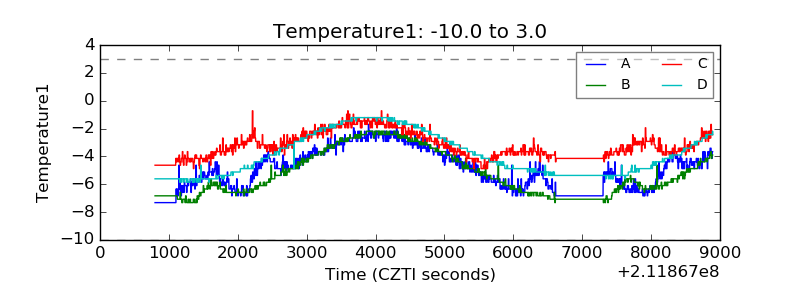 |
| Veto HV Monitor | 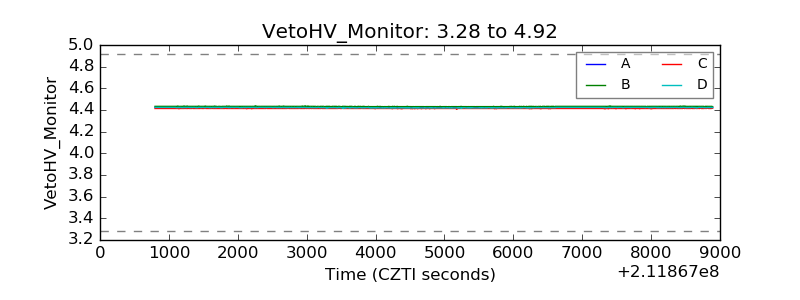 |
| Veto LLD | 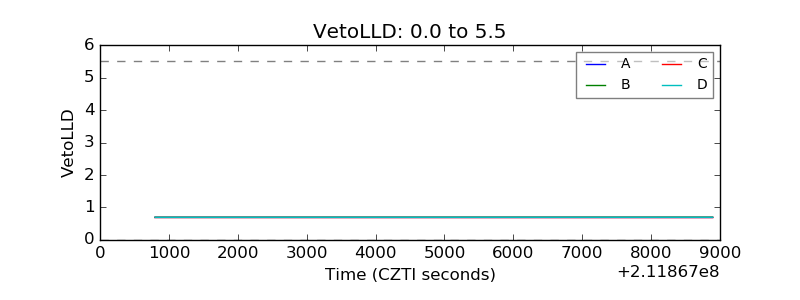 |
| Alpha Counter | 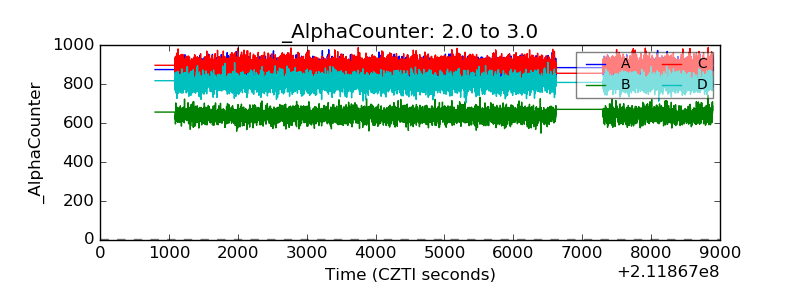 |
| _CPM_Rate | 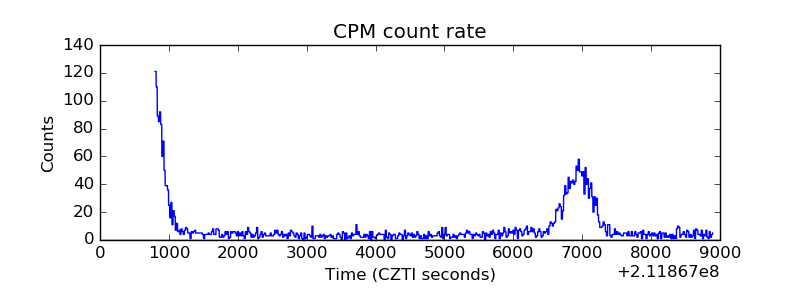 |
| CZT Counter | 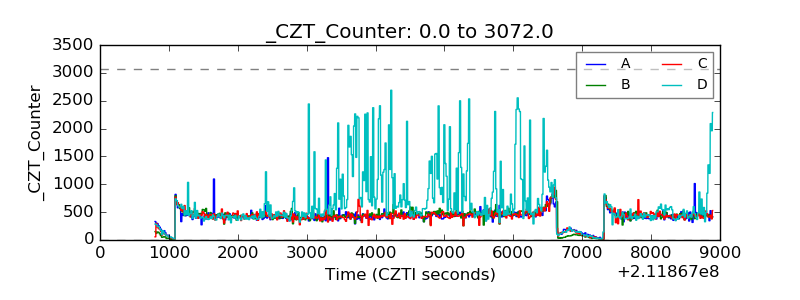 |
| +2.5 Volts monitor |  |
| +5 Volts monitor |  |
| _ROLL_ROT | 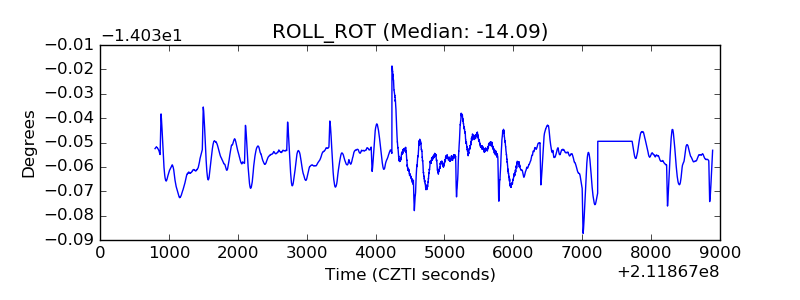 |
| _Roll_DEC | 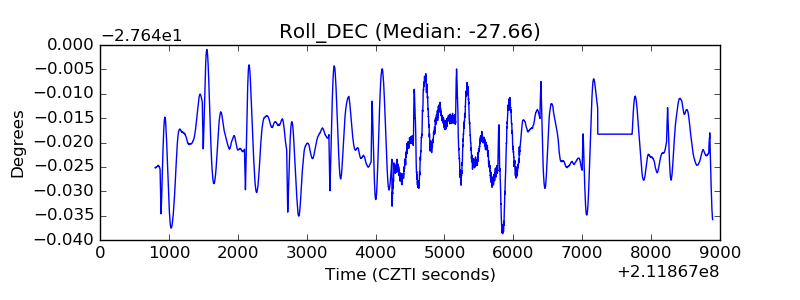 |
| _Roll_RA | 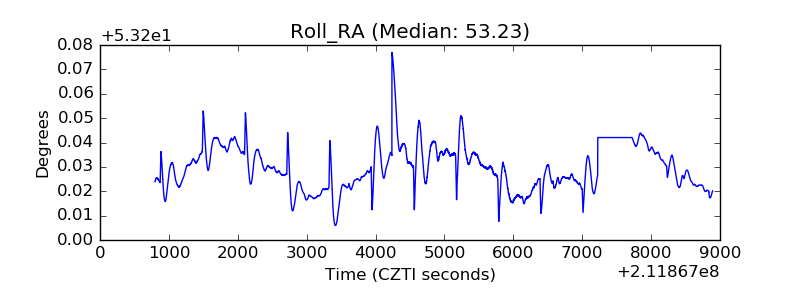 |
| Veto Counter | 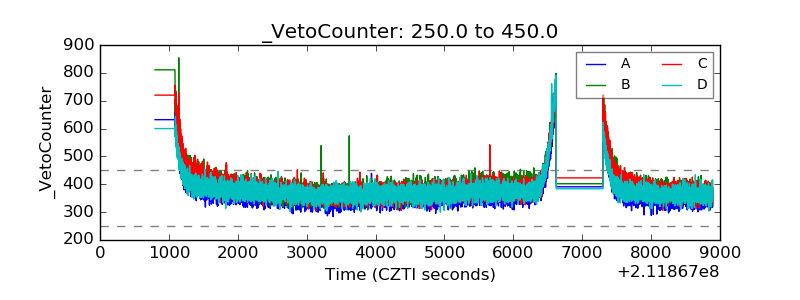 |