| Param | Original file | Final file |
|---|---|---|
| Filename | modeM0/AS1G05_240T02_9000000670_05272cztM0_level2.evt | modeM0/AS1G05_240T02_9000000670_05272cztM0_level2_quad_clean.evt |
| Size (bytes) | 587,453,760 | 76,190,400 |
| Size | 560.2 MB | 72.7 MB |
| Events in quadrant A | 3,492,154 | 472,848 |
| Events in quadrant B | 3,285,227 | 478,972 |
| Events in quadrant C | 3,180,426 | 468,890 |
| Events in quadrant D | 7,356,327 | 396,268 |
| Mode SS | |||
|---|---|---|---|
| Quadrant | BADHDUFLAG | Total packets | Discarded packets |
| A | 0 | 144 | 0 |
| B | 0 | 144 | 0 |
| C | 0 | 144 | 0 |
| D | 0 | 144 | 2 |
| Mode M9 | |||
|---|---|---|---|
| Quadrant | BADHDUFLAG | Total packets | Discarded packets |
| A | 0 | 3 | 0 |
| B | 0 | 3 | 0 |
| C | 0 | 3 | 0 |
| D | 0 | 3 | 0 |
| Mode M0 | |||
|---|---|---|---|
| Quadrant | BADHDUFLAG | Total packets | Discarded packets |
| A | 0 | 15438 | 180 |
| B | 0 | 14747 | 211 |
| C | 0 | 14674 | 178 |
| D | 0 | 27213 | 545 |
| Quadrant | Total seconds | Saturated seconds | Saturation percentage |
|---|---|---|---|
| A | 7043 | 175 | 2.484737% |
| B | 7026 | 168 | 2.391119% |
| C | 7046 | 120 | 1.703094% |
| D | 7004 | 1458 | 20.816676% |
Noise dominated data is calculated using 1-second bins in cleaned event files. If a bin has >2000 counts, and if more than 50% of those come from <1% of pixels, then it is considered to be noise-dominated and hence unusable.
| Quadrant | # 1 sec bins | Bins with >0 counts | Bins with >2000 counts | High rate bins dominated by noise | Noise dominated (total time) | Noise dominated (detector-on time) | Marked lightcurve |
|---|---|---|---|---|---|---|---|
| A | 7370 | 7125 | 9 | 9 | 0.12% | 0.13% | 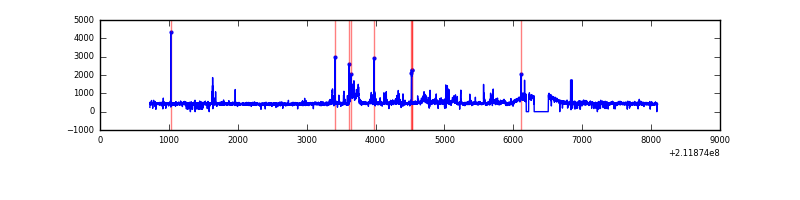 |
| B | 7370 | 7125 | 4 | 4 | 0.05% | 0.06% |  |
| C | 7370 | 7128 | 2 | 2 | 0.03% | 0.03% | 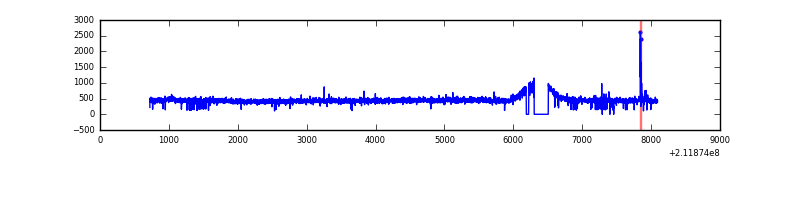 |
| D | 7369 | 7098 | 1136 | 1136 | 15.42% | 16.00% |  |
Top three noisy pixels from each quadrant. If the there are fewer than three noisy pixels in the level2.evt file, extra rows are filled as -1
| Pixel properties | Quadrant properties | ||||||
|---|---|---|---|---|---|---|---|
| Quadrant | DetID | PixID | Counts | Sigma | Mean | Median | Sigma |
| A | 0 | 254 | 224476 | 1339.57 | 815 | 795 | 167.0 |
| A | 13 | 251 | 100153 | 595.03 | 815 | 795 | 167.0 |
| A | 0 | 50 | 28536 | 166.13 | 815 | 795 | 167.0 |
| B | 0 | 199 | 30211 | 184.19 | 821 | 799 | 159.7 |
| B | 15 | 204 | 20547 | 123.67 | 821 | 799 | 159.7 |
| B | 4 | 80 | 17776 | 106.32 | 821 | 799 | 159.7 |
| C | 14 | 67 | 30306 | 156.44 | 801 | 803 | 188.6 |
| C | 12 | 4 | 26343 | 135.43 | 801 | 803 | 188.6 |
| C | 13 | 61 | 6474 | 30.07 | 801 | 803 | 188.6 |
| D | 11 | 145 | 3163263 | 17802.3 | 719 | 695 | 177.6 |
| D | 1 | 31 | 1142426 | 6426.88 | 719 | 695 | 177.6 |
| D | 2 | 136 | 199093 | 1116.8 | 719 | 695 | 177.6 |
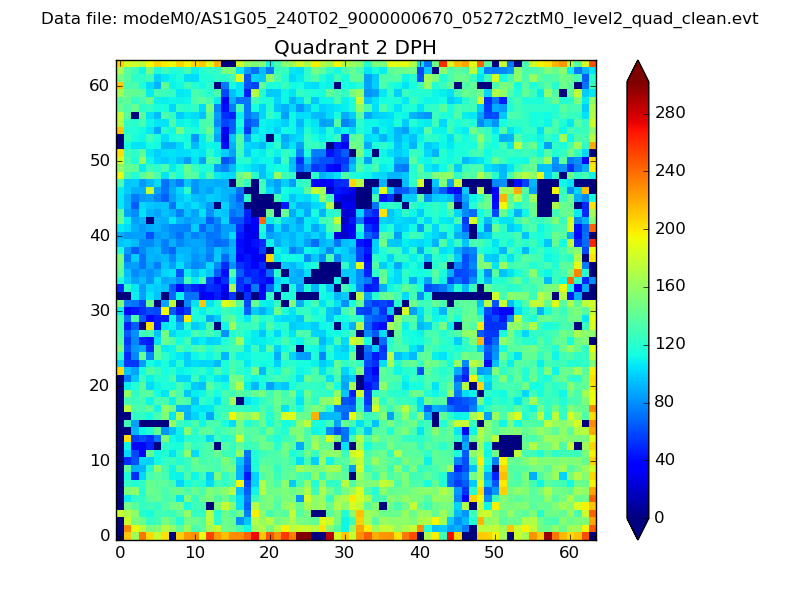
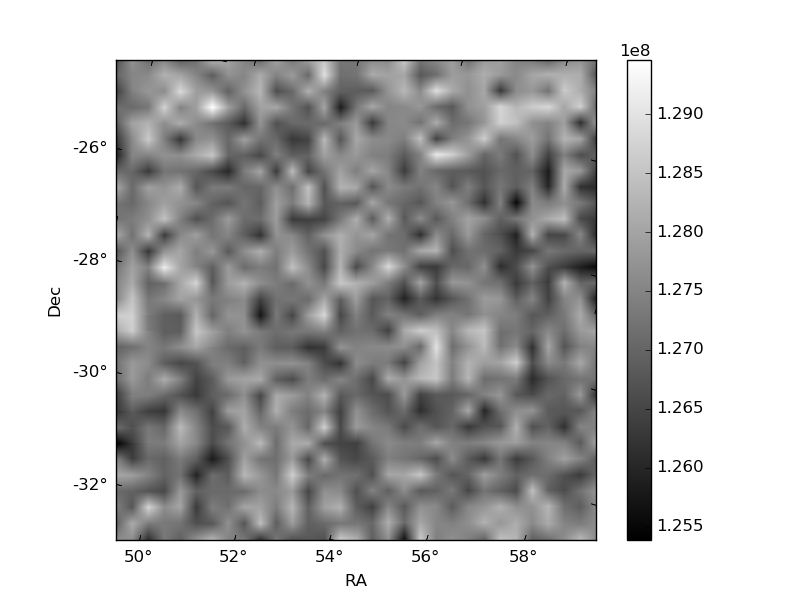
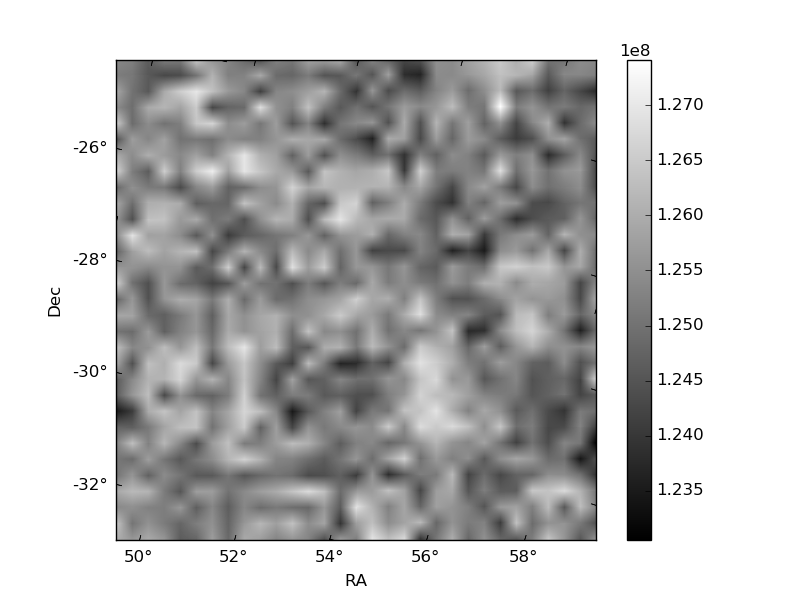
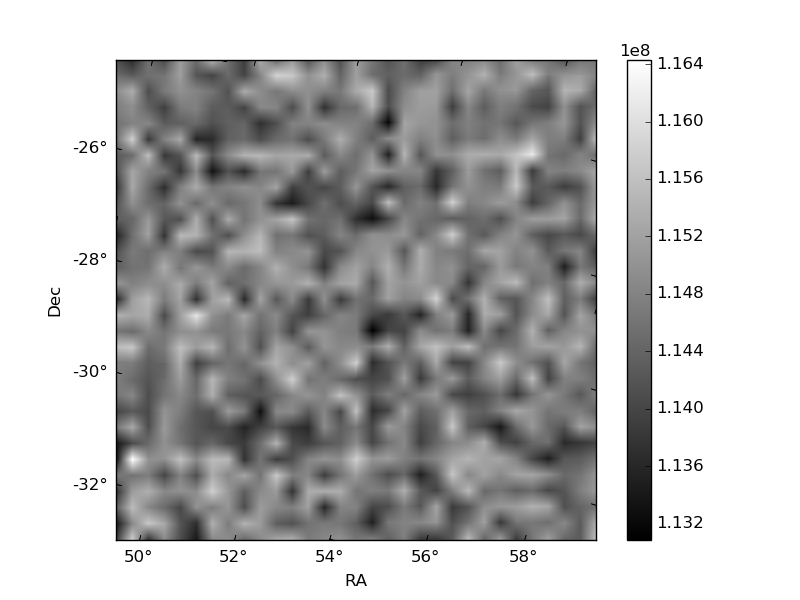
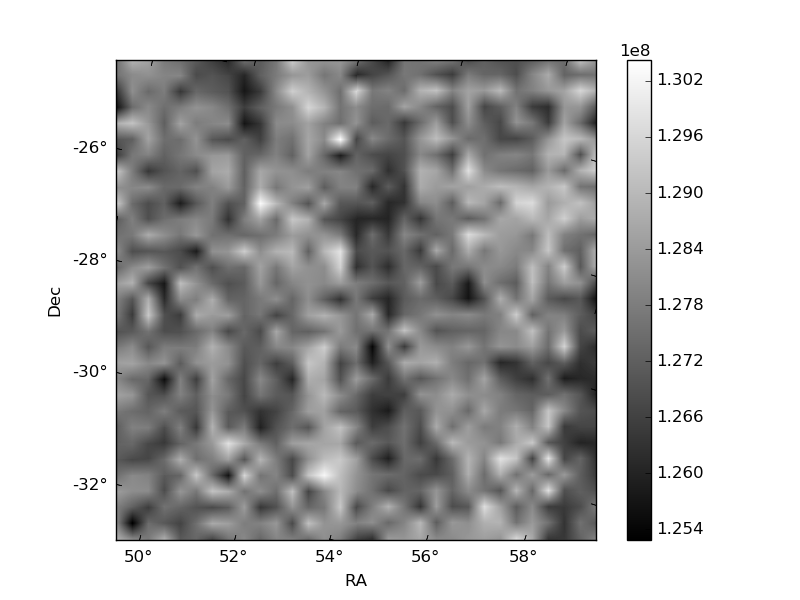
Histogram calculated using DETX and DETY for each event in the final _common_clean file
| Quadrant A | 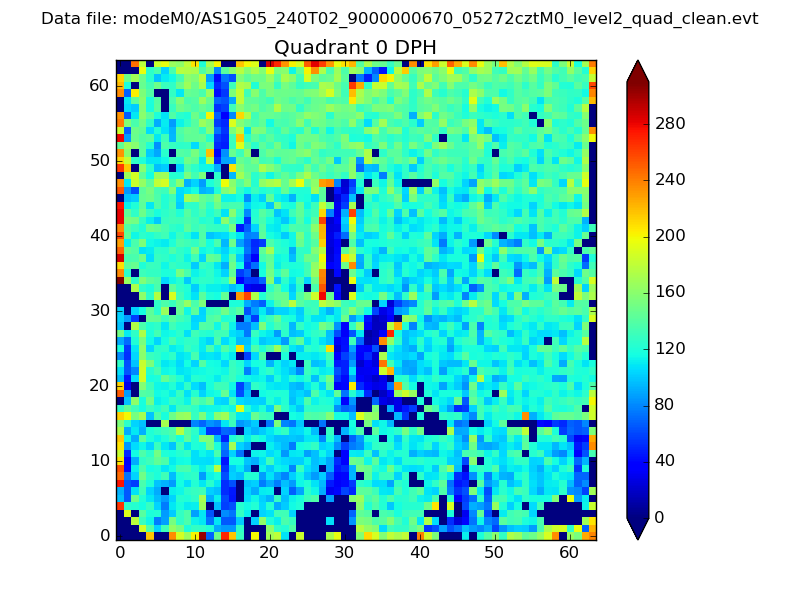 |
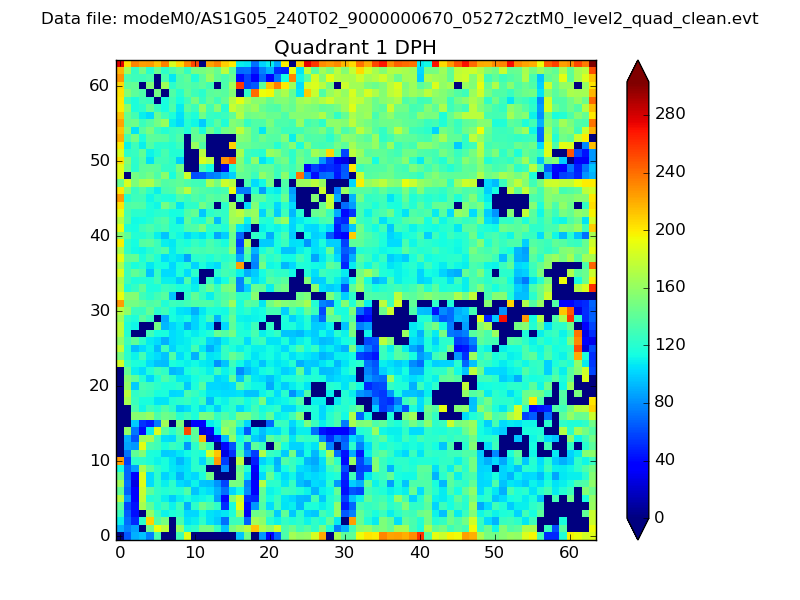 |
Quadrant B |
|---|---|---|---|
| Quadrant D | 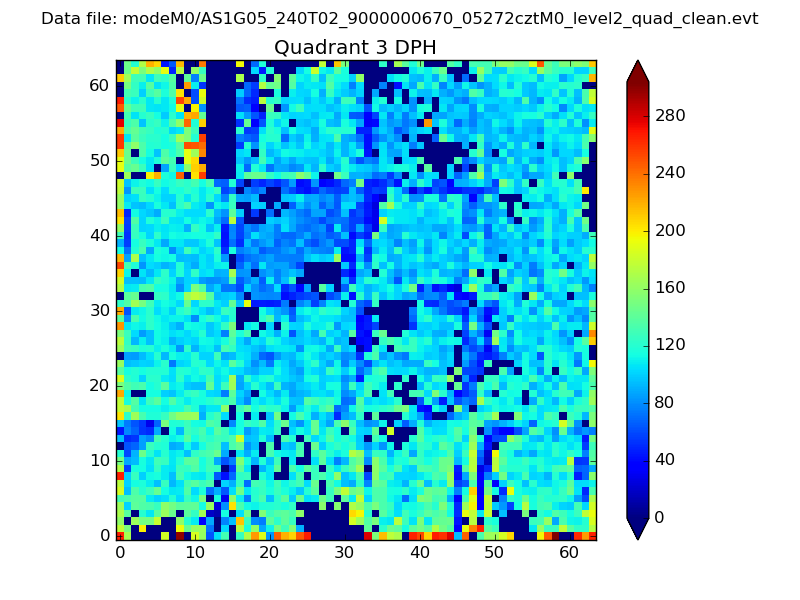 |
 |
Quadrant C |
| Plot type | Count rate plots | Images |
|---|---|---|
| Comparison with Poisson distribution Blue bars denote a histogram of data divided into 1 sec bins. Red curve is a Poisson curve with rate = median count rate of data. |
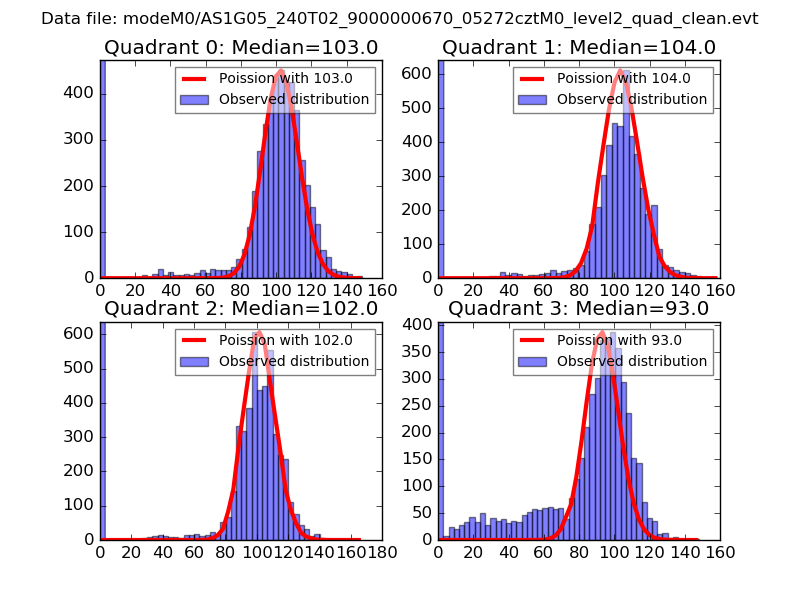 |
 |
| Quadrant-wise count rates Data is divided into 100 sec bins |
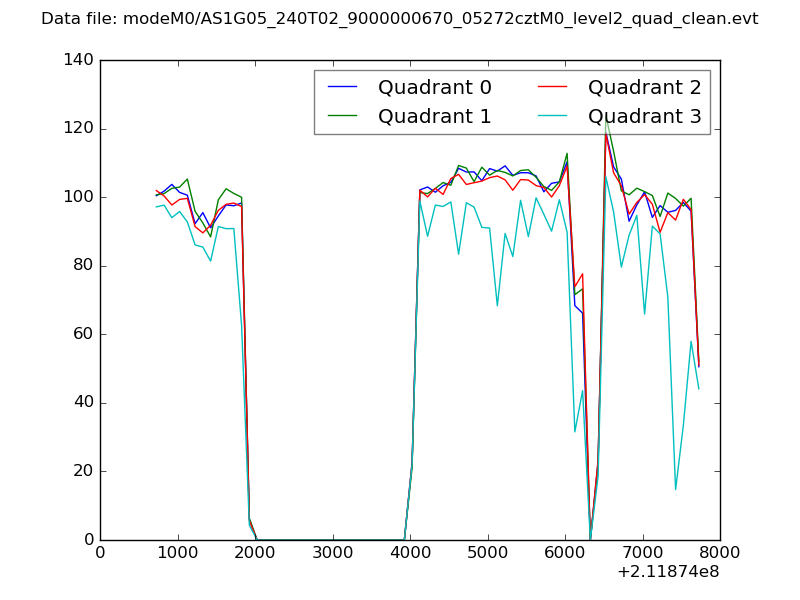 |
|
| Module-wise count rates for Quadrant A Data is divided into 100 sec bins |
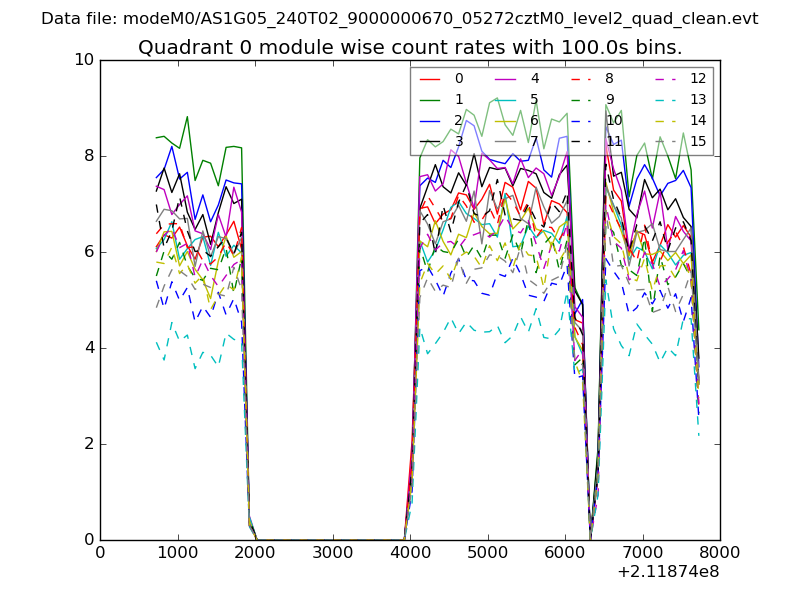 |
 |
| Module-wise count rates for Quadrant B Data is divided into 100 sec bins |
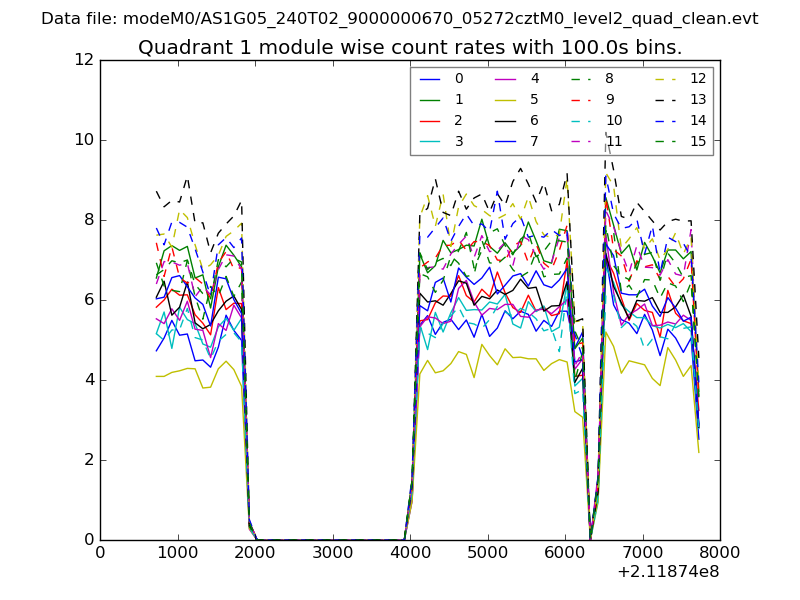 |
 |
| Module-wise count rates for Quadrant C Data is divided into 100 sec bins |
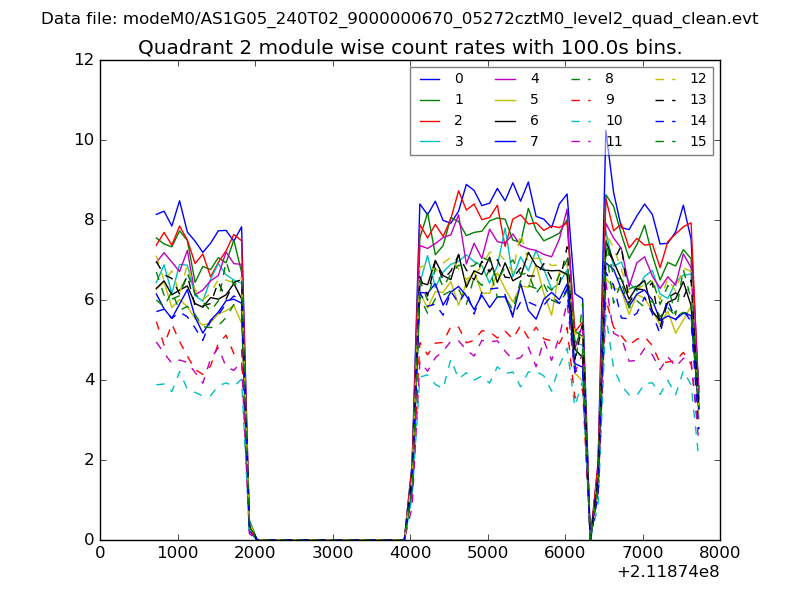 |
 |
| Module-wise count rates for Quadrant D Data is divided into 100 sec bins |
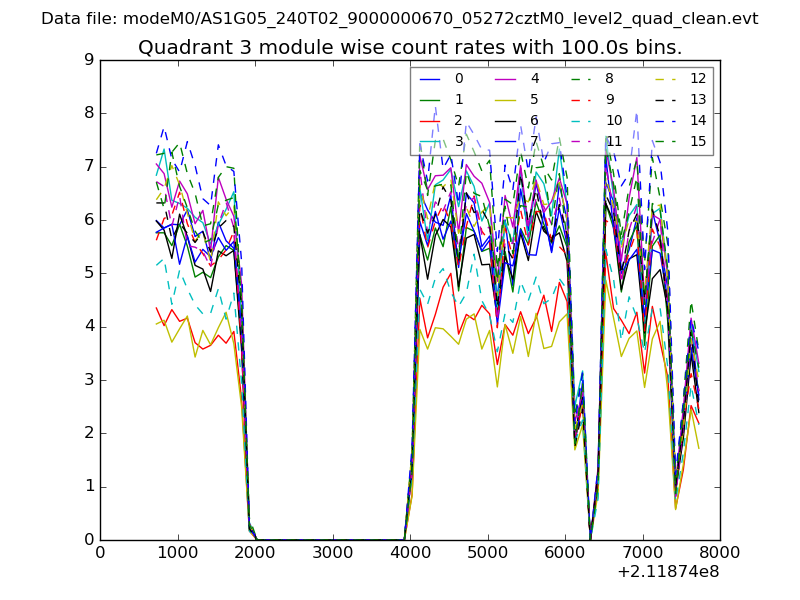 |
 |
| Parameter | Plot |
|---|---|
| CZT HV Monitor | 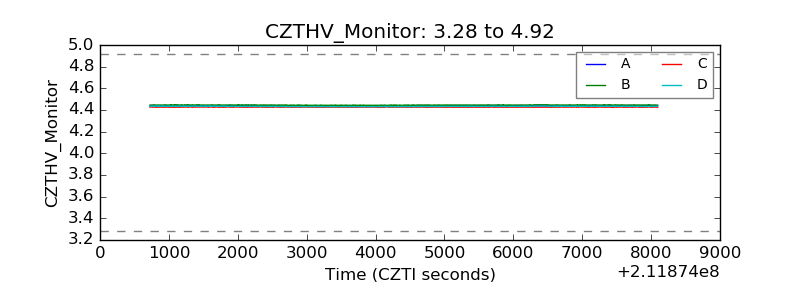 |
| D_VDD | 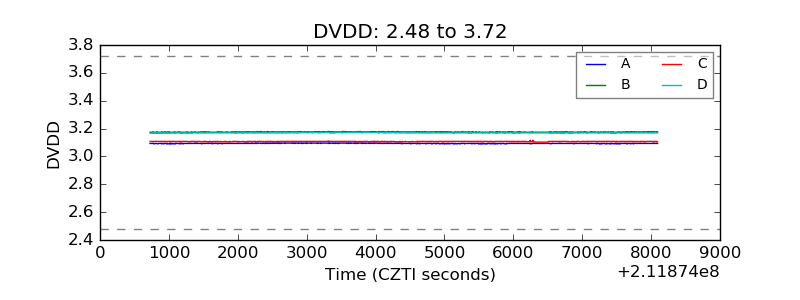 |
| Temperature 1 |  |
| Veto HV Monitor | 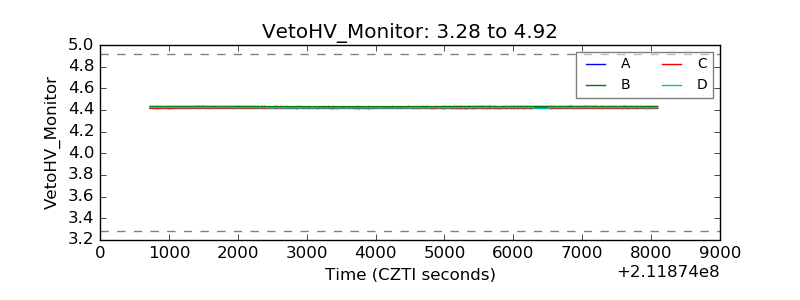 |
| Veto LLD | 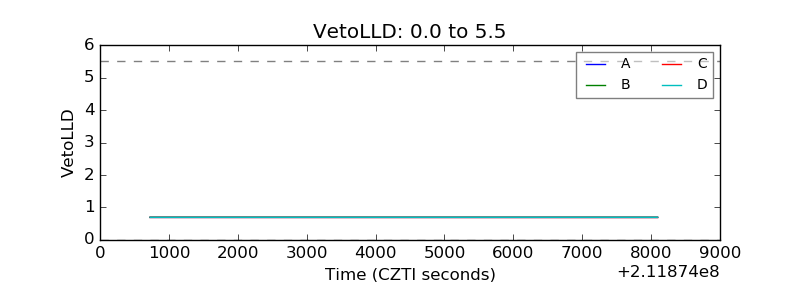 |
| Alpha Counter | 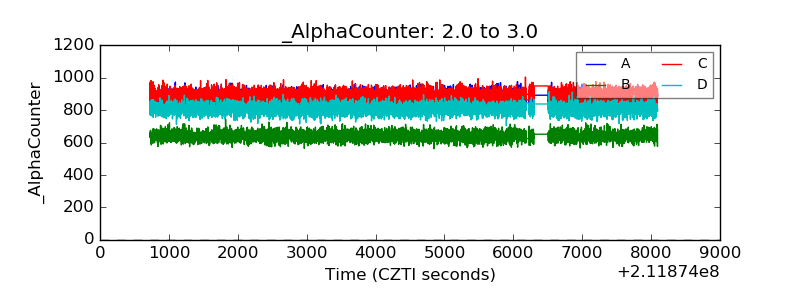 |
| _CPM_Rate | 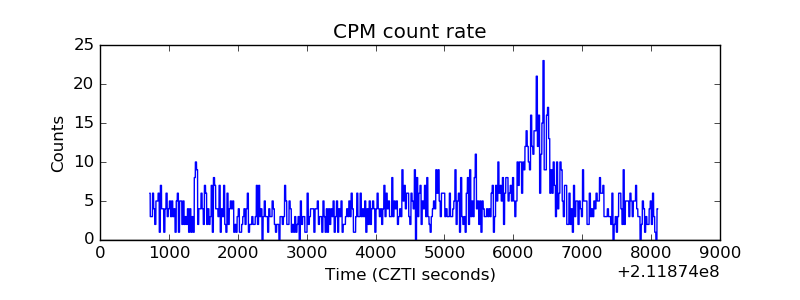 |
| CZT Counter | 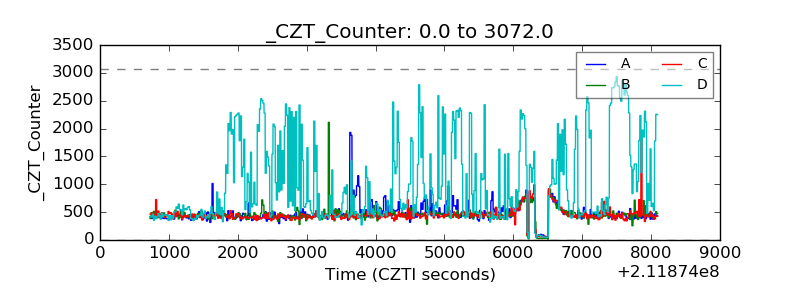 |
| +2.5 Volts monitor |  |
| +5 Volts monitor |  |
| _ROLL_ROT | 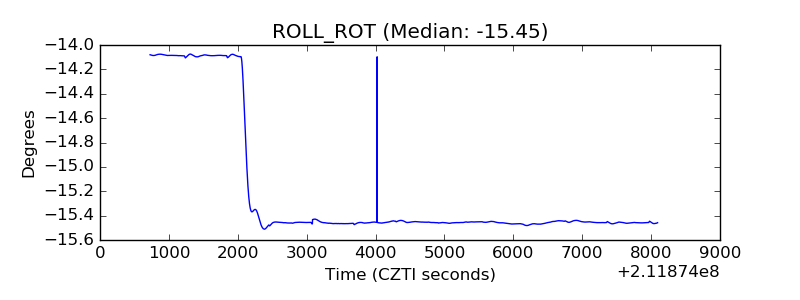 |
| _Roll_DEC | 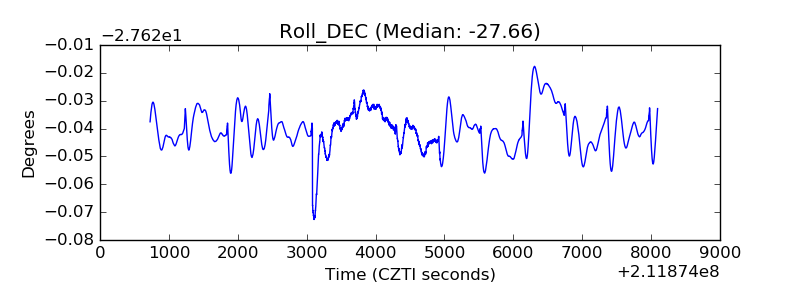 |
| _Roll_RA | 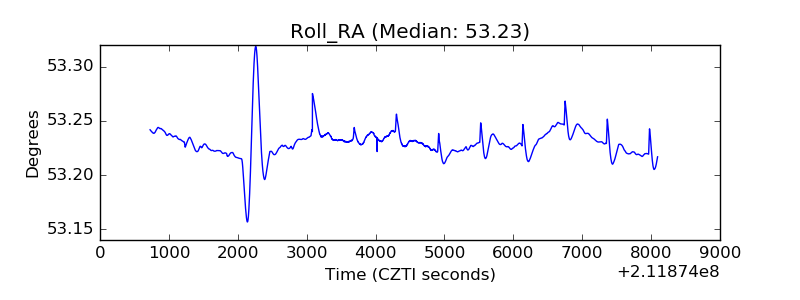 |
| Veto Counter | 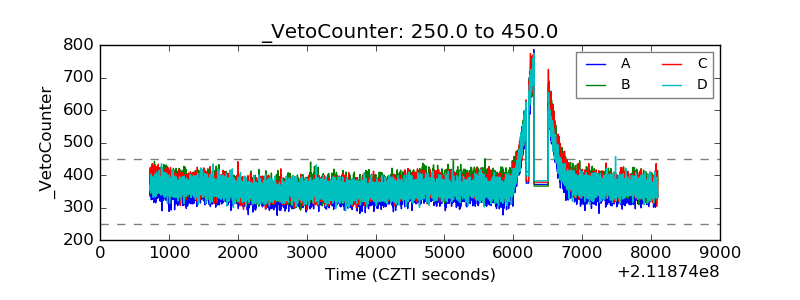 |