| Param | Original file | Final file |
|---|---|---|
| Filename | modeM0/AS1G05_240T02_9000000670_05277cztM0_level2.evt | modeM0/AS1G05_240T02_9000000670_05277cztM0_level2_quad_clean.evt |
| Size (bytes) | 1,611,711,360 | 212,016,960 |
| Size | 1.5 GB | 202.2 MB |
| Events in quadrant A | 9,830,637 | 1,299,865 |
| Events in quadrant B | 9,657,129 | 1,328,742 |
| Events in quadrant C | 9,171,702 | 1,285,056 |
| Events in quadrant D | 18,780,619 | 1,111,237 |
| Mode SS | |||
|---|---|---|---|
| Quadrant | BADHDUFLAG | Total packets | Discarded packets |
| A | 0 | 492 | 62 |
| B | 0 | 491 | 50 |
| C | 0 | 491 | 74 |
| D | 0 | 492 | 68 |
| Mode M9 | |||
|---|---|---|---|
| Quadrant | BADHDUFLAG | Total packets | Discarded packets |
| A | 0 | 14 | 3 |
| B | 0 | 14 | 4 |
| C | 0 | 13 | 3 |
| D | 0 | 14 | 2 |
| Mode M0 | |||
|---|---|---|---|
| Quadrant | BADHDUFLAG | Total packets | Discarded packets |
| A | 0 | 51780 | 8373 |
| B | 0 | 50861 | 8200 |
| C | 0 | 50192 | 7904 |
| D | 0 | 89578 | 20540 |
| Quadrant | Total seconds | Saturated seconds | Saturation percentage |
|---|---|---|---|
| A | 20460 | 431 | 2.106549% |
| B | 20485 | 408 | 1.991701% |
| C | 20473 | 253 | 1.235774% |
| D | 19213 | 3262 | 16.978088% |
Noise dominated data is calculated using 1-second bins in cleaned event files. If a bin has >2000 counts, and if more than 50% of those come from <1% of pixels, then it is considered to be noise-dominated and hence unusable.
| Quadrant | # 1 sec bins | Bins with >0 counts | Bins with >2000 counts | High rate bins dominated by noise | Noise dominated (total time) | Noise dominated (detector-on time) | Marked lightcurve |
|---|---|---|---|---|---|---|---|
| A | 25691 | 22532 | 30 | 30 | 0.12% | 0.13% |  |
| B | 25690 | 22539 | 15 | 15 | 0.06% | 0.07% | 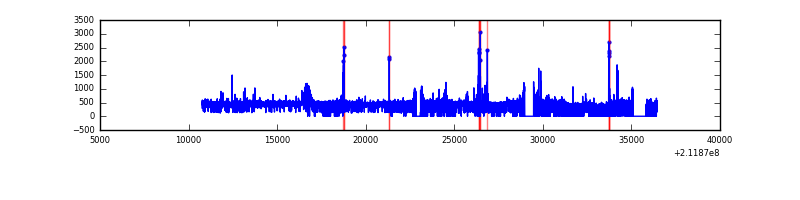 |
| C | 25691 | 22538 | 5 | 5 | 0.02% | 0.02% | 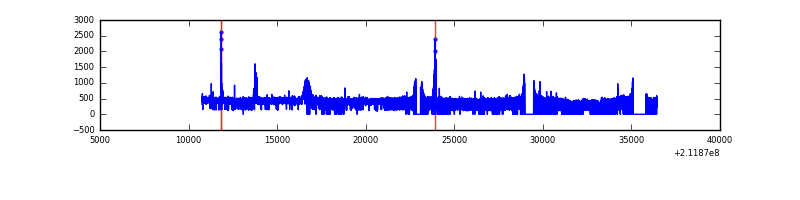 |
| D | 25691 | 21509 | 2539 | 2539 | 9.88% | 11.80% | 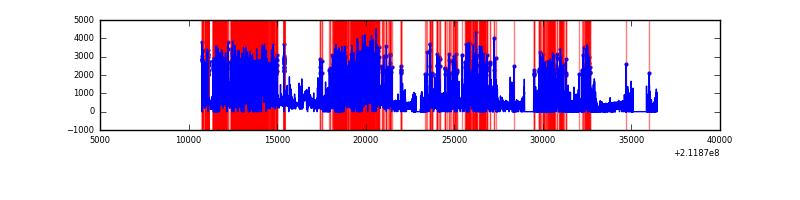 |
Top three noisy pixels from each quadrant. If the there are fewer than three noisy pixels in the level2.evt file, extra rows are filled as -1
| Pixel properties | Quadrant properties | ||||||
|---|---|---|---|---|---|---|---|
| Quadrant | DetID | PixID | Counts | Sigma | Mean | Median | Sigma |
| A | 13 | 251 | 450617 | 931.41 | 2355 | 2295 | 481.3 |
| A | 0 | 50 | 169428 | 347.23 | 2355 | 2295 | 481.3 |
| A | 11 | 116 | 130656 | 266.68 | 2355 | 2295 | 481.3 |
| B | 15 | 204 | 118679 | 252.15 | 2387 | 2324 | 461.4 |
| B | 4 | 48 | 86602 | 182.64 | 2387 | 2324 | 461.4 |
| B | 15 | 54 | 73361 | 153.94 | 2387 | 2324 | 461.4 |
| C | 1 | 3 | 64808 | 116.48 | 2309 | 2318 | 536.5 |
| C | 12 | 4 | 38157 | 66.8 | 2309 | 2318 | 536.5 |
| C | 8 | 222 | 25021 | 42.32 | 2309 | 2318 | 536.5 |
| D | 11 | 145 | 7283699 | 14586.66 | 2021 | 1955 | 499.2 |
| D | 1 | 31 | 2708810 | 5422.33 | 2021 | 1955 | 499.2 |
| D | 2 | 136 | 792383 | 1583.37 | 2021 | 1955 | 499.2 |
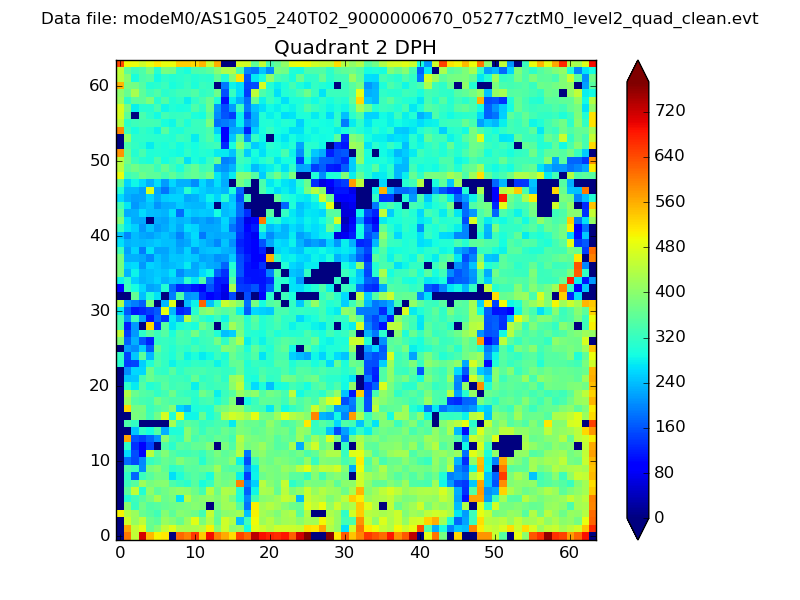
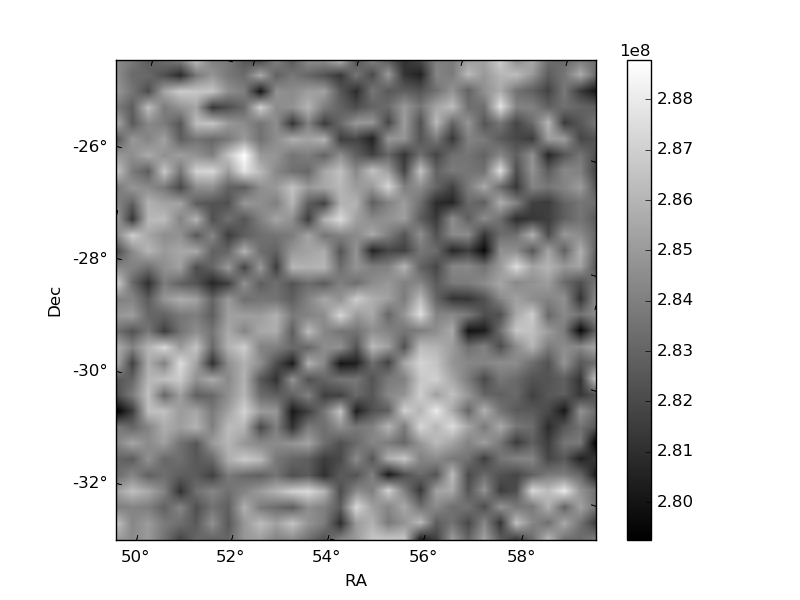
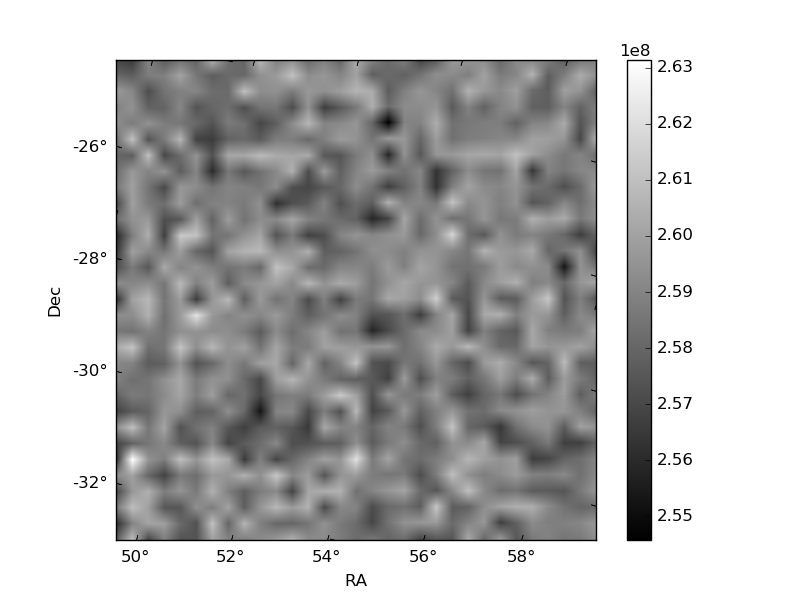
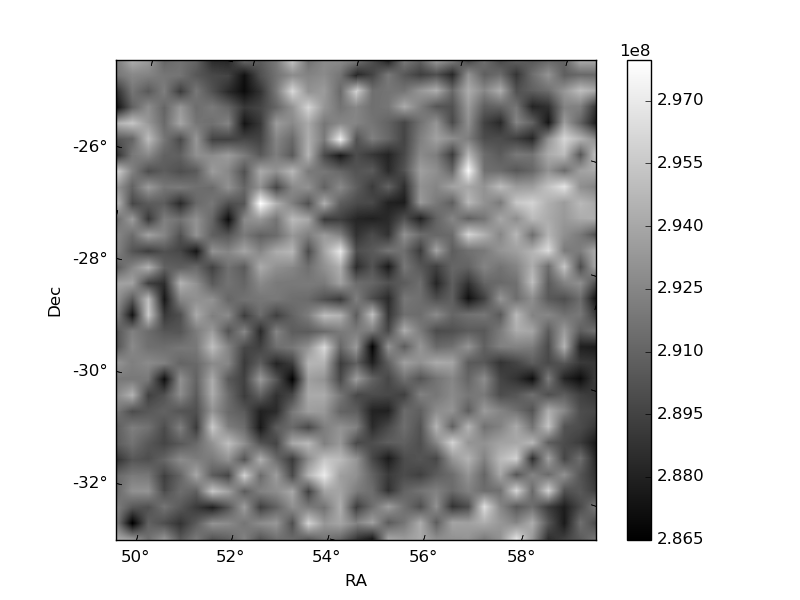
Histogram calculated using DETX and DETY for each event in the final _common_clean file
| Quadrant A |  |
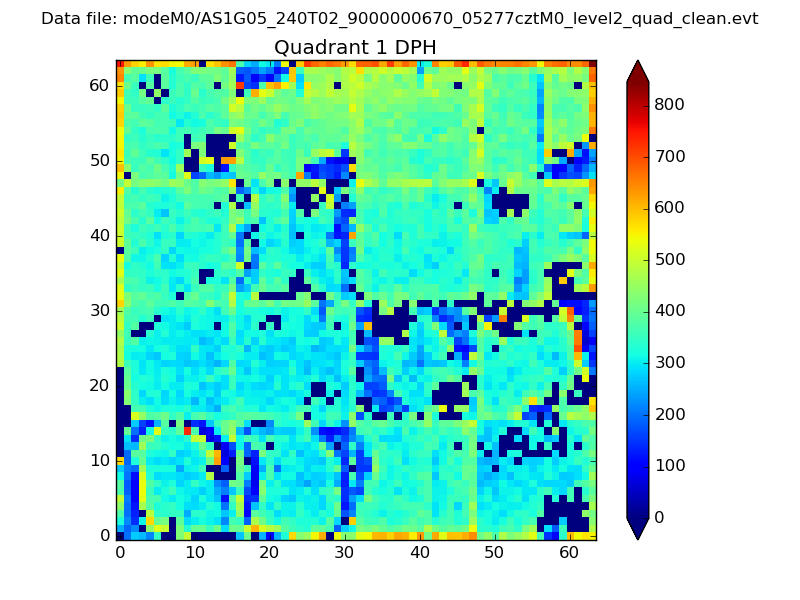 |
Quadrant B |
|---|---|---|---|
| Quadrant D | 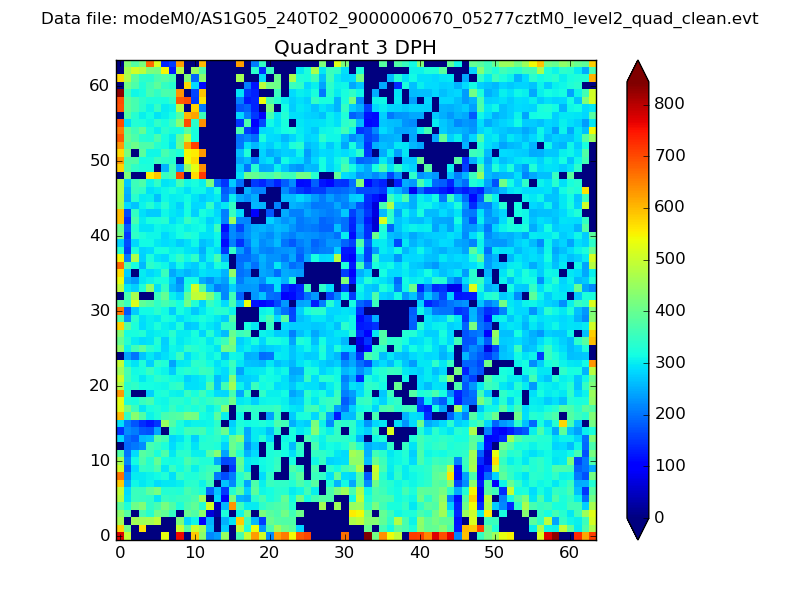 |
 |
Quadrant C |
| Plot type | Count rate plots | Images |
|---|---|---|
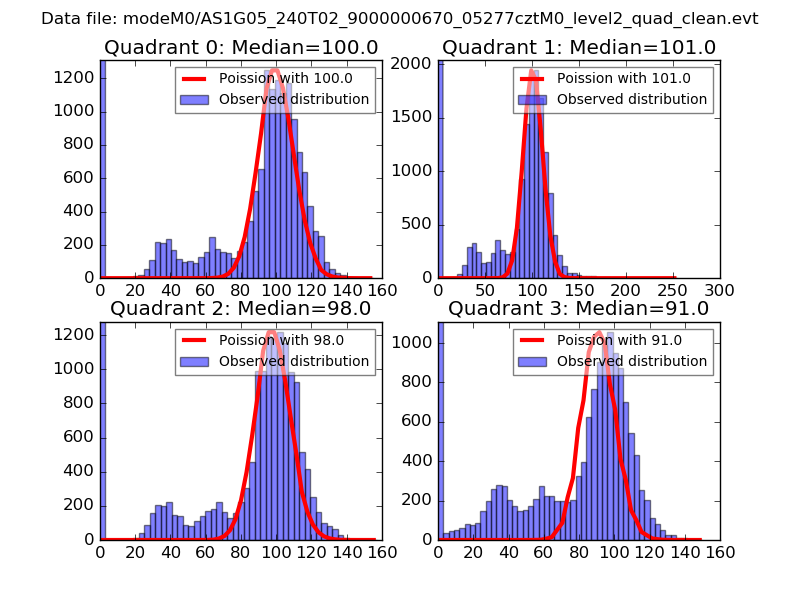
| Comparison with Poisson distribution Blue bars denote a histogram of data divided into 1 sec bins. Red curve is a Poisson curve with rate = median count rate of data. |
 |
 |
| Quadrant-wise count rates Data is divided into 100 sec bins |
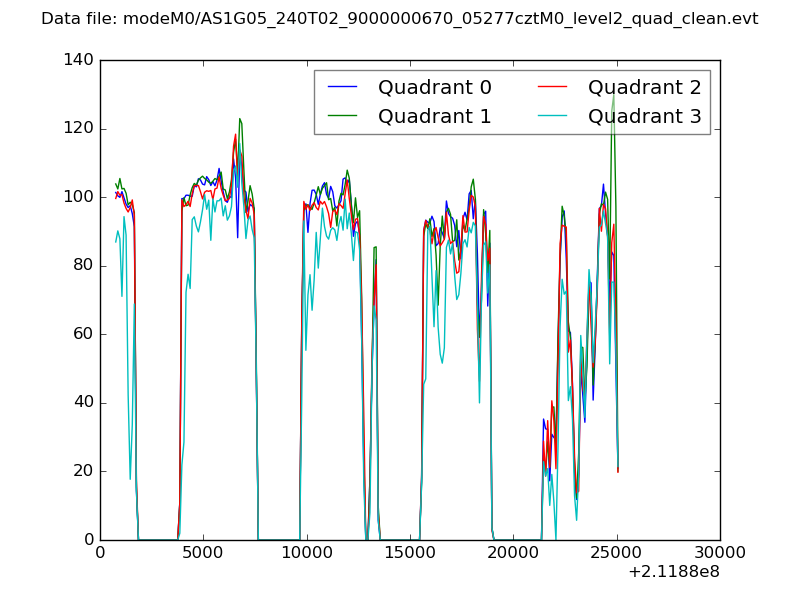 |
|
| Module-wise count rates for Quadrant A Data is divided into 100 sec bins |
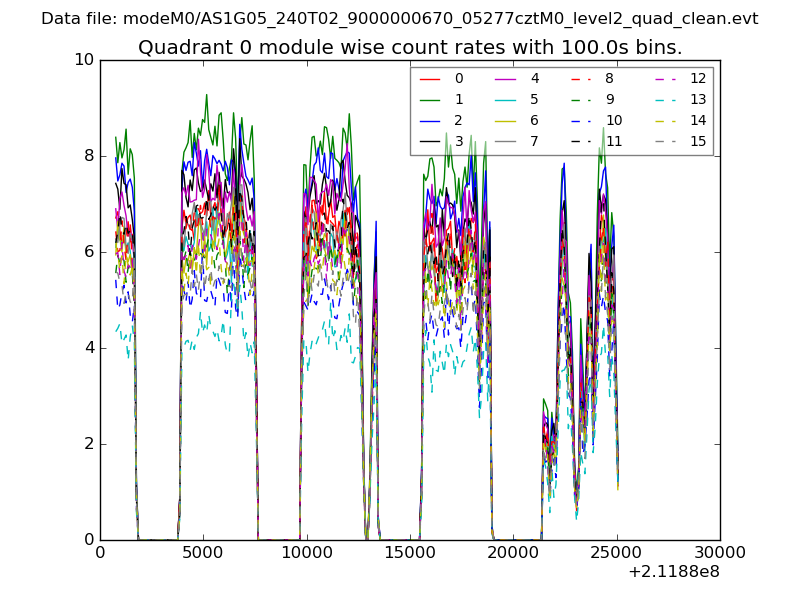 |
 |
| Module-wise count rates for Quadrant B Data is divided into 100 sec bins |
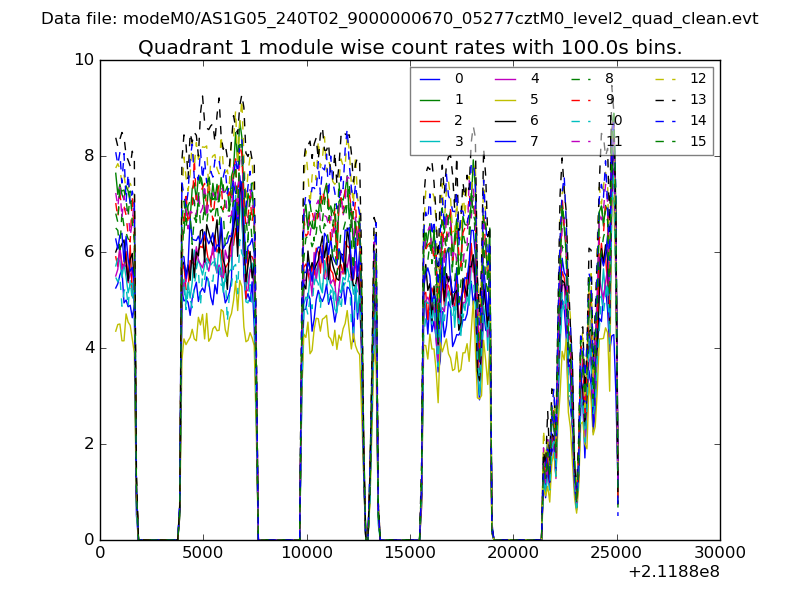 |
 |
| Module-wise count rates for Quadrant C Data is divided into 100 sec bins |
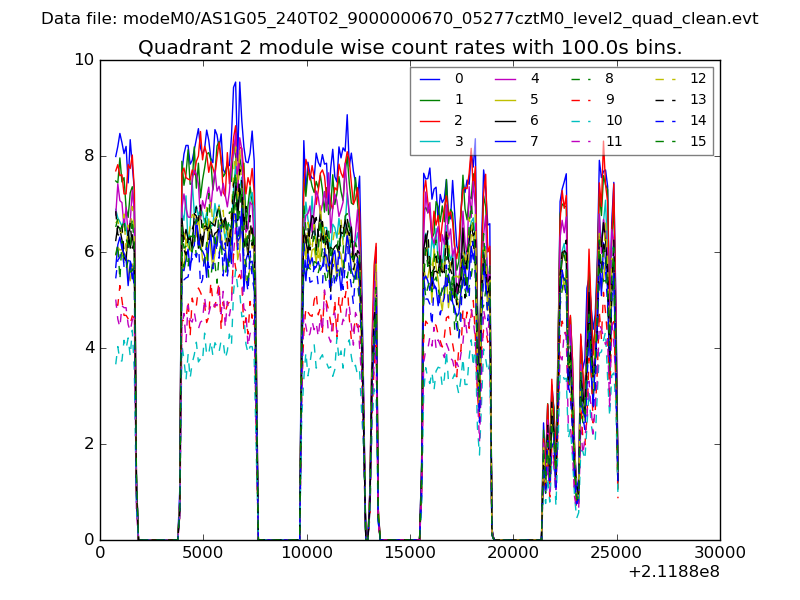 |
 |
| Module-wise count rates for Quadrant D Data is divided into 100 sec bins |
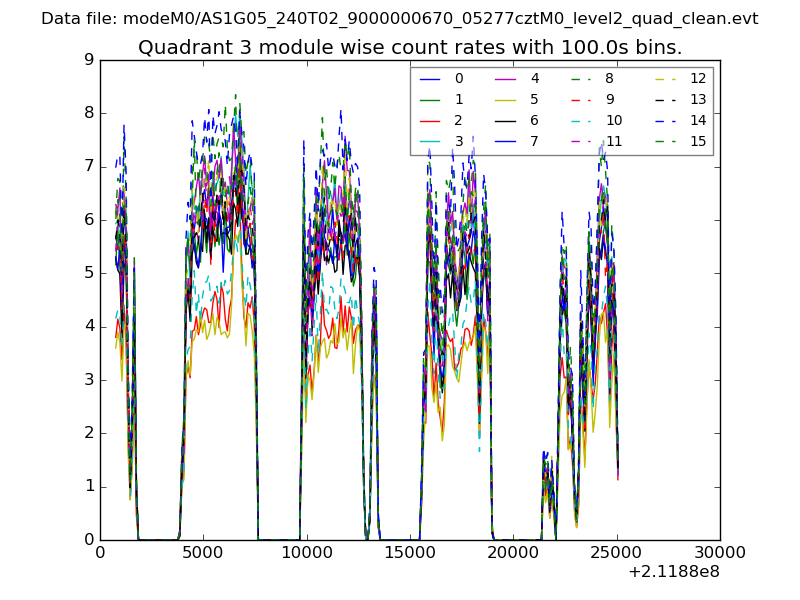 |
 |
| Parameter | Plot |
|---|---|
| CZT HV Monitor | 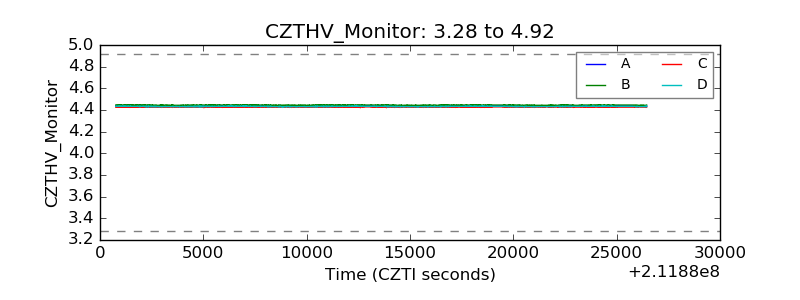 |
| D_VDD | 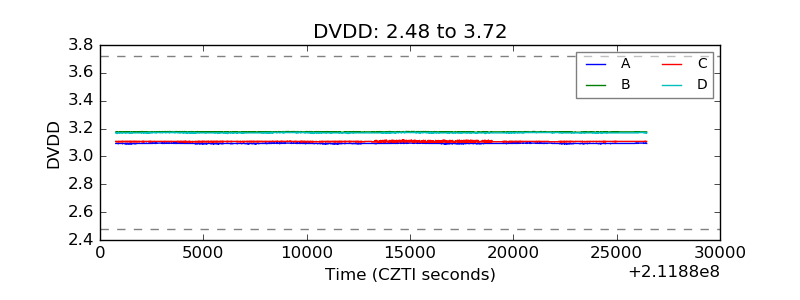 |
| Temperature 1 | 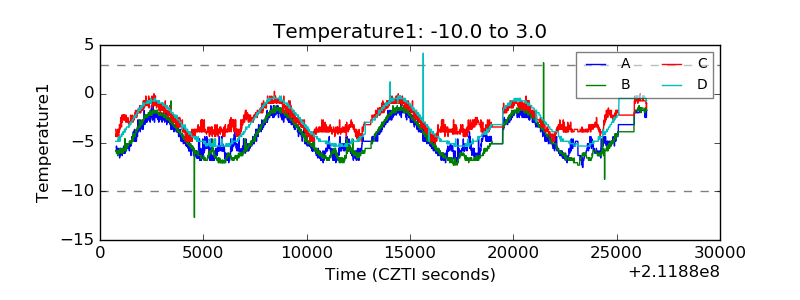 |
| Veto HV Monitor | 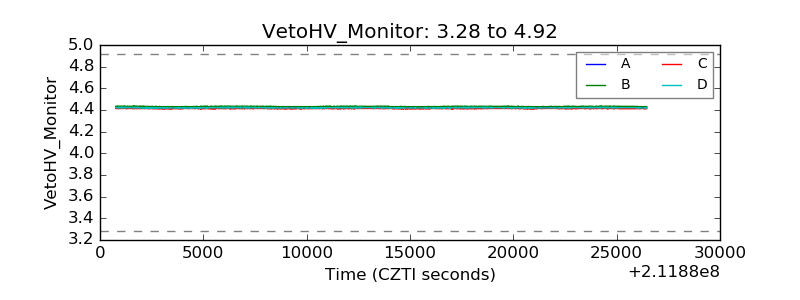 |
| Veto LLD |  |
| Alpha Counter | 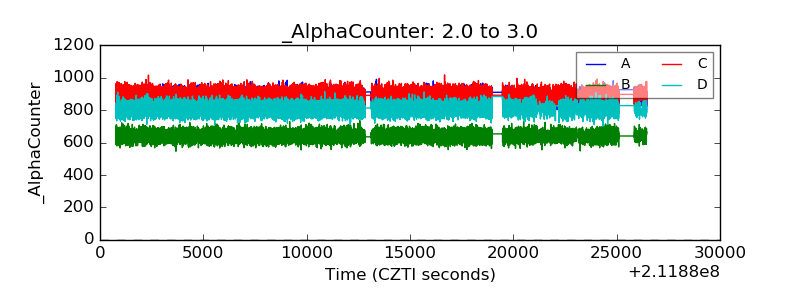 |
| _CPM_Rate | 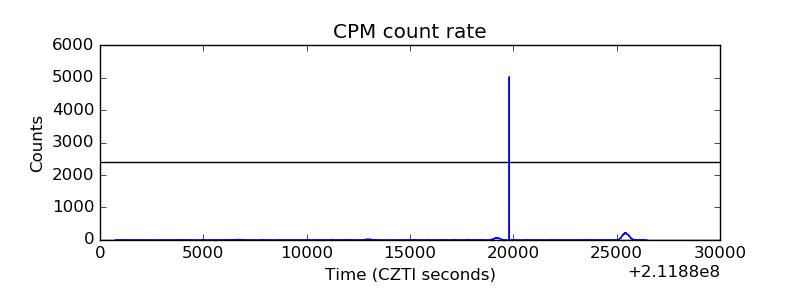 |
| CZT Counter | 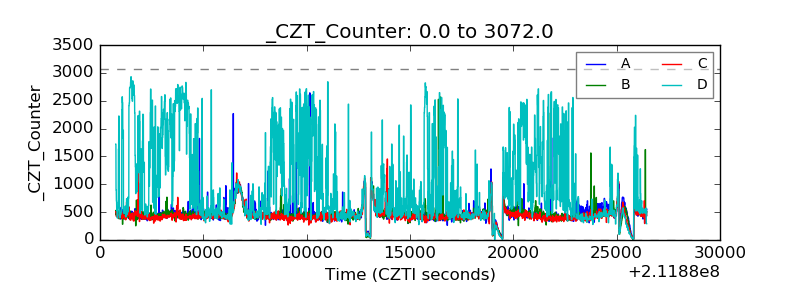 |
| +2.5 Volts monitor |  |
| +5 Volts monitor |  |
| _ROLL_ROT | 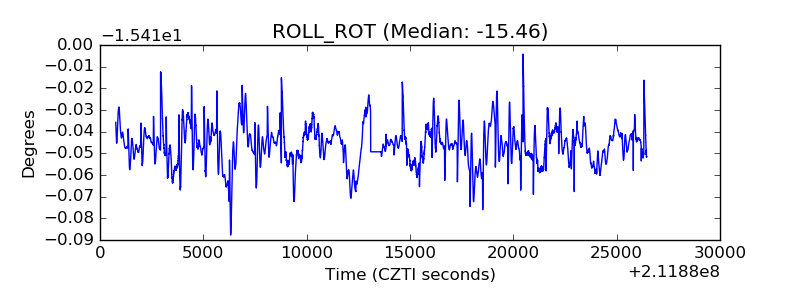 |
| _Roll_DEC | 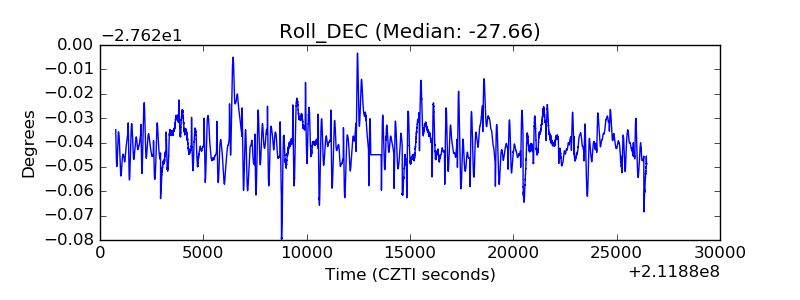 |
| _Roll_RA | 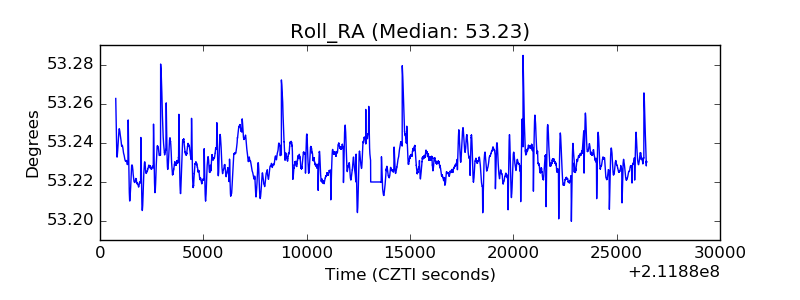 |
| Veto Counter | 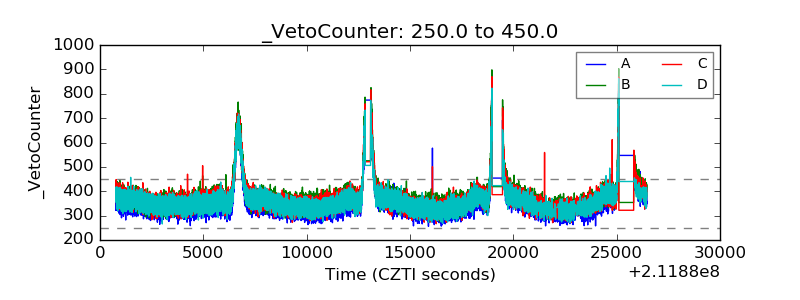 |